Emporia: Fire Incidents, Kansas (KS)
Where are fire incidents reported in Emporia, KS
Something went wrong! Please refresh the page.
| Fire incidents reported | |
|---|---|
| Sreet name | Count |
| KTA | 130 |
| HWY 99 | 114 |
| EAST ST | 90 |
| I35 | 72 |
| SOUTH AVE | 72 |
| 6TH | 70 |
| INDUSTRIAL RD | 68 |
| RD E | 68 |
| I-35 | 64 |
| WEST ST | 62 |
| COMMERCIAL | 60 |
| 12TH AVE | 58 |
| COMMERCIAL ST | 54 |
| MERCHANT | 52 |
| RD 200 | 52 |
| MERCHANT ST | 50 |
| RD 190 | 50 |
| MECHANIC | 48 |
| RD 175 | 48 |
| HWY 50 | 46 |
| RD 170 | 46 |
| 12TH | 44 |
| 6TH AVE | 44 |
| CONGRESS | 42 |
| GRAPHIC ARTS RD | 42 |
| PRAIRIE | 42 |
| SOUTH AV | 42 |
| COTTONWOOD | 40 |
| SYLVAN | 40 |
| CONGRESS ST | 38 |
| Other | 588 |
2002 - 2018 National Fire Incident Reporting System (NFIRS) incidents
- Incident types reported to NFIRS in Emporia, KS
- 9,23263.8%Rescue & EMS
- 2,33616.1%Fire
- 1,65011.4%Hazardous Condition
- 5443.8%False Alarm
- 5263.6%Good Intent Call
- 1531.1%Service Call
- 210.1%Overpressure Rupture
- Fire incident types reported to NFIRS in Emporia, KS
- 1,12648.2%Outside Fires
- 77333.1%Structure Fires
- 36715.7%Mobile Property/Vehicle Fires
- 703.0%Other
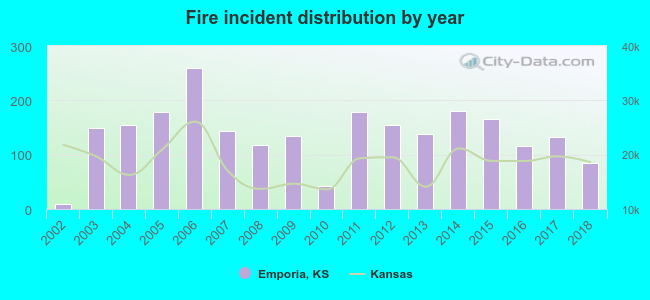 Based on the data from the years 2002 - 2018 the average number of fire incidents per year is 137. The highest number of fires - 260 took place in 2006, and the least - 9 in 2002. The data has a growing trend.
 The median response time based on all reported fire incidents is 6 minutes. This is close to the state median value.
The median response time in Emporia, KS compared to nearest cities:
(Note: Based on data for all years, including only cities with at least 500 fire incidents)
| Emporia: | 6 minutes |
| Osage City: | 10 minutes |
| Burlington: | 10 minutes |
| Burlingame: | 12 minutes |
| Lyndon: | 10 minutes |
| Carbondale: | 10 minutes |
| Auburn: | 9 minutes |
| Eureka: | 5 minutes |
| Yates Center: | 10 minutes |
 Based on the reports from the years 2002 - 2018 the average number of fire-related yearly deaths is 1. The highest number of reported deaths - 2 took place in 2006, and the lowest - 0 in 2002. The data has a constant trend.
 According to the reports from the years 2002 - 2018 the average number of fire-related yearly casualties is 1. The highest number of reported injuries - 3 took place in 2003, and the lowest - 0 in 2002. The data has a constant trend.
The average number of injuries per 1,000 fire incidents is 7. This indicator was the highest - 22 in 2009, and the lowest 0 in 2002. The trend for injuries per 1,000 fire incidents is increasing. Compared to the Kansas value the number of casualties per 1,000 fire incidents is about the same.
According to the reports from the years 2002 - 2018 the average number of fire-related yearly casualties is 1. The highest number of reported injuries - 3 took place in 2003, and the lowest - 0 in 2002. The data has a constant trend.
The average number of injuries per 1,000 fire incidents is 7. This indicator was the highest - 22 in 2009, and the lowest 0 in 2002. The trend for injuries per 1,000 fire incidents is increasing. Compared to the Kansas value the number of casualties per 1,000 fire incidents is about the same.Casualties per 1,000 incidents in Emporia, KS compared to nearest cities:
(Note: Based on data for all years, including only cities with at least 500 fire incidents)
| Emporia: | 8.1 |
| Osage City: | 1.5 |
| Burlington: | 1.6 |
| Burlingame: | 0.0 |
| Lyndon: | 0.0 |
| Carbondale: | 1.7 |
| Auburn: | 3.1 |
| Eureka: | 5.8 |
| Yates Center: | 0.0 |
 25.8% incidents where reported in the morning and 74.2% in the evening. The most fires (17.3%) took place on Sunday, and the least (12.2%) on Thursday.
 Based on the 2,336 fire incident reports from years 2002 - 2018 most fires (13.4%) took place during March, and the least (6.0%) in September.
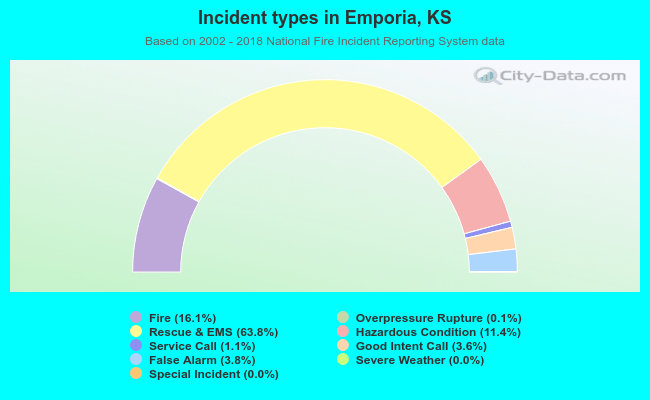 Out of all 14,469 cases reported during the years 2002 - 2018, the most belonged to the categories: Rescue & EMS (63.8%), Fire (16.1%), and Hazardous Condition (11.4%).
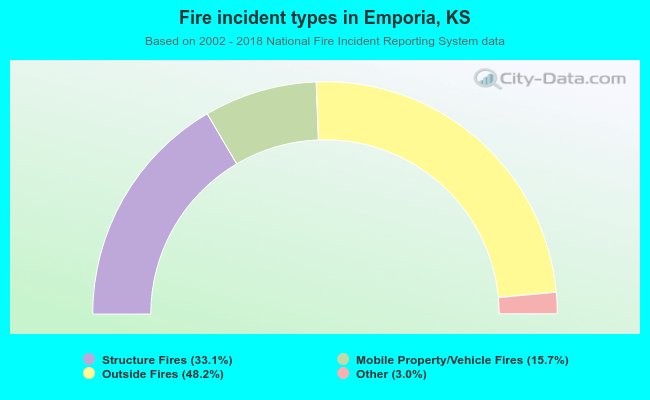 When looking into fire subcategories, the most incidents belonged to: Outside Fires (48.2%), and Structure Fires (33.1%).