Elkins: Fire Incidents, West Virginia (WV)
Where are fire incidents reported in Elkins, WV
Something went wrong! Please refresh the page.
| Fire incidents reported | |
|---|---|
| Sreet name | Count |
| RANDOLPH AVE | 80 |
| BEVERLY PIKE | 70 |
| DAVIS AVE | 66 |
| HARRISON AVE | 56 |
| RT 33 | 56 |
| CENTRAL ST | 54 |
| 11TH ST | 42 |
| 2ND ST | 38 |
| CHENOWETH CREEK RD | 38 |
| GEORGETOWN RD | 36 |
| 1ST ST | 26 |
| HENRY AVE | 26 |
| WARD RD | 26 |
| DAVIS ST | 24 |
| LIVINGSTON AVE | 24 |
| RAILROAD AVE | 24 |
| GILMORE ST | 22 |
| RT 250 | 22 |
| CENTER ST | 20 |
| CRAVENSDALE RD | 20 |
| DIAMOND ST | 20 |
| 33 | 18 |
| CHENOWETH CREEK | 18 |
| FAULKNER RD | 18 |
| FERGUSON RD | 18 |
| HARPERTOWN ROAD | 18 |
| COUNTRY CLUB RD | 16 |
| GATE LN | 16 |
| HEAVENER ACRES | 16 |
| LAVALETTE AVE | 16 |
| Other | 309 |
2003 - 2018 National Fire Incident Reporting System (NFIRS) incidents
- Incident types reported to NFIRS in Elkins, WV
- 1,25325.4%Fire
- 1,17923.9%Hazardous Condition
- 1,12622.8%Rescue & EMS
- 66313.4%Good Intent Call
- 4378.9%Service Call
- 2525.1%False Alarm
- 180.4%Severe Weather
- 50.1%Overpressure Rupture
- Fire incident types reported to NFIRS in Elkins, WV
- 80264.0%Structure Fires
- 27922.3%Outside Fires
- 16913.5%Mobile Property/Vehicle Fires
- 30.2%Other
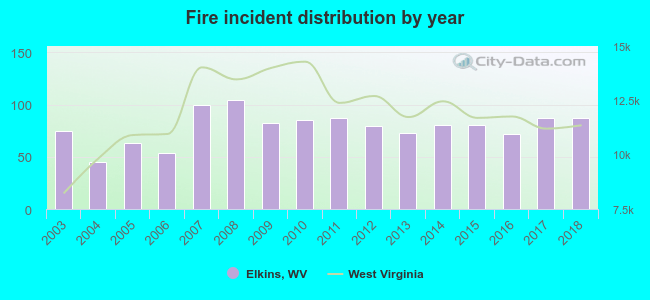 According to the data from the years 2003 - 2018 the average number of fire incidents per year is 78. The highest number of reported fire incidents - 104 took place in 2008, and the least - 45 in 2004. The data has an increasing trend.
The average number of yearly fire incidents per 10k residents in Elkins, WV compared to nearest cities:
(Note: Based on data for the last 3 years, including only cities with population 5,000 and above)
| Elkins: | 112.5 |
| Buckhannon: | 207.2 |
| Grafton: | 132.1 |
| Bridgeport: | 44.7 |
| Clarksburg: | 49.5 |
| Fairmont: | 80.2 |
 The median response time based on all reported fire incidents is 8 minutes. This is lower compared to the West Virginia median value.
The median response time in Elkins, WV compared to nearest cities:
(Note: Based on data for all years, including only cities with at least 500 fire incidents)
| Elkins: | 8 minutes |
| Belington: | 9 minutes |
| Philippi: | 13 minutes |
| Buckhannon: | 12 minutes |
| Grafton: | 10 minutes |
| Bridgeport: | 8 minutes |
| Weston: | 10 minutes |
| Clarksburg: | 6 minutes |
| Shinnston: | 11 minutes |
 Based on the reports from the years 2003 - 2018 the average number of fire-related fatalities per year is 1. The highest number of reported deaths - 7 took place in 2013, and the lowest - 0 in 2003. The data has a constant trend.
 According to the data from the years 2003 - 2018 the average number of fire-related yearly casualties is 2. The highest number of casualties - 5 took place in 2011, and the lowest - 0 in 2004. The data has a declining trend.
The average number of casualties per 1,000 fire incidents is 22. This indicator was the highest - 57 in 2011, and the lowest 0 in 2004. The trend for injuries per 1,000 fires is declining. Compared to the state value the number of injuries per 1,000 fires is much higher.
According to the data from the years 2003 - 2018 the average number of fire-related yearly casualties is 2. The highest number of casualties - 5 took place in 2011, and the lowest - 0 in 2004. The data has a declining trend.
The average number of casualties per 1,000 fire incidents is 22. This indicator was the highest - 57 in 2011, and the lowest 0 in 2004. The trend for injuries per 1,000 fires is declining. Compared to the state value the number of injuries per 1,000 fires is much higher.Casualties per 1,000 incidents in Elkins, WV compared to nearest cities:
(Note: Based on data for all years, including only cities with at least 500 fire incidents)
| Elkins: | 21.5 |
| Belington: | 5.9 |
| Philippi: | 0.0 |
| Buckhannon: | 5.5 |
| Grafton: | 16.9 |
| Bridgeport: | 19.6 |
| Weston: | 13.1 |
| Clarksburg: | 16.9 |
| Shinnston: | 3.5 |
 38.9% incidents where reported in the morning and 61.1% in the evening. The most fires (15.5%) took place on Thursday, and the least (12.1%) on Saturday.
 Based on the 1,253 fires from years 2003 - 2018 most fires (11.6%) took place during April, and the least (6.1%) in August.
 Out of all 4,933 cases reported during the years 2003 - 2018, the most belonged to the categories: Fire (25.4%), Hazardous Condition (23.9%), and Rescue & EMS (22.8%).
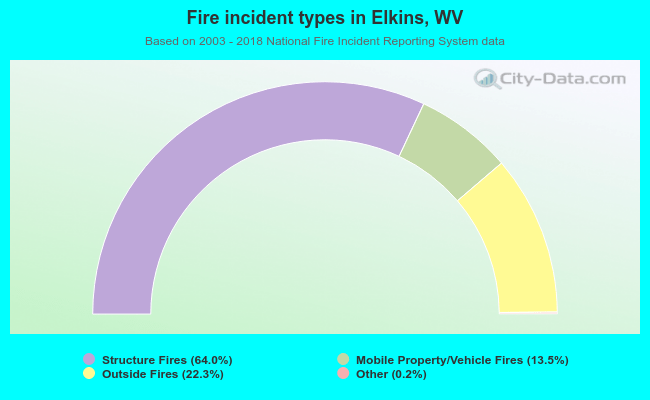 When looking into fire subcategories, the most incidents belonged to: Structure Fires (64.0%), and Outside Fires (22.3%).