Fairmont: Fire Incidents, West Virginia (WV)
Where are fire incidents reported in Fairmont, WV
Something went wrong! Please refresh the page.
| Fire incidents reported | |
|---|---|
| Sreet name | Count |
| FAIRMONT AVE | 74 |
| BUNNER RIDGE RD | 62 |
| LOCUST AVE | 58 |
| VIRGINIA AVE | 38 |
| COUNTRY CLUB RD | 34 |
| WALNUT AVE | 30 |
| AFR DR | 28 |
| EAST GRAFTON RD | 28 |
| MORGANTOWN AVE | 28 |
| HOPEWELL RD | 24 |
| I-79 HWY | 24 |
| MORGAN RIDGE RD | 24 |
| CLEVELAND AVE | 22 |
| GASTON AVE | 22 |
| GRAFTON RD | 22 |
| EAST PARK AVE | 20 |
| I-79 | 20 |
| COLFAX RD | 18 |
| HOULT RD | 18 |
| PENNSYLVANIA AVE | 18 |
| SPEEDWAY AVE | 18 |
| BUNNERS RIDGE RD | 16 |
| MIDDLETOWN MALL | 16 |
| NORWAY RD | 16 |
| HAMILTON ST | 14 |
| HOMEWOOD AVE | 14 |
| LAUREL RUN LAKE RD | 14 |
| MADISON ST | 14 |
| NORWAY ROAD | 14 |
| OPEKISKA RIDGE RD | 14 |
| Other | 1,476 |
2003 - 2018 National Fire Incident Reporting System (NFIRS) incidents
- Incident types reported to NFIRS in Fairmont, WV
- 9,40749.9%Rescue & EMS
- 2,47413.1%Hazardous Condition
- 2,27812.1%Good Intent Call
- 2,23811.9%Fire
- 1,5558.2%Service Call
- 7794.1%False Alarm
- 820.4%Severe Weather
- 310.2%Special Incident
- Fire incident types reported to NFIRS in Fairmont, WV
- 1,32759.3%Structure Fires
- 51122.8%Outside Fires
- 32114.3%Mobile Property/Vehicle Fires
- 793.5%Other
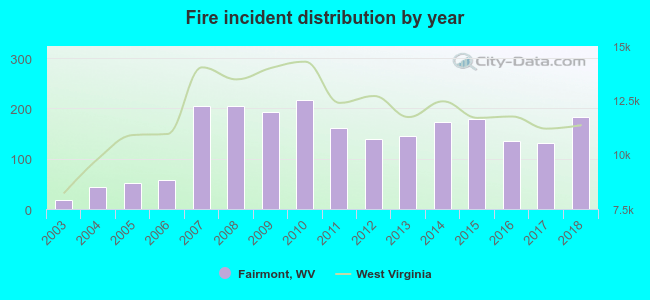 According to the data from the years 2003 - 2018 the average number of fire incidents per year is 140. The highest number of reported fire incidents - 216 took place in 2010, and the least - 17 in 2003. The data has an increasing trend.
The average number of yearly fire incidents per 10k residents in Fairmont, WV compared to nearest cities:
(Note: Based on data for the last 3 years, including only cities with population 5,000 and above)
| Fairmont: | 80.2 |
| Grafton: | 132.1 |
| Bridgeport: | 44.7 |
| Morgantown: | 125.2 |
| Brookhaven: | 4.5 |
| Clarksburg: | 49.5 |
| Cheat Lake: | 2.1 |
 The median response time based on all reported fire incidents is 9 minutes. This is about the same as the West Virginia median value.
The median response time in Fairmont, WV compared to nearest cities:
(Note: Based on data for all years, including only cities with at least 500 fire incidents)
| Fairmont: | 9 minutes |
| Shinnston: | 11 minutes |
| Grafton: | 10 minutes |
| Bridgeport: | 8 minutes |
| Morgantown: | 10 minutes |
| Clarksburg: | 6 minutes |
| Philippi: | 13 minutes |
| Salem: | 13 minutes |
| Waynesburg: | 6 minutes |
 Based on the reports from the years 2003 - 2018 the average number of fire-related fatalities per year is 0. The highest number of reported deaths - 1 took place in 2005, and the lowest - 0 in 2003. The data has a growing trend.
 Based on the reports from the years 2003 - 2018 the average number of fire-related yearly casualties is 1. The highest number of casualties - 6 took place in 2008, and the lowest - 0 in 2003. The data has a constant trend.
The average number of casualties per 1,000 fire incidents is 8. This indicator was the highest - 36 in 2012, and the lowest 0 in 2003. The trend for injuries per 1,000 fires is constant. Compared to the state value the number of casualties per 1,000 fires is higher.
Based on the reports from the years 2003 - 2018 the average number of fire-related yearly casualties is 1. The highest number of casualties - 6 took place in 2008, and the lowest - 0 in 2003. The data has a constant trend.
The average number of casualties per 1,000 fire incidents is 8. This indicator was the highest - 36 in 2012, and the lowest 0 in 2003. The trend for injuries per 1,000 fires is constant. Compared to the state value the number of casualties per 1,000 fires is higher.Casualties per 1,000 incidents in Fairmont, WV compared to nearest cities:
(Note: Based on data for all years, including only cities with at least 500 fire incidents)
| Fairmont: | 9.4 |
| Shinnston: | 3.5 |
| Grafton: | 16.9 |
| Bridgeport: | 19.6 |
| Morgantown: | 3.5 |
| Clarksburg: | 16.9 |
| Philippi: | 0.0 |
| Salem: | 10.4 |
| Waynesburg: | 14.9 |
 34.7% incidents where reported in the morning and 65.3% in the evening. The most fires (16.2%) took place on Tuesday, and the least (12.3%) on Monday.
 Based on the 2,238 fire incidents from years 2003 - 2018 most fires (10.2%) took place during March, and the least (6.5%) in August.
 Out of all 18,860 cases reported during the years 2003 - 2018, the most belonged to the categories: Rescue & EMS (49.9%), Hazardous Condition (13.1%), and Good Intent Call (12.1%).
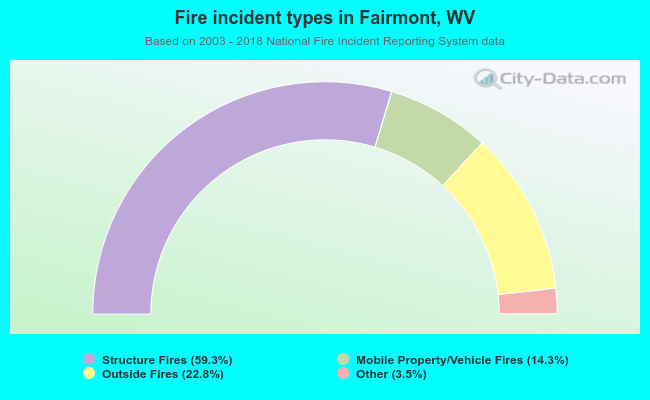 When looking into fire subcategories, the most incidents belonged to: Structure Fires (59.3%), and Outside Fires (22.8%).