El Segundo: Fire Incidents, California (CA)
Where are fire incidents reported in El Segundo, CA
Something went wrong! Please refresh the page.
|
| |||||||||||||||||||||||||||||||||||||||||||||||||||||||||||||||||||||||||||||||||||||||||||||||||||||||||||||
2005 - 2018 National Fire Incident Reporting System (NFIRS) incidents
- Incident types reported to NFIRS in El Segundo, CA
- 6,97257.6%Rescue & EMS
- 1,27210.5%Hazardous Condition
- 1,0959.1%False Alarm
- 9097.5%Good Intent Call
- 8497.0%Service Call
- 6885.7%Fire
- 2612.2%Special Incident
- 300.2%Overpressure Rupture
- 180.1%Severe Weather
- Fire incident types reported to NFIRS in El Segundo, CA
- 28341.1%Outside Fires
- 28140.8%Structure Fires
- 11216.3%Mobile Property/Vehicle Fires
- 121.7%Other
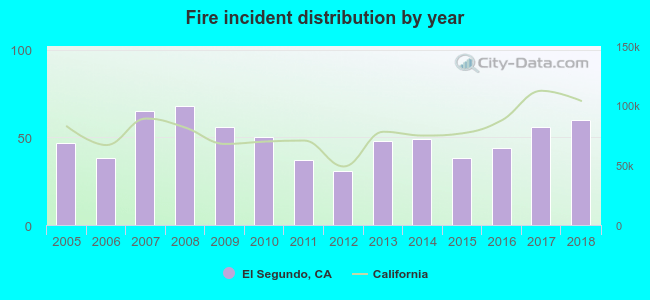 According to the data from the years 2005 - 2018 the average number of fires per year is 49. The highest number of reported fire incidents - 68 took place in 2008, and the least - 31 in 2012. The data has a rising trend.
The average number of yearly fire incidents per 10k residents in El Segundo, CA compared to nearest cities:
(Note: Based on data for the last 3 years, including only cities with population 5,000 and above)
| El Segundo: | 31.3 |
| Manhattan Beach: | 13.8 |
| Lennox: | 13.5 |
| Hawthorne: | 18.5 |
| Hermosa Beach: | 8.2 |
| Lawndale: | 14.3 |
| Inglewood: | 23.8 |
| Redondo Beach: | 17.9 |
| Marina del Rey: | 28.9 |
 The median response time based on all reported fire incidents is 5 minutes. This is lower compared to the California median value.
The median response time in El Segundo, CA compared to nearest cities:
(Note: Based on data for all years, including only cities with at least 500 fire incidents)
| El Segundo: | 5 minutes |
| Manhattan Beach: | 5 minutes |
| Hawthorne: | 4 minutes |
| Hermosa Beach: | 5 minutes |
| Inglewood: | 4 minutes |
| Redondo Beach: | 5 minutes |
| Gardena: | 5 minutes |
| Culver City: | 6 minutes |
| Torrance: | 5 minutes |
 38.5% incidents where reported in the morning and 61.5% in the evening. The most fires (16.6%) took place on Friday, and the least (11.8%) on Sunday.
 Based on the 688 incident reports from years 2005 - 2018 most fires (10.3%) took place during July, and the least (5.1%) in March.
 Out of all 12,094 cases reported during the years 2005 - 2018, the most belonged to the categories: Rescue & EMS (57.6%), Hazardous Condition (10.5%), and False Alarm (9.1%).
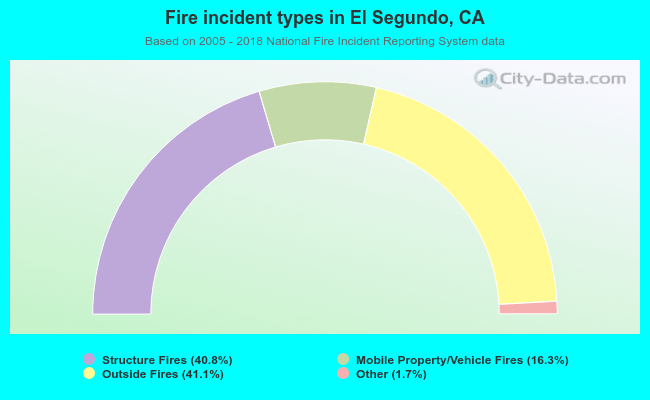 When looking into fire subcategories, the most incidents belonged to: Outside Fires (41.1%), and Structure Fires (40.8%).