Gardena: Fire Incidents, California (CA)
Where are fire incidents reported in Gardena, CA
Something went wrong! Please refresh the page.
| Fire incidents reported | |
|---|---|
| Sreet name | Count |
| ROSECRANS | 172 |
| VERMONT | 150 |
| REDONDO BEACH | 148 |
| WESTERN | 124 |
| EL SEGUNDO | 98 |
| NORMANDIE | 82 |
| BUDLONG | 70 |
| CRENSHAW | 68 |
| 146TH | 66 |
| 141ST | 62 |
| MARINE | 60 |
| 135TH | 58 |
| FIGUEROA ST | 44 |
| 132ND | 42 |
| ARTESIA | 42 |
| VAN NESS | 42 |
| 139TH | 40 |
| BERENDO | 40 |
| 145TH | 38 |
| 130TH | 32 |
| GARDENA | 32 |
| 134TH | 30 |
| 144TH | 28 |
| DENKER | 26 |
| 147TH | 24 |
| 157TH | 24 |
| CIMARRON | 24 |
| GRAMERCY | 24 |
| HALLDALE | 24 |
| SB 110 FY X REDONDO BEACH BL | 24 |
2005 - 2018 National Fire Incident Reporting System (NFIRS) incidents
- Incident types reported to NFIRS in Gardena, CA
- 17,64063.1%Rescue & EMS
- 5,37619.2%Good Intent Call
- 1,7116.1%False Alarm
- 1,4165.1%Fire
- 9293.3%Hazardous Condition
- 7792.8%Service Call
- 810.3%Special Incident
- Fire incident types reported to NFIRS in Gardena, CA
- 51336.2%Outside Fires
- 47333.4%Structure Fires
- 30121.3%Mobile Property/Vehicle Fires
- 1299.1%Other
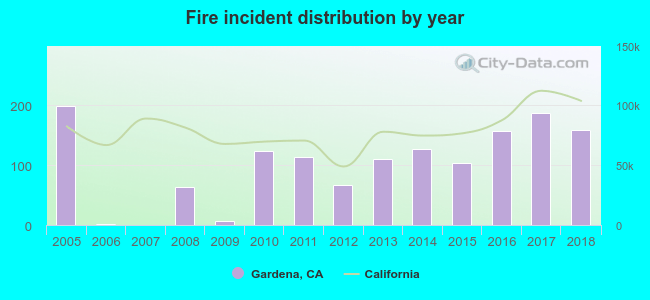 Based on the data from the years 2005 - 2018 the average number of fires per year is 101. The highest number of fire incidents - 199 took place in 2005, and the least - 0 in 2007. The data has a decreasing trend.
The average number of yearly fire incidents per 10k residents in Gardena, CA compared to nearest cities:
(Note: Based on data for the last 3 years, including only cities with population 5,000 and above)
| Gardena: | 27.7 |
| Lawndale: | 14.3 |
| Hawthorne: | 18.5 |
| Lennox: | 13.5 |
| Torrance: | 13.1 |
| Carson: | 21.2 |
| Redondo Beach: | 17.9 |
| Compton: | 28.2 |
| Inglewood: | 23.8 |
 The median response time based on all reported fire incidents is 5 minutes. This is lower than the California median value.
The median response time in Gardena, CA compared to nearest cities:
(Note: Based on data for all years, including only cities with at least 500 fire incidents)
| Gardena: | 5 minutes |
| Hawthorne: | 4 minutes |
| Torrance: | 5 minutes |
| Carson: | 4 minutes |
| Redondo Beach: | 5 minutes |
| Compton: | 6 minutes |
| Inglewood: | 4 minutes |
| Hermosa Beach: | 5 minutes |
| Manhattan Beach: | 5 minutes |
 39.3% incidents where reported in the morning and 60.7% in the evening. The most fires (17.4%) took place on Sunday, and the least (12.6%) on Thursday.
 Based on the 1,416 fire incidents from years 2005 - 2018 most fires (10.9%) took place during January, and the least (6.1%) in September.
 Out of all 27,957 cases reported during the years 2005 - 2018, the most belonged to the categories: Rescue & EMS (63.1%), Good Intent Call (19.2%), and False Alarm (6.1%).
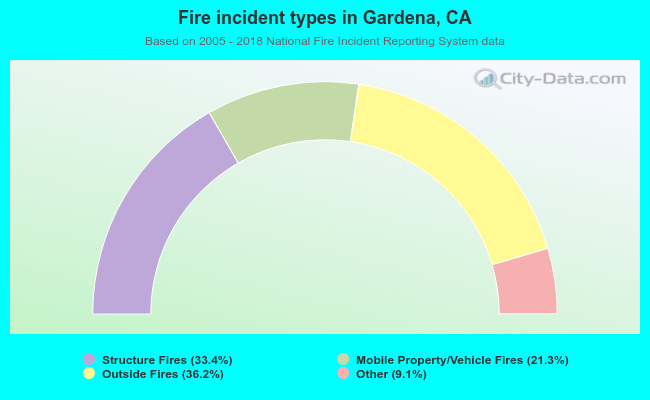 When looking into fire subcategories, the most reports belonged to: Outside Fires (36.2%), and Structure Fires (33.4%).