El Monte: Fire Incidents, California (CA)
Where are fire incidents reported in El Monte, CA
Something went wrong! Please refresh the page.
| Fire incidents reported | |
|---|---|
| Sreet name | Count |
| VALLEY | 252 |
| PECK | 184 |
| GARVEY | 148 |
| MAXSON | 120 |
| SANTA ANITA | 120 |
| LOWER AZUSA | 110 |
| DURFEE | 102 |
| ELLIOTT | 96 |
| COGSWELL | 72 |
| RAMONA | 68 |
| BALDWIN | 66 |
| TYLER | 66 |
| GILMAN | 54 |
| MAGNOLIA | 50 |
| MOUNTAIN VIEW | 46 |
| PENN MAR | 42 |
| BONWOOD | 38 |
| ARDEN | 32 |
| LA MADERA | 32 |
| RANCHITO | 30 |
| BRYANT | 28 |
| KLINGERMAN | 28 |
| POTRERO | 28 |
| ROWLAND | 28 |
| BROCKWAY | 26 |
| FERRIS | 26 |
| FINEVIEW | 26 |
| BASYE | 24 |
| EASY | 22 |
| FELIPE | 22 |
2005 - 2018 National Fire Incident Reporting System (NFIRS) incidents
- Incident types reported to NFIRS in El Monte, CA
- 24,08065.4%Rescue & EMS
- 7,52220.4%Good Intent Call
- 1,7444.7%False Alarm
- 1,6114.4%Fire
- 1,0772.9%Hazardous Condition
- 7392.0%Service Call
- Fire incident types reported to NFIRS in El Monte, CA
- 68842.7%Outside Fires
- 47029.2%Structure Fires
- 33020.5%Mobile Property/Vehicle Fires
- 1237.6%Other
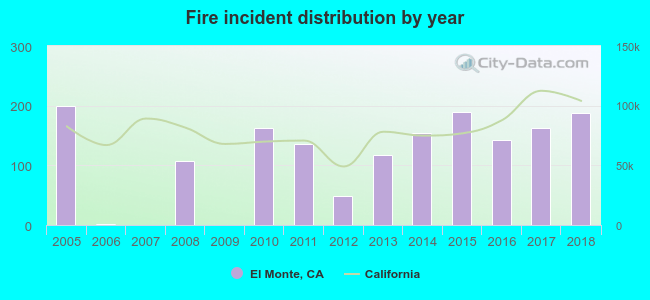 According to the data from the years 2005 - 2018 the average number of fires per year is 115. The highest number of reported fire incidents - 200 took place in 2005, and the least - 0 in 2007. The data has a declining trend.
The average number of yearly fire incidents per 10k residents in El Monte, CA compared to nearest cities:
(Note: Based on data for the last 3 years, including only cities with population 5,000 and above)
| El Monte: | 14.1 |
| South El Monte: | 26.1 |
| Temple City: | 7.8 |
| Rosemead: | 13.7 |
| Baldwin Park: | 8.9 |
| Arcadia: | 12.9 |
| South San Gabriel: | 12.4 |
| San Gabriel: | 15.8 |
| East San Gabriel: | 1.7 |
 The median response time based on all reported fire incidents is 4 minutes. This is lower compared to the California median value.
The median response time in El Monte, CA compared to nearest cities:
(Note: Based on data for all years, including only cities with at least 500 fire incidents)
| El Monte: | 4 minutes |
| Rosemead: | 4 minutes |
| Baldwin Park: | 5 minutes |
| Arcadia: | 5 minutes |
| Monrovia: | 5 minutes |
| Industry: | 6 minutes |
| Hacienda Heights: | 6 minutes |
| Alhambra: | 5 minutes |
| West Covina: | 6 minutes |
 34.5% incidents where reported in the morning and 65.5% in the evening. The most fires (15.4%) took place on Sunday, and the least (12.0%) on Tuesday.
 Based on the 1,611 incident reports from years 2005 - 2018 most fires (11.2%) took place during July, and the least (6.5%) in December.
 Out of all 36,819 cases reported during the years 2005 - 2018, the most belonged to the categories: Rescue & EMS (65.4%), Good Intent Call (20.4%), and False Alarm (4.7%).
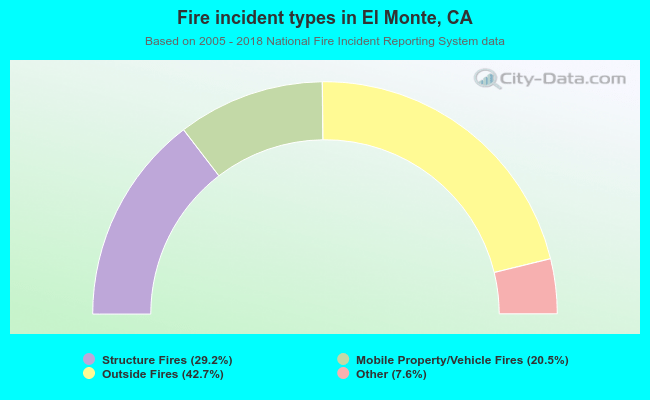 When looking into fire subcategories, the most incidents belonged to: Outside Fires (42.7%), and Structure Fires (29.2%).