Alhambra: Fire Incidents, California (CA)
Where are fire incidents reported in Alhambra, CA
Something went wrong! Please refresh the page.
| Fire incidents reported | |
|---|---|
| Sreet name | Count |
| VALLEY BLVD | 178 |
| MAIN ST | 138 |
| FREMONT AVE | 106 |
| GARFIELD AVE | 100 |
| ATLANTIC BLVD | 88 |
| ALMANSOR ST | 82 |
| CHAPEL AVE | 72 |
| COMMONWEALTH AVE | 52 |
| MARGUERITA AVE | 52 |
| SECOND ST | 48 |
| FOURTH ST | 42 |
| CURTIS AVE | 38 |
| STONEMAN AVE | 38 |
| GRANADA AVE | 36 |
| ELECTRIC AVE | 34 |
| MONTEREY ST | 34 |
| CAMPBELL AVE | 32 |
| HELLMAN AVE | 32 |
| HIDALGO AVE | 32 |
| I-10 FWY | 32 |
| MARENGO AVE | 32 |
| RAMONA RD | 32 |
| OLIVE AVE | 28 |
| PALM AVE | 28 |
| FIRST ST | 26 |
| GARVEY AVE | 26 |
| THIRD ST | 26 |
| ALHAMBRA RD | 24 |
| CORDOVA ST | 24 |
| SIXTH ST | 24 |
2005 - 2018 National Fire Incident Reporting System (NFIRS) incidents
- Incident types reported to NFIRS in Alhambra, CA
- 18,93475.2%Rescue & EMS
- 1,6066.4%Good Intent Call
- 1,2454.9%False Alarm
- 1,2114.8%Fire
- 1,0804.3%Hazardous Condition
- 9903.9%Service Call
- 720.3%Special Incident
- Fire incident types reported to NFIRS in Alhambra, CA
- 61450.7%Structure Fires
- 29224.1%Outside Fires
- 22418.5%Mobile Property/Vehicle Fires
- 816.7%Other
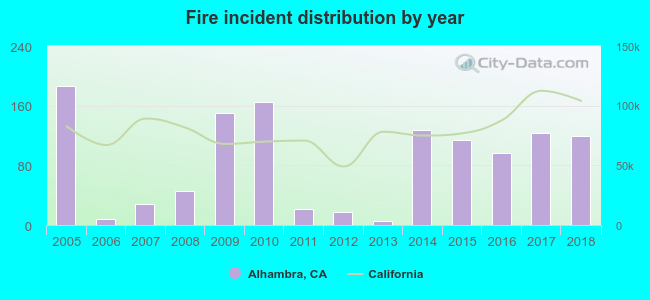 According to the data from the years 2005 - 2018 the average number of fires per year is 87. The highest number of reported fire incidents - 186 took place in 2005, and the least - 6 in 2013. The data has a dropping trend.
The average number of yearly fire incidents per 10k residents in Alhambra, CA compared to nearest cities:
(Note: Based on data for the last 3 years, including only cities with population 5,000 and above)
| Alhambra: | 13.2 |
| Monterey Park: | 3.6 |
| San Gabriel: | 15.8 |
| South Pasadena: | 16.9 |
| San Marino: | 11.7 |
| Rosemead: | 13.7 |
| South San Gabriel: | 12.4 |
| East Los Angeles: | 17.0 |
| East San Gabriel: | 1.7 |
 The median response time based on all reported fire incidents is 5 minutes. This is lower compared to the California median value.
The median response time in Alhambra, CA compared to nearest cities:
(Note: Based on data for all years, including only cities with at least 500 fire incidents)
| Alhambra: | 5 minutes |
| Monterey Park: | 5 minutes |
| Rosemead: | 4 minutes |
| East Los Angeles: | 5 minutes |
| Montebello: | 7 minutes |
| Pasadena: | 5 minutes |
| Commerce: | 5 minutes |
| El Monte: | 4 minutes |
| Arcadia: | 5 minutes |
 34.8% incidents where reported in the morning and 65.2% in the evening. The most fires (16.9%) took place on Thursday, and the least (12.1%) on Wednesday.
 Based on the 1,211 fires from years 2005 - 2018 most fires (9.8%) took place during January, and the least (6.4%) in June.
 Out of all 25,164 cases reported during the years 2005 - 2018, the most belonged to the categories: Rescue & EMS (75.2%), Good Intent Call (6.4%), and False Alarm (4.9%).
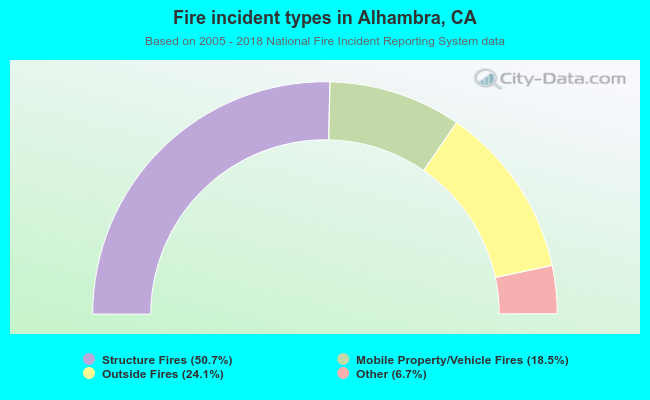 When looking into fire subcategories, the most incidents belonged to: Structure Fires (50.7%), and Outside Fires (24.1%).