Eatonton: Fire Incidents, Georgia (GA)
Where are fire incidents reported in Eatonton, GA
Something went wrong! Please refresh the page.
|
| |||||||||||||||||||||||||||||||||||||||||||||||||||||||||||||||||||||||||||||||||||||||||||||||||||||||||||||
| Other | 435 | |||||||||||||||||||||||||||||||||||||||||||||||||||||||||||||||||||||||||||||||||||||||||||||||||||||||||||||
2002 - 2018 National Fire Incident Reporting System (NFIRS) incidents
- Incident types reported to NFIRS in Eatonton, GA
- 2,83649.0%Rescue & EMS
- 1,12119.4%Fire
- 71912.4%Service Call
- 4467.7%Hazardous Condition
- 3025.2%False Alarm
- 2714.7%Good Intent Call
- 470.8%Special Incident
- 350.6%Severe Weather
- Fire incident types reported to NFIRS in Eatonton, GA
- 53247.5%Outside Fires
- 26423.6%Structure Fires
- 19817.7%Mobile Property/Vehicle Fires
- 12711.3%Other
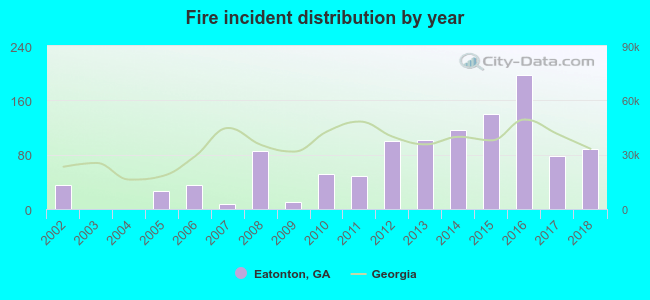 According to the data from the years 2002 - 2018 the average number of fires per year is 66. The highest number of reported fire incidents - 197 took place in 2016, and the least - 0 in 2003. The data has a growing trend.
The average number of yearly fire incidents per 10k residents in Eatonton, GA compared to nearest cities:
(Note: Based on data for the last 3 years, including only cities with population 5,000 and above)
| Eatonton: | 187.1 |
| Milledgeville: | 136.4 |
| Covington: | 246.6 |
| Macon: | 117.8 |
| Monroe: | 139.5 |
| Sandersville: | 128.6 |
| Locust Grove: | 116.9 |
| Lizella: | 21.5 |
| Conyers: | 159.9 |
 The median response time based on all reported fire incidents is 7 minutes. This is similar to the state median value.
The median response time in Eatonton, GA compared to nearest cities:
(Note: Based on data for all years, including only cities with at least 500 fire incidents)
| Eatonton: | 7 minutes |
| Madison: | 9 minutes |
| Milledgeville: | 6 minutes |
| Gray: | 6 minutes |
| Covington: | 7 minutes |
| Jackson: | 6 minutes |
| Oxford: | 9 minutes |
| Watkinsville: | 7 minutes |
| Macon: | 4 minutes |
 26.6% incidents where reported in the morning and 73.4% in the evening. The most fires (16.4%) took place on Sunday, and the least (12.9%) on Thursday.
 Based on the 1,121 fire incidents from years 2002 - 2018 most fires (15.5%) took place during March, and the least (3.9%) in August.
 Out of all 5,782 cases reported during the years 2002 - 2018, the most belonged to the categories: Rescue & EMS (49.0%), Fire (19.4%), and Service Call (12.4%).
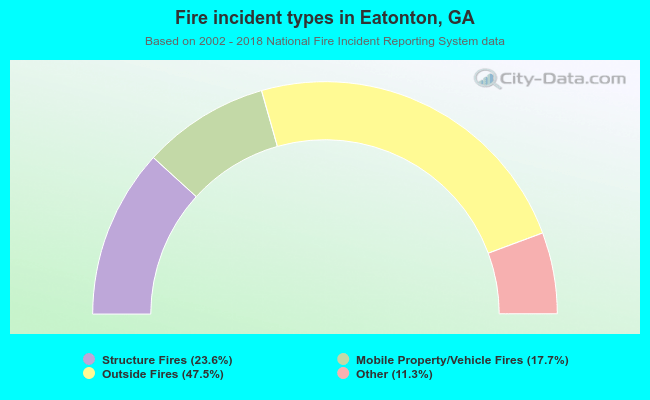 When looking into fire subcategories, the most reports belonged to: Outside Fires (47.5%), and Structure Fires (23.6%).