East Stroudsburg: Fire Incidents, Pennsylvania (PA)
Where are fire incidents reported in East Stroudsburg, PA
Something went wrong! Please refresh the page.
|
| |||||||||||||||||||||||||||||||||||||||||||||||||||||||||||||||||||||||||||||||||||||||||||||||||||||||||||||
2013 - 2018 National Fire Incident Reporting System (NFIRS) incidents
- Incident types reported to NFIRS in East Stroudsburg, PA
- 22743.7%False Alarm
- 12624.3%Fire
- 5310.2%Hazardous Condition
- 448.5%Service Call
- 377.1%Rescue & EMS
- 203.9%Good Intent Call
- 71.3%Severe Weather
- 40.8%Special Incident
- 10.2%Overpressure Rupture
- Fire incident types reported to NFIRS in East Stroudsburg, PA
- 6854.0%Structure Fires
- 2822.2%Mobile Property/Vehicle Fires
- 1915.1%Outside Fires
- 118.7%Other
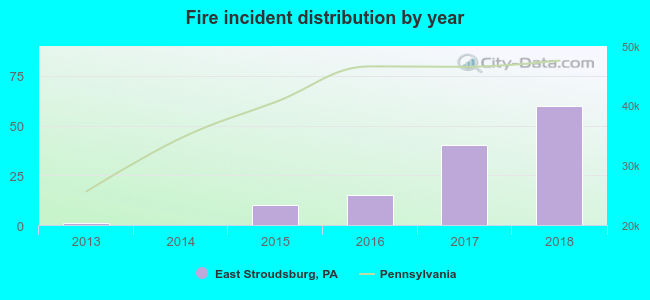 According to the data from the years 2013 - 2018 the average number of fire incidents per year is 21. The highest number of reported fires - 60 took place in 2018, and the least - 0 in 2014. The data has an increasing trend.
The average number of yearly fire incidents per 10k residents in East Stroudsburg, PA compared to nearest cities:
(Note: Based on data for the last 3 years, including only cities with population 5,000 and above)
| East Stroudsburg: | 39.8 |
| Stroudsburg: | 52.4 |
| Bangor: | 32.5 |
| Nazareth: | 52.5 |
| Easton: | 77.1 |
| Wilson: | 3.2 |

 31.0% incidents where reported in the morning and 69.0% in the evening. The most fires (20.6%) took place on Tuesday, and the least (6.3%) on Saturday.
 Based on the 126 incident reports from years 2013 - 2018 most fires (16.7%) took place during March, and the least (3.2%) in October.
 Out of all 519 cases reported during the years 2013 - 2018, the most belonged to the categories: False Alarm (43.7%), Fire (24.3%), and Hazardous Condition (10.2%).
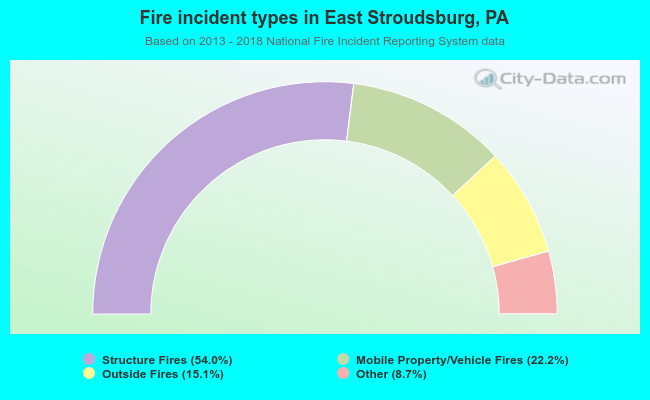 When looking into fire subcategories, the most reports belonged to: Structure Fires (54.0%), and Mobile Property/Vehicle Fires (22.2%).