Clayton: Fire Incidents, New Jersey (NJ)
Where are fire incidents reported in Clayton, NJ
Something went wrong! Please refresh the page.
|
| |||||||||||||||||||||||||||||||||||||||||||||||||||||||||||||||||||||||||||||||||||||||||||||||||||||||||||||
2004 - 2018 National Fire Incident Reporting System (NFIRS) incidents
- Incident types reported to NFIRS in Clayton, NJ
- 39541.1%Hazardous Condition
- 28529.7%Fire
- 939.7%Service Call
- 788.1%False Alarm
- 707.3%Good Intent Call
- 323.3%Rescue & EMS
- 50.5%Special Incident
- 10.1%Overpressure Rupture
- 10.1%Severe Weather
- Fire incident types reported to NFIRS in Clayton, NJ
- 17661.8%Structure Fires
- 9633.7%Outside Fires
- 72.5%Mobile Property/Vehicle Fires
- 62.1%Other
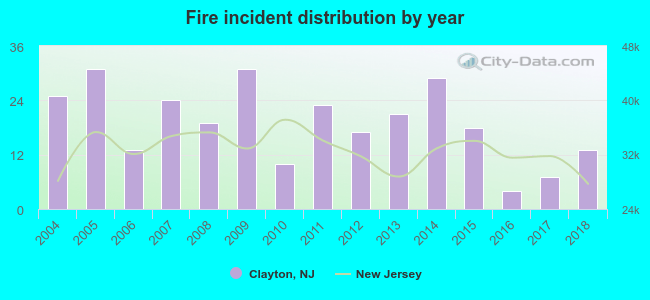 Based on the data from the years 2004 - 2018 the average number of fire incidents per year is 19. The highest number of fires - 31 took place in 2005, and the least - 4 in 2016. The data has a dropping trend.
The average number of yearly fire incidents per 10k residents in Clayton, NJ compared to nearest cities:
(Note: Based on data for the last 3 years, including only cities with population 5,000 and above)
| Clayton: | 9.6 |
| Glassboro: | 55.6 |
| Williamstown: | 24.6 |
| Pitman: | 48.3 |
| Pine Hill: | 69.8 |
| Lindenwold: | 36.9 |
| Berlin: | 33.1 |
| Stratford: | 51.4 |
| Woodbury: | 68.6 |

 28.1% incidents where reported in the morning and 71.9% in the evening. The most fires (16.5%) took place on Tuesday, and the least (10.2%) on Monday.
 Based on the 285 fire incidents from years 2004 - 2018 most fires (12.3%) took place during June, and the least (4.6%) in November.
 Out of all 960 cases reported during the years 2004 - 2018, the most belonged to the categories: Hazardous Condition (41.1%), Fire (29.7%), and Service Call (9.7%).
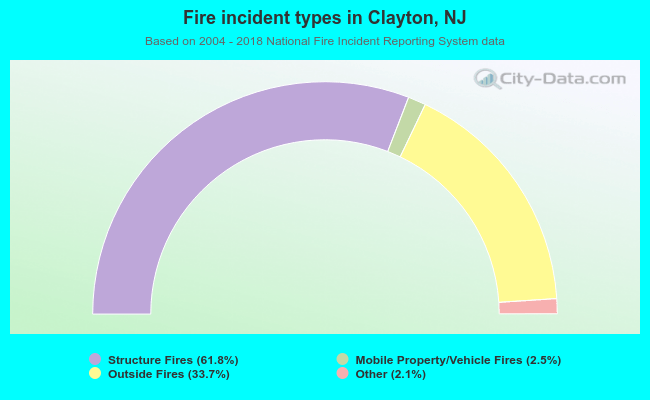 When looking into fire subcategories, the most incidents belonged to: Structure Fires (61.8%), and Outside Fires (33.7%).