Clarksville: Fire Incidents, Arkansas (AR)
Where are fire incidents reported in Clarksville, AR
Something went wrong! Please refresh the page.
| Fire incidents reported | |
|---|---|
| Sreet name | Count |
| MAIN ST | 274 |
| ROGERS ST | 152 |
| I40 HWY | 102 |
| I-40 HWY | 78 |
| HWY 21 | 70 |
| POPLAR ST | 68 |
| CRAWFORD ST | 52 |
| CLARK RD | 50 |
| I-40 | 48 |
| STERLIN HURLEY HWY | 46 |
| CHERRY ST | 42 |
| COLLEGE AVE | 42 |
| CRAWFORD HWY | 40 |
| HWY 352 | 40 |
| SEVIER ST | 34 |
| HWY 164 | 32 |
| MONTGOMERY ST | 32 |
| I40 | 30 |
| HWY 292 | 28 |
| HWY 103 | 24 |
| OAKLAND ST | 24 |
| TAYLOR RD | 24 |
| TAYLOR ST | 24 |
| COUNTRY CLUB RD | 22 |
| RAY RD | 22 |
| BIG DANGER RD | 20 |
| CARTER ST | 20 |
| MARKET ST | 20 |
| MASSENGALE RD | 20 |
| CR 3371 | 18 |
| Other | 435 |
2002 - 2018 National Fire Incident Reporting System (NFIRS) incidents
- Incident types reported to NFIRS in Clarksville, AR
- 1,93351.8%Fire
- 92624.8%Rescue & EMS
- 2907.8%Good Intent Call
- 2847.6%False Alarm
- 1473.9%Hazardous Condition
- 992.7%Service Call
- 320.9%Severe Weather
- 130.3%Overpressure Rupture
- 60.2%Special Incident
- Fire incident types reported to NFIRS in Clarksville, AR
- 99951.7%Outside Fires
- 56829.4%Structure Fires
- 33117.1%Mobile Property/Vehicle Fires
- 351.8%Other
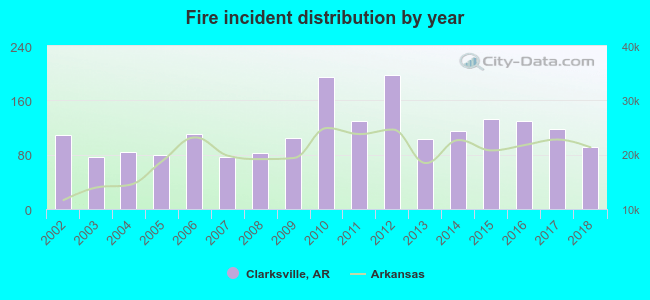 Based on the data from the years 2002 - 2018 the average number of fires per year is 114. The highest number of reported fire incidents - 198 took place in 2012, and the least - 76 in 2003. The data has a dropping trend.
The average number of yearly fire incidents per 10k residents in Clarksville, AR compared to nearest cities:
(Note: Based on data for the last 3 years, including only cities with population 5,000 and above)
| Clarksville: | 120.3 |
| Russellville: | 78.1 |
| Alma: | 185.9 |
| Morrilton: | 87.4 |
| Greenwood: | 84.2 |
| Van Buren: | 82.4 |
| Fort Smith: | 46.3 |
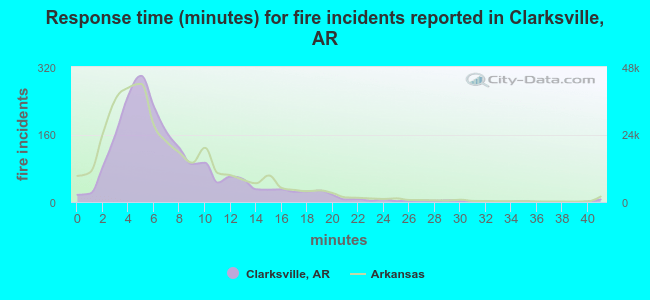 The median response time based on all reported fire incidents is 6 minutes. This is comparable to the Arkansas median value.
The median response time in Clarksville, AR compared to nearest cities:
(Note: Based on data for all years, including only cities with at least 500 fire incidents)
| Clarksville: | 6 minutes |
| Ozark: | 7 minutes |
| Dover: | 10 minutes |
| Russellville: | 5 minutes |
| Pottsville: | 9 minutes |
| Mulberry: | 9 minutes |
| Booneville: | 12 minutes |
| Charleston: | 8 minutes |
| Atkins: | 10 minutes |
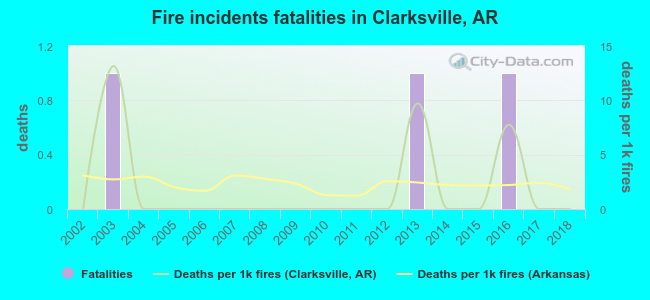 Based on the reports from the years 2002 - 2018 the average number of fire-related fatalities per year is 0. The highest number of deaths - 1 took place in 2003, and the lowest - 0 in 2002. The data has a constant trend.
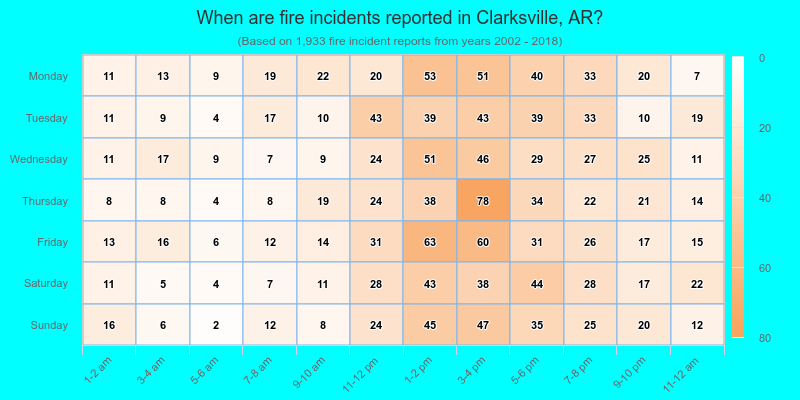
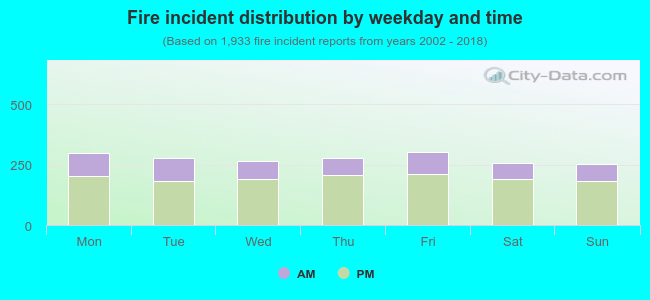 29.1% incidents where reported in the morning and 70.9% in the evening. The most fires (15.7%) took place on Friday, and the least (13.0%) on Sunday.
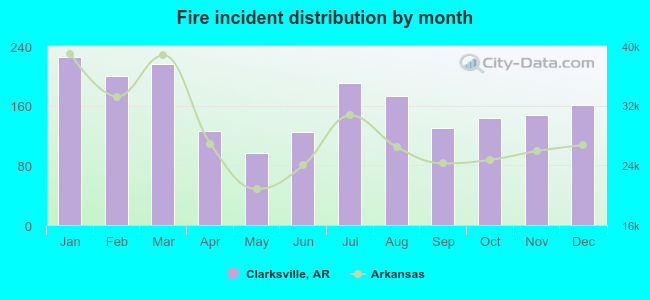 According to the 1,933 reports from years 2002 - 2018 most fires (11.6%) took place during January, and the least (5.0%) in May.
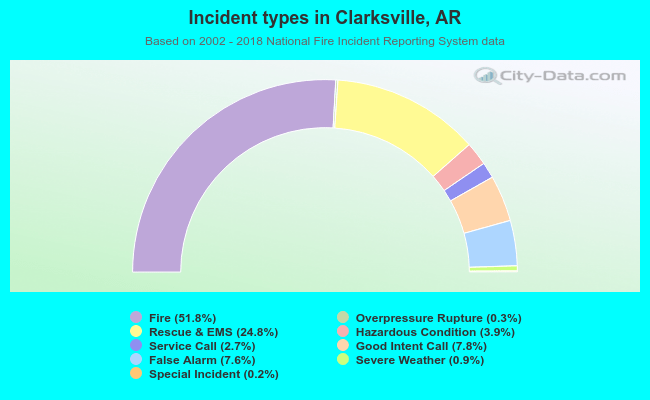 Out of all 3,730 cases reported during the years 2002 - 2018, the most belonged to the categories: Fire (51.8%), Rescue & EMS (24.8%), and Good Intent Call (7.8%).
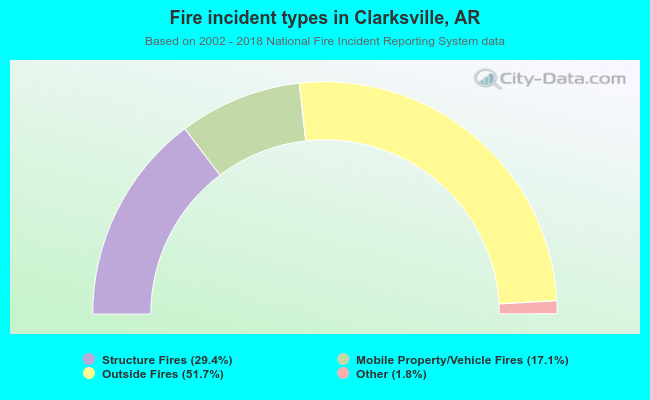 When looking into fire subcategories, the most incidents belonged to: Outside Fires (51.7%), and Structure Fires (29.4%).