Greenwood: Fire Incidents, Arkansas (AR)
Where are fire incidents reported in Greenwood, AR
Something went wrong! Please refresh the page.
|
| |||||||||||||||||||||||||||||||||||||||||||||||||||||||||||||||||||||||||||||||||||||||||||||||||||||||||||||
| Other | 133 | |||||||||||||||||||||||||||||||||||||||||||||||||||||||||||||||||||||||||||||||||||||||||||||||||||||||||||||
2002 - 2018 National Fire Incident Reporting System (NFIRS) incidents
- Incident types reported to NFIRS in Greenwood, AR
- 1,20342.3%Rescue & EMS
- 1,11339.1%Fire
- 2288.0%Good Intent Call
- 1776.2%Hazardous Condition
- 642.2%False Alarm
- 461.6%Service Call
- 50.2%Severe Weather
- 50.2%Special Incident
- 40.1%Overpressure Rupture
- Fire incident types reported to NFIRS in Greenwood, AR
- 64958.3%Outside Fires
- 33730.3%Structure Fires
- 807.2%Mobile Property/Vehicle Fires
- 474.2%Other
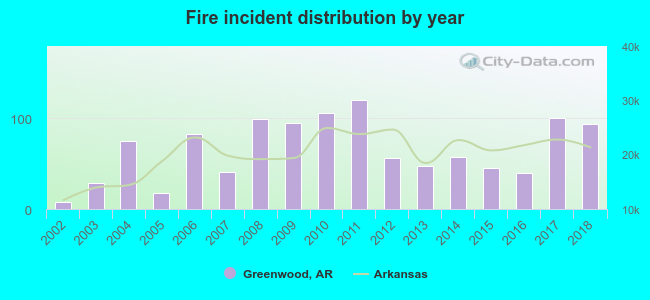 Based on the data from the years 2002 - 2018 the average number of fire incidents per year is 65. The highest number of fires - 120 took place in 2011, and the least - 8 in 2002. The data has a rising trend.
The average number of yearly fire incidents per 10k residents in Greenwood, AR compared to nearest cities:
(Note: Based on data for the last 3 years, including only cities with population 5,000 and above)
| Greenwood: | 84.2 |
| Fort Smith: | 46.3 |
| Van Buren: | 82.4 |
| Alma: | 185.9 |
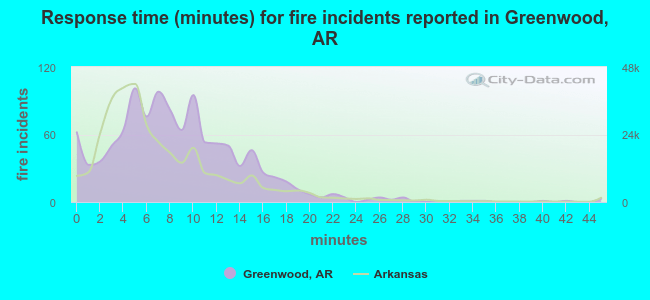 The median response time based on all reported fire incidents is 8 minutes. This is higher than the state median value.
The median response time in Greenwood, AR compared to nearest cities:
(Note: Based on data for all years, including only cities with at least 500 fire incidents)
| Greenwood: | 8 minutes |
| Lavaca: | 6 minutes |
| Mansfield: | 9 minutes |
| Charleston: | 8 minutes |
| Fort Smith: | 3 minutes |
| Van Buren: | 5 minutes |
| Alma: | 8 minutes |
| Booneville: | 12 minutes |
| Mulberry: | 9 minutes |
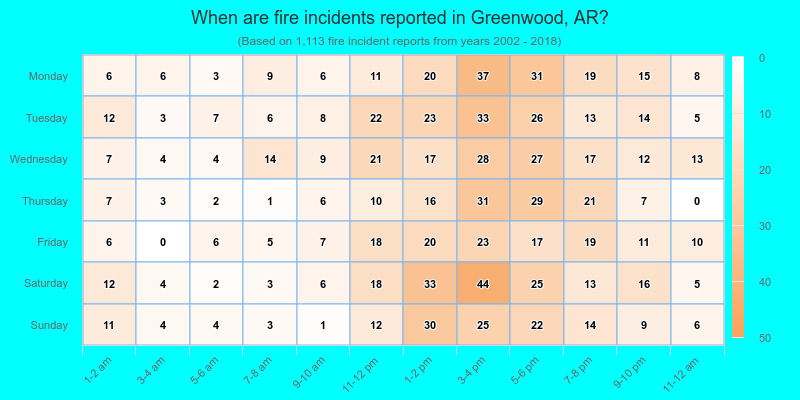
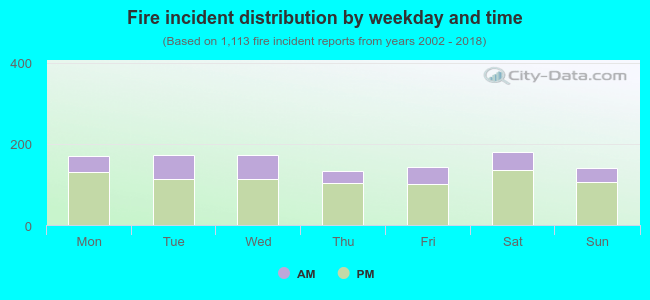 27.8% incidents where reported in the morning and 72.2% in the evening. The most fires (16.3%) took place on Saturday, and the least (11.9%) on Thursday.
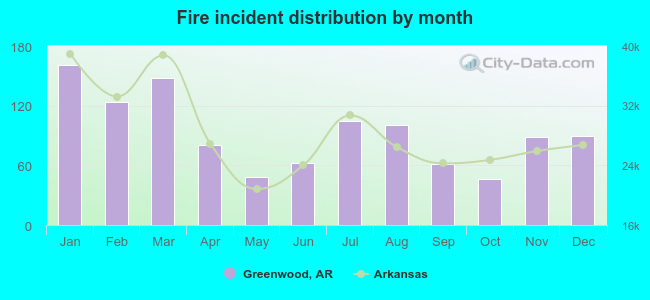 According to the 1,113 fire incidents from years 2002 - 2018 most fires (14.5%) took place during January, and the least (4.1%) in October.
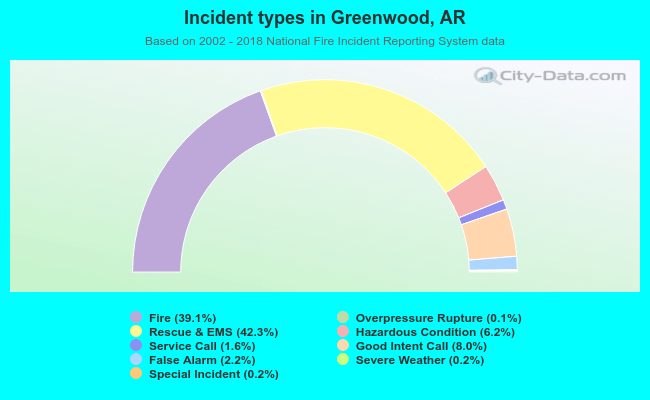 Out of all 2,845 cases reported during the years 2002 - 2018, the most belonged to the categories: Rescue & EMS (42.3%), Fire (39.1%), and Good Intent Call (8.0%).
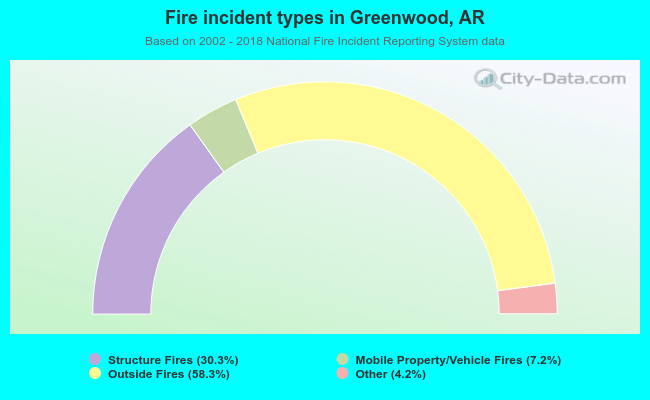 When looking into fire subcategories, the most reports belonged to: Outside Fires (58.3%), and Structure Fires (30.3%).