Bridgeton: Fire Incidents, New Jersey (NJ)
Where are fire incidents reported in Bridgeton, NJ
Something went wrong! Please refresh the page.
| Fire incidents reported | |
|---|---|
| Sreet name | Count |
| COMMERCE ST | 600 |
| PEARL ST | 280 |
| BROAD ST | 180 |
| SOUTH AVE | 164 |
| BANK ST | 160 |
| EAST AVE | 154 |
| LAUREL ST | 148 |
| BURLINGTON RD | 136 |
| ATLANTIC ST | 130 |
| COTTAGE AVE | 126 |
| IRVING AVE | 122 |
| WALNUT ST | 110 |
| PAMPHYLIA AVE | 94 |
| PINE ST | 78 |
| CHURCH ST | 68 |
| BUCKSHUTEM RD | 64 |
| GILES ST | 64 |
| FAYETTE ST | 62 |
| OAK ST | 58 |
| SHILOH PIKE | 54 |
| HAMPTON ST | 52 |
| COHANSEY ST | 50 |
| CEDAR ST | 48 |
| WALDEN DR | 48 |
| BRIDGETON MILLVILLE PIKE | 46 |
| VINE ST | 46 |
| LANDIS AVE | 44 |
| GROVE ST | 42 |
| CLARKS POND RD | 40 |
| MARION ST | 40 |
2002 - 2018 National Fire Incident Reporting System (NFIRS) incidents
- Incident types reported to NFIRS in Bridgeton, NJ
- 4,41635.8%Hazardous Condition
- 3,16825.7%Fire
- 2,43019.7%Rescue & EMS
- 1,30910.6%False Alarm
- 6415.2%Good Intent Call
- 3352.7%Service Call
- 170.1%Severe Weather
- Fire incident types reported to NFIRS in Bridgeton, NJ
- 1,82357.5%Structure Fires
- 82125.9%Outside Fires
- 33810.7%Mobile Property/Vehicle Fires
- 1865.9%Other
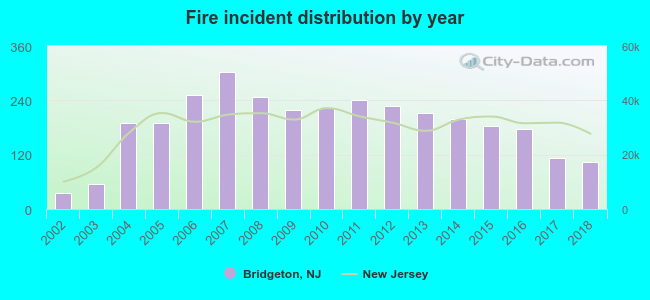 According to the data from the years 2002 - 2018 the average number of fires per year is 186. The highest number of reported fire incidents - 302 took place in 2007, and the least - 35 in 2002. The data has a growing trend.
The average number of yearly fire incidents per 10k residents in Bridgeton, NJ compared to nearest cities:
(Note: Based on data for the last 3 years, including only cities with population 5,000 and above)
| Bridgeton: | 51.6 |
| Millville: | 48.9 |
| Vineland: | 31.3 |
| Clayton: | 9.6 |
| Glassboro: | 55.6 |
| Pitman: | 48.3 |
| Williamstown: | 24.6 |
| Pennsville: | 28.3 |
| Carneys Point: | 32.5 |
 The median response time based on all reported fire incidents is 5 minutes. This is about the same as the state median value.
The median response time in Bridgeton, NJ compared to nearest cities:
(Note: Based on data for all years, including only cities with at least 500 fire incidents)
| Bridgeton: | 5 minutes |
| Millville: | 6 minutes |
| Vineland: | 6 minutes |
| Salem: | 7 minutes |
| Glassboro: | 5 minutes |
| Mullica Hill: | 9 minutes |
| Delaware City: | 8 minutes |
| Williamstown: | 8 minutes |
| Pennsville: | 7 minutes |
 According to the reports from the years 2002 - 2018 the average number of fire-related yearly deaths is 0. The highest number of reported deaths - 3 took place in 2018, and the lowest - 0 in 2002. The data has a growing trend.
The average number of fatalities per 1,000 fire incidents is 3. This indicator was the highest - 29 in 2018, and the lowest 0 in 2002. The trend for deaths per 1,000 fires is increasing. Compared to the New Jersey value the number of fatalities per 1,000 fire incidents is higher.
According to the reports from the years 2002 - 2018 the average number of fire-related yearly deaths is 0. The highest number of reported deaths - 3 took place in 2018, and the lowest - 0 in 2002. The data has a growing trend.
The average number of fatalities per 1,000 fire incidents is 3. This indicator was the highest - 29 in 2018, and the lowest 0 in 2002. The trend for deaths per 1,000 fires is increasing. Compared to the New Jersey value the number of fatalities per 1,000 fire incidents is higher.Deaths per 1,000 incidents in Bridgeton, NJ compared to nearest cities:
(Note: Based on data for all years, including only cities with at least 2,500 fire incidents)
| Bridgeton: | 2.5 |
| Vineland: | 1.3 |
| New Castle: | 1.7 |
| Dover: | 0.9 |
| Middletown: | 1.1 |
| Bear: | 0.4 |
| Wilmington: | 0.6 |
 According to the reports from the years 2002 - 2018 the average number of fire-related yearly casualties is 3. The highest number of injuries - 7 took place in 2011, and the lowest - 0 in 2012. The data has an increasing trend.
The average number of casualties per 1,000 fires is 16. This indicator was the highest - 49 in 2018, and the lowest 0 in 2012. The trend for casualties per 1,000 fire incidents is increasing. Compared to the New Jersey value the number of injuries per 1,000 fire incidents is higher.
According to the reports from the years 2002 - 2018 the average number of fire-related yearly casualties is 3. The highest number of injuries - 7 took place in 2011, and the lowest - 0 in 2012. The data has an increasing trend.
The average number of casualties per 1,000 fires is 16. This indicator was the highest - 49 in 2018, and the lowest 0 in 2012. The trend for casualties per 1,000 fire incidents is increasing. Compared to the New Jersey value the number of injuries per 1,000 fire incidents is higher.Casualties per 1,000 incidents in Bridgeton, NJ compared to nearest cities:
(Note: Based on data for all years, including only cities with at least 500 fire incidents)
| Bridgeton: | 14.8 |
| Millville: | 10.9 |
| Vineland: | 21.5 |
| Salem: | 6.0 |
| Glassboro: | 0.8 |
| Mullica Hill: | 1.8 |
| Delaware City: | 6.2 |
| Williamstown: | 18.2 |
| Pennsville: | 0.0 |
 34.0% incidents where reported in the morning and 66.0% in the evening. The most fires (17.0%) took place on Saturday, and the least (12.8%) on Thursday.
 Based on the 3,168 fire incidents from years 2002 - 2018 most fires (10.2%) took place during March, and the least (6.5%) in June.
 Out of all 12,331 cases reported during the years 2002 - 2018, the most belonged to the categories: Hazardous Condition (35.8%), Fire (25.7%), and Rescue & EMS (19.7%).
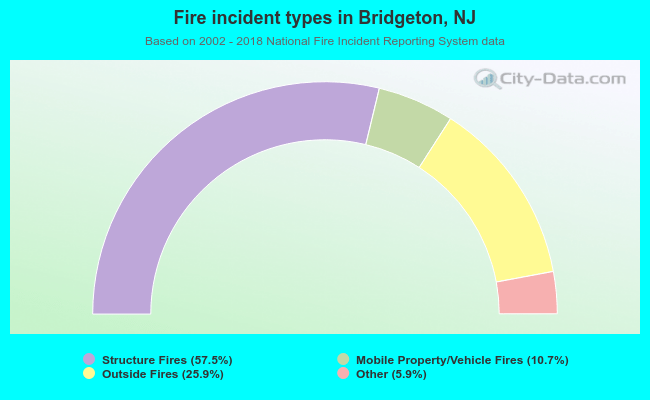 When looking into fire subcategories, the most incidents belonged to: Structure Fires (57.5%), and Outside Fires (25.9%).