Bremerton: Fire Incidents, Washington (WA)
Where are fire incidents reported in Bremerton, WA
Something went wrong! Please refresh the page.
| Fire incidents reported | |
|---|---|
| Sreet name | Count |
| WHEATON WAY | 250 |
| KITSAP WAY | 194 |
| STATE HWY 303 | 136 |
| MCWILLIAMS RD | 124 |
| PERRY AVE | 106 |
| ROCKY POINT RD | 104 |
| SHERIDAN RD | 104 |
| LEBO BLVD | 84 |
| PINE RD | 84 |
| BURWELL ST | 76 |
| ILLAHEE RD | 70 |
| CALLOW AVE | 68 |
| CHICO WAY | 68 |
| HOLLY RD | 64 |
| NORTHLAKE WAY | 64 |
| SYLVAN WAY | 62 |
| RIDDELL RD | 60 |
| 6TH ST | 58 |
| SPRUCE AVE | 58 |
| ERLANDS POINT RD | 56 |
| FAIRGROUNDS RD | 56 |
| 11TH ST | 54 |
| 5TH ST | 54 |
| NATIONAL AVE | 54 |
| OLD MILITARY RD | 54 |
| PARK AVE | 54 |
| ALMIRA DR | 52 |
| WYCOFF AVE | 52 |
| CENTRAL VALLEY RD | 50 |
| LAFAYETTE AVE | 50 |
| Other | 1,870 |
2002 - 2018 National Fire Incident Reporting System (NFIRS) incidents
- Incident types reported to NFIRS in Bremerton, WA
- 38,53360.2%Rescue & EMS
- 8,00112.5%Service Call
- 6,1129.6%Good Intent Call
- 4,2906.7%Fire
- 3,9906.2%Hazardous Condition
- 2,4833.9%False Alarm
- 4470.7%Special Incident
- 840.1%Overpressure Rupture
- Fire incident types reported to NFIRS in Bremerton, WA
- 2,06148.0%Structure Fires
- 1,50735.1%Outside Fires
- 61914.4%Mobile Property/Vehicle Fires
- 1032.4%Other
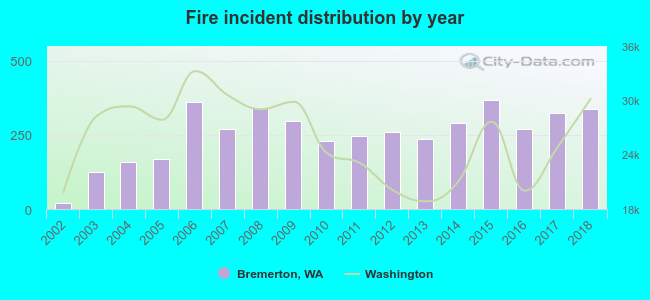 Based on the data from the years 2002 - 2018 the average number of fires per year is 252. The highest number of reported fires - 366 took place in 2015, and the least - 21 in 2002. The data has a growing trend.
The average number of yearly fire incidents per 10k residents in Bremerton, WA compared to nearest cities:
(Note: Based on data for the last 3 years, including only cities with population 5,000 and above)
| Bremerton: | 80.3 |
| Port Orchard: | 133.7 |
| Manchester: | 1.8 |
| Silverdale: | 41.8 |
| Bainbridge Island: | 19.9 |
| Poulsbo: | 74.6 |
| Vashon: | 33.6 |
| Belfair: | 138.8 |
| Seattle: | 33.2 |
 The median response time based on all reported fire incidents is 6 minutes. This is comparable to the Washington median value.
The median response time in Bremerton, WA compared to nearest cities:
(Note: Based on data for all years, including only cities with at least 500 fire incidents)
| Bremerton: | 6 minutes |
| Port Orchard: | 8 minutes |
| Silverdale: | 7 minutes |
| Bainbridge Island: | 7 minutes |
| Poulsbo: | 8 minutes |
| Vashon: | 8 minutes |
| Belfair: | 9 minutes |
| Seattle: | 5 minutes |
| Burien: | 5 minutes |
 Based on the data from the years 2002 - 2018 the average number of fire-related fatalities per year is 1. The highest number of reported deaths - 3 took place in 2007, and the lowest - 0 in 2002. The data has an increasing trend.
The average number of fatalities per 1,000 fires is 3. This indicator was the highest - 11 in 2007, and the lowest 0 in 2002. The trend for fatalities per 1,000 fire incidents is growing. Compared to the Washington value the number of fatalities per 1,000 fire incidents is much higher.
Based on the data from the years 2002 - 2018 the average number of fire-related fatalities per year is 1. The highest number of reported deaths - 3 took place in 2007, and the lowest - 0 in 2002. The data has an increasing trend.
The average number of fatalities per 1,000 fires is 3. This indicator was the highest - 11 in 2007, and the lowest 0 in 2002. The trend for fatalities per 1,000 fire incidents is growing. Compared to the Washington value the number of fatalities per 1,000 fire incidents is much higher.
 According to the reports from the years 2002 - 2018 the average number of fire-related yearly casualties is 5. The highest number of reported injuries - 10 took place in 2006, and the lowest - 0 in 2002. The data has an increasing trend.
The average number of casualties per 1,000 fire incidents is 17. This indicator was the highest - 31 in 2010, and the lowest 0 in 2002. The trend for casualties per 1,000 incidents is increasing. Compared to the state value the number of injuries per 1,000 incidents is much higher.
According to the reports from the years 2002 - 2018 the average number of fire-related yearly casualties is 5. The highest number of reported injuries - 10 took place in 2006, and the lowest - 0 in 2002. The data has an increasing trend.
The average number of casualties per 1,000 fire incidents is 17. This indicator was the highest - 31 in 2010, and the lowest 0 in 2002. The trend for casualties per 1,000 incidents is increasing. Compared to the state value the number of injuries per 1,000 incidents is much higher.Casualties per 1,000 incidents in Bremerton, WA compared to nearest cities:
(Note: Based on data for all years, including only cities with at least 500 fire incidents)
| Bremerton: | 18.6 |
| Port Orchard: | 28.1 |
| Silverdale: | 14.6 |
| Bainbridge Island: | 17.7 |
| Poulsbo: | 6.0 |
| Vashon: | 3.2 |
| Belfair: | 5.1 |
| Seattle: | 9.1 |
| Burien: | 14.7 |
 32.8% incidents where reported in the morning and 67.2% in the evening. The most fires (15.2%) took place on Saturday, and the least (12.8%) on Tuesday.
 According to the 4,290 fire incident reports from years 2002 - 2018 most fires (18.6%) took place during July, and the least (5.2%) in February.
 Out of all 63,999 cases reported during the years 2002 - 2018, the most belonged to the categories: Rescue & EMS (60.2%), Service Call (12.5%), and Good Intent Call (9.6%).
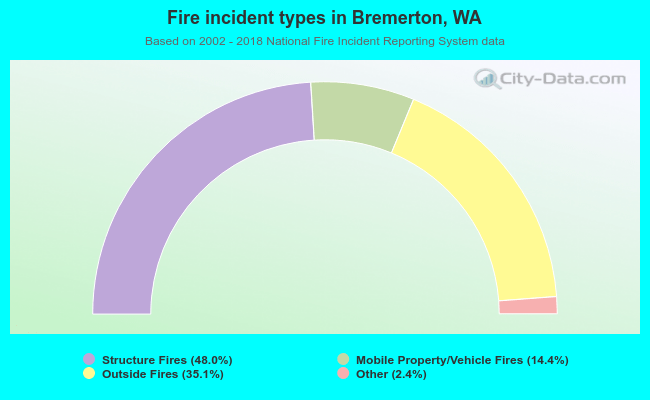 When looking into fire subcategories, the most reports belonged to: Structure Fires (48.0%), and Outside Fires (35.1%).