Boonton: Fire Incidents, New Jersey (NJ)
Where are fire incidents reported in Boonton, NJ
Something went wrong! Please refresh the page.
|
| |||||||||||||||||||||||||||||||||||||||||||||||||||||||||||||||||||||||||||||||||||||||||||||||||||||||||||||
2002 - 2018 National Fire Incident Reporting System (NFIRS) incidents
- Incident types reported to NFIRS in Boonton, NJ
- 33032.2%False Alarm
- 28127.4%Hazardous Condition
- 18618.1%Fire
- 12011.7%Service Call
- 656.3%Good Intent Call
- 232.2%Rescue & EMS
- 151.5%Special Incident
- 40.4%Severe Weather
- Fire incident types reported to NFIRS in Boonton, NJ
- 11461.3%Structure Fires
- 3016.1%Mobile Property/Vehicle Fires
- 3016.1%Outside Fires
- 126.5%Other
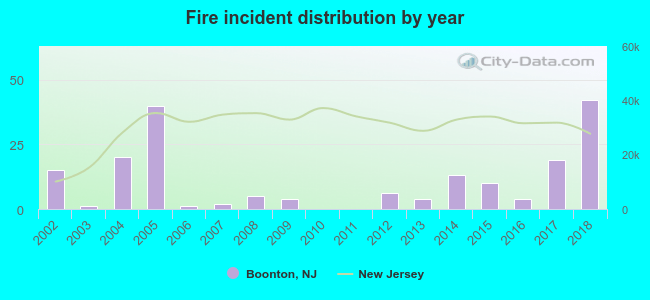 According to the data from the years 2002 - 2018 the average number of fire incidents per year is 11. The highest number of fires - 42 took place in 2018, and the least - 0 in 2010. The data has a growing trend.
The average number of yearly fire incidents per 10k residents in Boonton, NJ compared to nearest cities:
(Note: Based on data for the last 3 years, including only cities with population 5,000 and above)
| Boonton: | 25.8 |
| Rockaway: | 57.6 |
| Lincoln Park: | 7.6 |
| Kinnelon: | 32.8 |
| Morris Plains: | 79.7 |
| Fairfield: | 65.1 |
| Butler: | 16.5 |
| West Caldwell: | 32.1 |
| Dover: | 64.8 |

 33.3% incidents where reported in the morning and 66.7% in the evening. The most fires (16.1%) took place on Thursday, and the least (12.4%) on Monday.
 Based on the 186 fires from years 2002 - 2018 most fires (12.9%) took place during August, and the least (2.7%) in June.
 Out of all 1,025 cases reported during the years 2002 - 2018, the most belonged to the categories: False Alarm (32.2%), Hazardous Condition (27.4%), and Fire (18.1%).
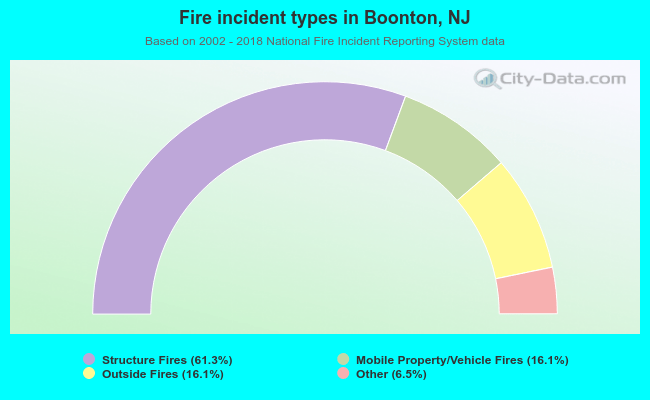 When looking into fire subcategories, the most incidents belonged to: Structure Fires (61.3%), and Mobile Property/Vehicle Fires (16.1%).