Bayonne: Fire Incidents, New Jersey (NJ)
Where are fire incidents reported in Bayonne, NJ
Something went wrong! Please refresh the page.
| Fire incidents reported | |
|---|---|
| Sreet name | Count |
| BWAY | 204 |
| AVE C | 196 |
| AVE A | 172 |
| BLVD | 162 |
| AVE E | 120 |
| 2ND STREET | 62 |
| 21ST STREET | 60 |
| 29TH STREET | 54 |
| LORD AVE | 42 |
| 22ND STREET | 36 |
| LEXINGTON AVE | 34 |
| 33RD STREET | 32 |
| 50TH STREET | 30 |
| AVE B | 30 |
| CONSTITUTION AVE | 28 |
| 19TH STREET | 26 |
| 25TH STREET | 26 |
| 3RD STREET | 26 |
| 49TH STREET | 26 |
| ISLAND VIEW COURT | 26 |
| LEFANTE LANE | 26 |
| SEAVIEW COURT | 26 |
| 18TH STREET | 24 |
| 28TH STREET | 24 |
| 31ST STREET | 24 |
| 8TH STREETAVE C | 24 |
| PROSPECT AVE | 24 |
| HOOK ROAD | 22 |
| MOTBY | 22 |
| 23RD STREET | 20 |
2005 - 2018 National Fire Incident Reporting System (NFIRS) incidents
- Incident types reported to NFIRS in Bayonne, NJ
- 11,03146.5%Hazardous Condition
- 3,58915.1%Rescue & EMS
- 3,07112.9%False Alarm
- 2,55210.8%Service Call
- 1,5806.7%Fire
- 1,4045.9%Good Intent Call
- 2801.2%Special Incident
- 1930.8%Overpressure Rupture
- 300.1%Severe Weather
- Fire incident types reported to NFIRS in Bayonne, NJ
- 1,14672.5%Structure Fires
- 24715.6%Outside Fires
- 18311.6%Mobile Property/Vehicle Fires
- 40.3%Other
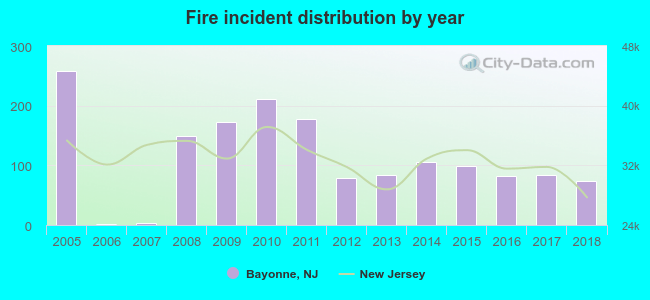 According to the data from the years 2005 - 2018 the average number of fires per year is 113. The highest number of reported fires - 258 took place in 2005, and the least - 2 in 2006. The data has a declining trend.
The average number of yearly fire incidents per 10k residents in Bayonne, NJ compared to nearest cities:
(Note: Based on data for the last 3 years, including only cities with population 5,000 and above)
| Bayonne: | 12.1 |
| Jersey City: | 54.2 |
| Elizabeth: | 38.7 |
| Harrison: | 30.8 |
| Newark: | 41.2 |
| Hillside: | 34.1 |
| Kearny: | 23.8 |
| Hoboken: | 42.3 |
| Irvington: | 26.2 |
 The median response time based on all reported fire incidents is 4 minutes. This is lower compared to the New Jersey median value.
The median response time in Bayonne, NJ compared to nearest cities:
(Note: Based on data for all years, including only cities with at least 500 fire incidents)
| Bayonne: | 4 minutes |
| Jersey City: | 4 minutes |
| Elizabeth: | 3 minutes |
| Harrison: | 2 minutes |
| Newark: | 3 minutes |
| Hillside: | 3 minutes |
| Kearny: | 4 minutes |
| Hoboken: | 3 minutes |
| Irvington: | 3 minutes |
 Based on the reports from the years 2005 - 2018 the average number of fire-related yearly casualties is 1. The highest number of injuries - 2 took place in 2005, and the lowest - 0 in 2006. The data has a decreasing trend.
The average number of casualties per 1,000 fire incidents is 5. This indicator was the highest - 20 in 2015, and the lowest 0 in 2006. The trend for casualties per 1,000 incidents is decreasing. Compared to the New Jersey value the number of casualties per 1,000 fire incidents is lower.
Based on the reports from the years 2005 - 2018 the average number of fire-related yearly casualties is 1. The highest number of injuries - 2 took place in 2005, and the lowest - 0 in 2006. The data has a decreasing trend.
The average number of casualties per 1,000 fire incidents is 5. This indicator was the highest - 20 in 2015, and the lowest 0 in 2006. The trend for casualties per 1,000 incidents is decreasing. Compared to the New Jersey value the number of casualties per 1,000 fire incidents is lower.
 27.6% incidents where reported in the morning and 72.4% in the evening. The most fires (15.6%) took place on Wednesday, and the least (12.3%) on Friday.
 According to the 1,580 fire incident reports from years 2005 - 2018 most fires (10.4%) took place during May, and the least (5.2%) in December.
 Out of all 23,730 cases reported during the years 2005 - 2018, the most belonged to the categories: Hazardous Condition (46.5%), Rescue & EMS (15.1%), and False Alarm (12.9%).
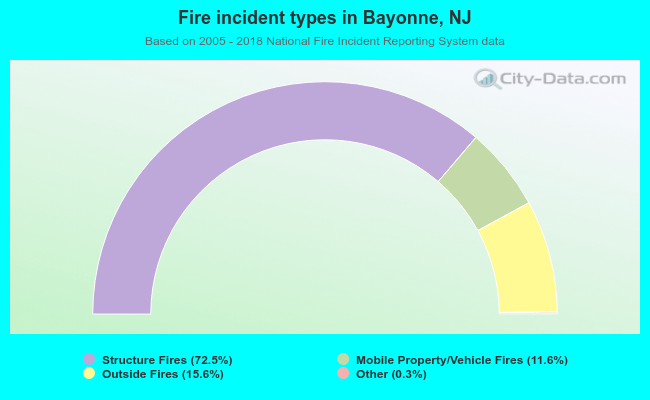 When looking into fire subcategories, the most incidents belonged to: Structure Fires (72.5%), and Outside Fires (15.6%).