Bay Point: Fire Incidents, California (CA)
Where are fire incidents reported in Bay Point, CA
Something went wrong! Please refresh the page.
| Fire incidents reported | |
|---|---|
| Sreet name | Count |
| PORT CHICAGO HWY | 142 |
| WILLOW PASS | 108 |
| BAILEY RD | 70 |
| PACIFICA AVE | 52 |
| CANAL RD | 48 |
| SOLANO AVE | 48 |
| BROADWAY | 42 |
| BELLA VISTA AVE | 40 |
| SR 4 | 40 |
| PORT CHICAGO HW | 38 |
| PULLMAN AVE | 34 |
| CRIVELLO AVE | 32 |
| DRIFTWOOD DR | 32 |
| MOUNTAIN VIEW AVE | 30 |
| WATER ST | 30 |
| MADISON AVE | 28 |
| BAYVIEW AVE | 24 |
| BELLA MONTE AVE | 24 |
| CLEARLAND DR | 24 |
| FW 4 EB | 24 |
| MARY ANN LN | 24 |
| POINSETTIA AVE | 24 |
| FAIRVIEW AVE | 22 |
| ANCHOR DR | 20 |
| HIGHWAY AVE | 20 |
| MCAVOY RD | 20 |
| SUISUN AVE | 20 |
| ALVES LN | 18 |
| MARINA RD | 18 |
| SHORE RD | 18 |
2005 - 2018 National Fire Incident Reporting System (NFIRS) incidents
- Incident types reported to NFIRS in Bay Point, CA
- 2,16351.9%Rescue & EMS
- 97123.3%Fire
- 55713.4%Good Intent Call
- 2536.1%Hazardous Condition
- 1303.1%Service Call
- 922.2%False Alarm
- Fire incident types reported to NFIRS in Bay Point, CA
- 47749.1%Outside Fires
- 23724.4%Structure Fires
- 21422.0%Mobile Property/Vehicle Fires
- 434.4%Other
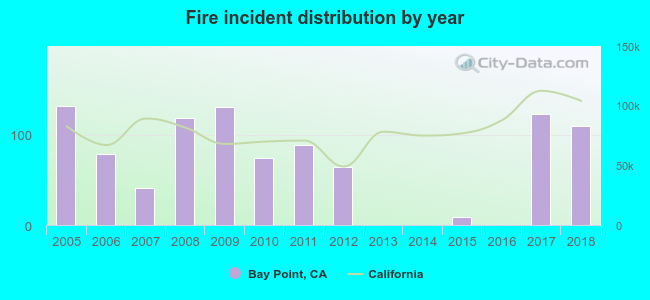 According to the data from the years 2005 - 2018 the average number of fire incidents per year is 69. The highest number of fire incidents - 132 took place in 2005, and the least - 0 in 2013. The data has a declining trend.
The average number of yearly fire incidents per 10k residents in Bay Point, CA compared to nearest cities:
(Note: Based on data for the last 3 years, including only cities with population 5,000 and above)
| Bay Point: | 54.3 |
| Pittsburg: | 31.1 |
| Concord: | 16.0 |
| Clayton: | 19.4 |
| Pleasant Hill: | 25.1 |
| Antioch: | 36.2 |
| Martinez: | 21.8 |
| Walnut Creek: | 13.3 |
| Benicia: | 27.3 |
 The median response time based on all reported fire incidents is 7 minutes. This is about the same as the California median value.
The median response time in Bay Point, CA compared to nearest cities:
(Note: Based on data for all years, including only cities with at least 500 fire incidents)
| Bay Point: | 7 minutes |
| Pittsburg: | 6 minutes |
| Concord: | 6 minutes |
| Pleasant Hill: | 6 minutes |
| Antioch: | 6 minutes |
| Martinez: | 7 minutes |
| Walnut Creek: | 6 minutes |
| Benicia: | 6 minutes |
| Lafayette: | 7 minutes |
 According to the reports from the years 2005 - 2018 the average number of fire-related casualties per year is 0. The highest number of casualties - 2 took place in 2018, and the lowest - 0 in 2005. The data has an increasing trend.
The average number of injuries per 1,000 fires is 3. This indicator was the highest - 18 in 2018, and the lowest 0 in 2005. The trend for casualties per 1,000 incidents is growing. Compared to the California value the number of injuries per 1,000 fire incidents is lower.
According to the reports from the years 2005 - 2018 the average number of fire-related casualties per year is 0. The highest number of casualties - 2 took place in 2018, and the lowest - 0 in 2005. The data has an increasing trend.
The average number of injuries per 1,000 fires is 3. This indicator was the highest - 18 in 2018, and the lowest 0 in 2005. The trend for casualties per 1,000 incidents is growing. Compared to the California value the number of injuries per 1,000 fire incidents is lower.Casualties per 1,000 incidents in Bay Point, CA compared to nearest cities:
(Note: Based on data for all years, including only cities with at least 500 fire incidents)
| Bay Point: | 4.1 |
| Pittsburg: | 0.9 |
| Concord: | 1.5 |
| Pleasant Hill: | 2.9 |
| Antioch: | 1.0 |
| Martinez: | 0.8 |
| Walnut Creek: | 1.7 |
| Benicia: | 6.6 |
| Lafayette: | 1.9 |
 35.3% incidents where reported in the morning and 64.7% in the evening. The most fires (16.4%) took place on Sunday, and the least (12.5%) on Friday.
 According to the 971 fires from years 2005 - 2018 most fires (15.3%) took place during July, and the least (5.8%) in December.
 Out of all 4,168 cases reported during the years 2005 - 2018, the most belonged to the categories: Rescue & EMS (51.9%), Fire (23.3%), and Good Intent Call (13.4%).
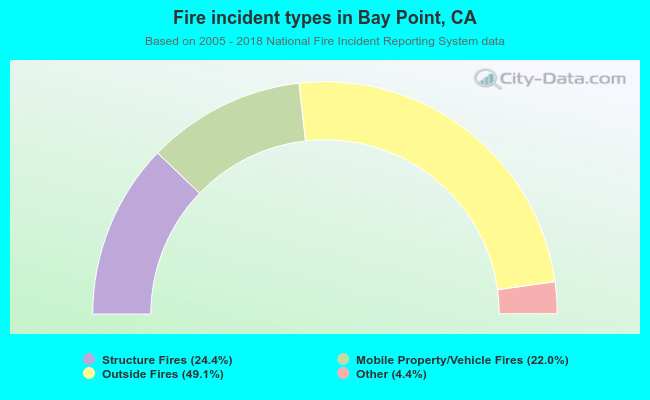 When looking into fire subcategories, the most reports belonged to: Outside Fires (49.1%), and Structure Fires (24.4%).