Antioch: Fire Incidents, California (CA)
Where are fire incidents reported in Antioch, CA
Something went wrong! Please refresh the page.
| Fire incidents reported | |
|---|---|
| Sreet name | Count |
| LONE TREE WAY | 386 |
| 18TH ST | 236 |
| SR 4 | 216 |
| SYCAMORE DR | 178 |
| DELTA FAIR BLVD | 164 |
| SOMERSVILLE RD | 164 |
| BUCHANAN RD | 158 |
| WILBUR AVE | 144 |
| HILLCREST AVE | 142 |
| DEER VALLEY RD | 100 |
| A ST | 94 |
| G ST | 92 |
| L ST | 70 |
| D ST | 68 |
| JAMES DONLON BLVD | 68 |
| 10TH ST | 64 |
| CAVALLO RD | 64 |
| EMPIRE MINE RD | 64 |
| 6TH ST | 60 |
| GENTRYTOWN DR | 58 |
| SAN JOSE DR | 56 |
| SUNSET DR | 54 |
| 7TH ST | 48 |
| CLAUDIA CT | 48 |
| COUNTRY HILLS DR | 48 |
| MARINA PLZ | 46 |
| PUTNAM ST | 46 |
| TREGALLAS RD | 46 |
| 16TH ST | 44 |
| 9TH ST | 44 |
| Other | 849 |
2005 - 2018 National Fire Incident Reporting System (NFIRS) incidents
- Incident types reported to NFIRS in Antioch, CA
- 12,59652.8%Rescue & EMS
- 4,40918.5%Good Intent Call
- 3,91916.4%Fire
- 1,2235.1%Hazardous Condition
- 9273.9%Service Call
- 7393.1%False Alarm
- Fire incident types reported to NFIRS in Antioch, CA
- 1,93449.3%Outside Fires
- 1,14729.3%Structure Fires
- 60615.5%Mobile Property/Vehicle Fires
- 2325.9%Other
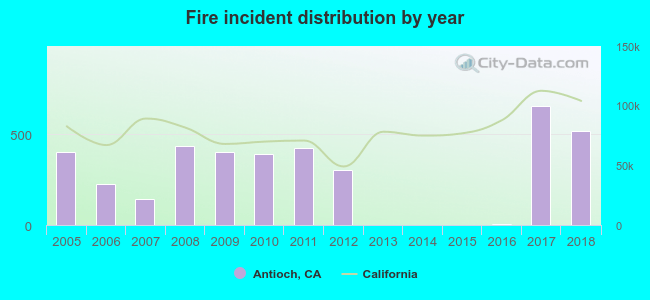 According to the data from the years 2005 - 2018 the average number of fires per year is 280. The highest number of reported fire incidents - 658 took place in 2017, and the least - 1 in 2013. The data has a rising trend.
The average number of yearly fire incidents per 10k residents in Antioch, CA compared to nearest cities:
(Note: Based on data for the last 3 years, including only cities with population 5,000 and above)
| Antioch: | 36.2 |
| Oakley: | 18.4 |
| Pittsburg: | 31.1 |
| Brentwood: | 22.6 |
| Clayton: | 19.4 |
| Bay Point: | 54.3 |
| Tassajara: | 1.3 |
| Concord: | 16.0 |
| Discovery Bay: | 23.6 |
 The median response time based on all reported fire incidents is 6 minutes. This is close to the California median value.
The median response time in Antioch, CA compared to nearest cities:
(Note: Based on data for all years, including only cities with at least 500 fire incidents)
| Antioch: | 6 minutes |
| Oakley: | 7 minutes |
| Pittsburg: | 6 minutes |
| Brentwood: | 7 minutes |
| Bay Point: | 7 minutes |
| Concord: | 6 minutes |
| Rio Vista: | 7 minutes |
| Walnut Creek: | 6 minutes |
| Pleasant Hill: | 6 minutes |
 33.2% incidents where reported in the morning and 66.8% in the evening. The most fires (15.6%) took place on Wednesday, and the least (13.0%) on Thursday.
 Based on the 3,919 fire incidents from years 2005 - 2018 most fires (14.7%) took place during July, and the least (5.0%) in February.
 Out of all 23,839 cases reported during the years 2005 - 2018, the most belonged to the categories: Rescue & EMS (52.8%), Good Intent Call (18.5%), and Fire (16.4%).
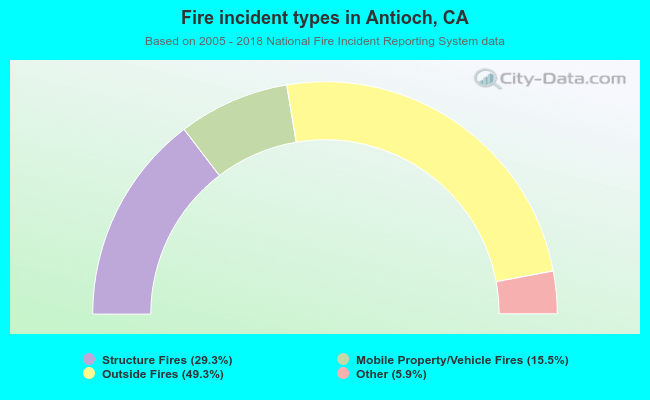 When looking into fire subcategories, the most reports belonged to: Outside Fires (49.3%), and Structure Fires (29.3%).