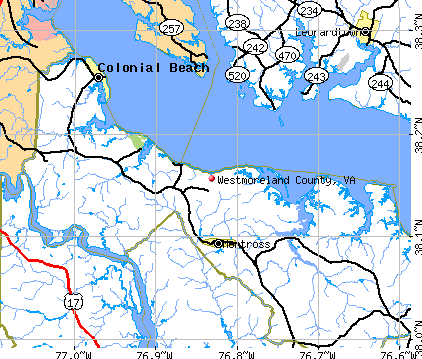
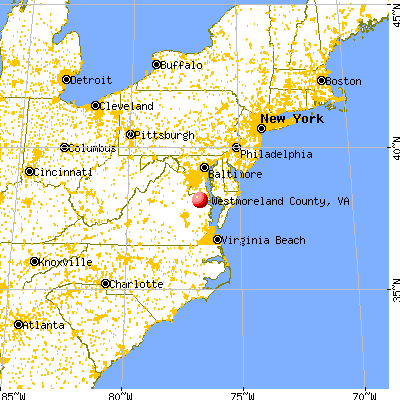
Westmoreland County, Virginia (VA)
County owner-occupied free and clear houses and condos in 2010: 2,170
County owner-occupied houses and condos in 2000: 5,425
Renter-occupied apartments: 1,719 (it was 1,421 in 2000)
| % of renters here: | 21% |
| State: | 33% |
Land area: 229 sq. mi.
Water area: 23.5 sq. mi.
Population density: 81 people per square mile (average).
Industries providing employment: Educational, health and social services (15.3%), Professional, scientific, management, administrative, and waste management services (13.9%), Public administration (13.3%), Retail trade (13.0%), Construction (10.0%).
Type of workers:
- Private wage or salary: 64%
- Government: 25%
- Self-employed, not incorporated: 11%
- Unpaid family work: 1%
- OSM Map
- General Map
- Google Map
- MSN Map

- 11,37561.2%White Non-Hispanic Alone
- 4,43923.9%Black Non-Hispanic Alone
- 1,3187.1%Hispanic or Latino
- 1,0185.5%Two or more races
- 2091.1%Asian alone
- 1881.0%Some other race alone
- 270.1%American Indian and Alaska Native alone

| Median resident age: | 48.3 years |
| Virginia median age: | 39.0 years |
| Males: 8,979 | |
| Females: 9,627 |

 | Chesapeake Bay Beaches - Mainland (44 replies) |
| Northern Neck Questions (7 replies) |
| VA Pics (256 replies) |
| Colonial Beach in 2012 (1 reply) |
| Berry farms (8 replies) |
| Moving to VA and best place to live (16 replies) |
| Westmoreland County: | 2.0 people |
| Virginia: | 3 people |
Estimated median household income in 2022: $55,753 ($35,797 in 1999)
| This county: | $55,753 |
| Virginia: | $85,873 |
Median contract rent in 2022 for apartments: $716 (lower quartile is $459, upper quartile is $1,025)
| This county: | $716 |
| State: | $1270 |
Estimated median house or condo value in 2022: $262,598 (it was $91,800 in 2000)
| Westmoreland: | $262,598 |
| Virginia: | $365,700 |
Mean price in 2022:
Median monthly housing costs for homes and condos with a mortgage: $1,402Detached houses: $342,600
Here: $342,600 State: $472,865 Townhouses or other attached units: $500,369
Here: $500,369 State: $457,437 In 5-or-more-unit structures: $524,184
Here: $524,184 State: $382,551 Mobile homes: $146,360
Here: $146,360 State: $100,736
Median monthly housing costs for units without a mortgage: $465
Institutionalized population: 58
Crime in 2021 (reported by the sheriff's office or county police, not the county total):
- Murders: 0
- Rapes: 6
- Robberies: 1
- Assaults: 12
- Burglaries: 10
- Thefts: 54
- Auto thefts: 10
Crime in 2020 (reported by the sheriff's office or county police, not the county total):
- Murders: 2
- Rapes: 5
- Robberies: 1
- Assaults: 12
- Burglaries: 19
- Thefts: 66
- Auto thefts: 4
Single-family new house construction building permits:
- 2022: 215 buildings, average cost: $196,800
- 2021: 192 buildings, average cost: $208,000
- 2020: 116 buildings, average cost: $173,300
- 2019: 99 buildings, average cost: $197,000
- 2018: 95 buildings, average cost: $185,800
- 2017: 76 buildings, average cost: $121,800
- 2016: 72 buildings, average cost: $144,100
- 2015: 72 buildings, average cost: $180,700
- 2014: 64 buildings, average cost: $127,700
- 2013: 63 buildings, average cost: $155,200
- 2012: 65 buildings, average cost: $138,100
- 2011: 72 buildings, average cost: $170,900
- 2010: 52 buildings, average cost: $180,900
- 2009: 83 buildings, average cost: $189,100
- 2008: 135 buildings, average cost: $158,000
- 2007: 281 buildings, average cost: $198,200
- 2006: 268 buildings, average cost: $186,500
- 2005: 152 buildings, average cost: $150,000
- 2004: 358 buildings, average cost: $123,200
- 2003: 131 buildings, average cost: $116,300
- 2002: 158 buildings, average cost: $59,400
- 2001: 137 buildings, average cost: $57,400
- 2000: 58 buildings, average cost: $110,200
- 1999: 61 buildings, average cost: $104,900
- 1998: 66 buildings, average cost: $98,400
- 1997: 57 buildings, average cost: $104,200


Median real estate property taxes paid for housing units with mortgages in 2022: $1,651 (0.6%)
Median real estate property taxes paid for housing units with no mortgage in 2022: $1,718 (0.6%)


| Westmoreland County: | 17.0% |
| Virginia: | 10.6% |
Median age of residents in 2022: 48.3 years old
(Males: 48.7 years old, Females: 48.4 years old)
(Median age for: White residents: 54.6 years old, Black residents: 46.3 years old, Asian residents: 31.5 years old, Hispanic or Latino residents: 32.6 years old, Other race residents: 41.7 years old)
Fair market rent in 2006 for a 1-bedroom apartment in Westmoreland County is $478 a month.
Fair market rent for a 2-bedroom apartment is $603 a month.
Fair market rent for a 3-bedroom apartment is $827 a month.
Cities in this county include: Potomac Mills, Colonial Beach, Montross.
Notable locations in this county outside city limits:
Notable locations in Westmoreland County: Ben Coolyn (A), Ash Lawn (B), Foxfield (C), Beagle Gap Overlook (D), Burnleys Vineyard (E), Belvoir (F), Red Hill (G), Barrackside (H), Loft Mountain Campgrounds (I), Cismont Manor (J), Mechums River (K), Michie Tavern (L), Lost Valley Tree Farm and Nursery (M), Rio (N), Birdwood Golf Course (O), Jefferson Mill (P), Mint Springs Recreation Area (Q), Jarman Gap (R), Ivy Creek Shelter (S), Moormans River Overlook (T). Display/hide their locations on the map
Shopping Centers: Fashion Mall Shopping Center (1), Charlottesville Shoppers World Shopping Center (2), Albemarle Square Shopping Center (3), Rio Hill Shopping Center (4), Woodbrook Shopping Center (5). Display/hide their locations on the map
Churches in Westmoreland County include: Preddy Creek Church (A), Prize Hill Church (B), Alberene Church (C), Aldersgate Church (D), Babgy Memorial Church (E), Rising Sun Church (F), Bethany Church (G), Bethel Church (H), Rose Hill Church (I). Display/hide their locations on the map
Cemeteries: Bethel Cemetery (1), Tate Cemetery (2), Thomas Cemetery (3), Thompson Cemetery (4), Wild Rose Cemetery (5), Coles Cemetery (6), Estes Cemetery (7). Display/hide their locations on the map
Reservoirs: Lloyd Pond (A), Happy Creek Lake (B), Edgeworth Farms Lake (C), Camp Faith Lake (D), Edgehill Farm Pond Number Two (E), Delutz Pond (F), Stillfried Pond (G), Northfields Lake (H). Display/hide their locations on the map
Streams, rivers, and creeks: Schenks Branch (A), Moores Creek (B), Meadow Branch (C), Jones Run (D), Wolftrap Branch (E), Winston Creek (F), Wingfield Branch (G), Will Woods Branch (H), Whiteside Branch (I). Display/hide their locations on the map
Parks in Westmoreland County include: Beaver Creek Reservoir Park (1), Chris Greene Lake Park (2), Walnut Creek Park (3), Darden Towne Memorial Park (4), Ivy Creek Park (5), Scottsville Recreation Center (6), Totier Creek Reservoir Park (7). Display/hide their locations on the map
Neighboring counties: Botetourt County  , Jefferson County, Illinois
  , Hardin County, Kentucky , Richland County, Illinois , Phelps County, Missouri , Menifee County, Kentucky , Rowan County, Kentucky , Harrisonburg city .
| Here: | 3.5% |
| Virginia: | 2.7% |


Current college students: 428
People 25 years of age or older with a high school degree or higher: 81.9%
People 25 years of age or older with a bachelor's degree or higher: 17.6%
Number of foreign born residents: 827 (56.5% naturalized citizens)
| Westmoreland County: | 4.4% |
| Whole state: | 12.7% |

- Year of entry for the foreign-born population
- 712010 or later
- 282000 to 2009
- 3321990 to 1999
- 1661980 to 1989
- 421970 to 1979
- 136Before 1970
Mean travel time to work (commute): % minutes
Percentage of county residents living and working in this county: 89.7%
Housing units in structures:
- One, detached: 9,754
- One, attached: 207
- Two: 17
- 3 or 4: 135
- 5 to 9: 159
- 10 to 19: 23
- 20 to 49: 96
- 50 or more: 2
- Mobile homes: 917
- Boats, RVs, vans, etc.: 19
Housing units in Westmoreland County with a mortgage: 3,564 (206 second mortgage, 0 home equity loan, 146 both second mortgage and home equity loan)
Houses without a mortgage: 59
| Here: | 4.8% with mortgage |
| State: | 97.2% with mortgage |
Religion statistics for Westmoreland County
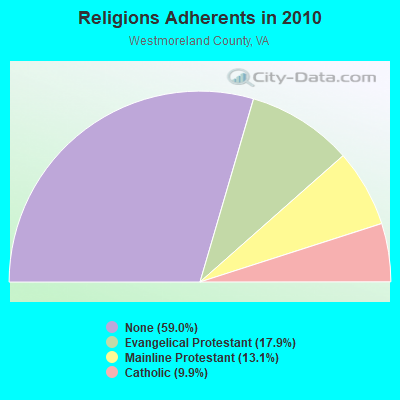
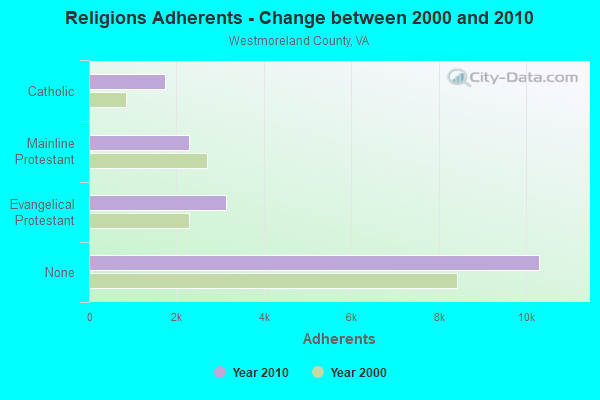
| Religion | Adherents | Congregations |
|---|---|---|
| Evangelical Protestant | 3,130 | 11 |
| Mainline Protestant | 2,291 | 15 |
| Catholic | 1,727 | 2 |
| Other | 6 | 2 |
| None | 10,300 | - |
Source: Clifford Grammich, Kirk Hadaway, Richard Houseal, Dale E.Jones, Alexei Krindatch, Richie Stanley and Richard H.Taylor. 2012. 2010 U.S.Religion Census: Religious Congregations & Membership Study. Association of Statisticians of American Religious Bodies. Jones, Dale E., et al. 2002. Congregations and Membership in the United States 2000. Nashville, TN: Glenmary Research Center.
Food Environment Statistics:
| Westmoreland County: | 3.48 / 10,000 pop. |
| State: | 2.03 / 10,000 pop. |
| This county: | 1.74 / 10,000 pop. |
| Virginia: | 1.43 / 10,000 pop. |
| Westmoreland County: | 3.48 / 10,000 pop. |
| Virginia: | 4.03 / 10,000 pop. |
| This county: | 10.45 / 10,000 pop. |
| State: | 7.65 / 10,000 pop. |
| Westmoreland County: | 12.3% |
| Virginia: | 9.3% |
| Westmoreland County: | 30.3% |
| State: | 26.7% |
| Here: | 15.4% |
| State: | 18.6% |
Agriculture in Westmoreland County:
Average size of farms: 410 acresAverage value of agricultural products sold per farm: $121,879
Average value of crops sold per acre for harvested cropland: $463.30
The value of livestock, poultry, and their products as a percentage of the total market value of agricultural products sold: 5.00%
Average total farm production expenses per farm: $105,976
Harvested cropland as a percentage of land in farms: 60.95%
Irrigated harvested cropland as a percentage of land in farms: 3.57%
Average market value of all machinery and equipment per farm: $86,939
The percentage of farms operated by a family or individual: 78.79%
Average age of principal farm operators: 57 years
Average number of cattle and calves per 100 acres of all land in farms: 4.71
Corn for grain: 14100 harvested acres
All wheat for grain: 9223 harvested acres
Soybeans for beans: 20720 harvested acres
Vegetables: 1,418 harvested acres
Land in orchards: 92 acres
Tornado activity:
Westmoreland County historical area-adjusted tornado activity is significantly below Virginia state average. It is 3127594.9 times below overall U.S. average.Tornadoes in this county have caused 11 fatalities and 6 injuries recorded between 1950 and 2004.
On 9/30/1959, a category 3 (max. wind speeds 158-206 mph) tornado killed 11 people and injured 4 people and caused between $50,000 and $500,000 in damages.
Earthquake activity:
Westmoreland County-area historical earthquake activity is significantly above Virginia state average. It is 58% smaller than the overall U.S. average.On 8/23/2011 at 17:51:04, a magnitude 5.8 (5.8 MW, Depth: 3.7 mi, Class: Moderate, Intensity: VI - VII) earthquake occurred 62.5 miles away from Westmoreland County center
On 8/25/2011 at 05:07:52, a magnitude 4.5 (4.5 ML, Depth: 4.2 mi, Class: Light, Intensity: IV - V) earthquake occurred 63.5 miles away from the county center
On 12/9/2003 at 20:59:14, a magnitude 4.5 (4.5 MB, 4.5 LG) earthquake occurred 70.5 miles away from the county center
On 12/9/2003 at 20:59:18, a magnitude 4.5 (4.5 ML, Depth: 6.2 mi) earthquake occurred 74.0 miles away from the county center
On 8/24/2011 at 00:04:36, a magnitude 4.2 (4.2 ML) earthquake occurred 63.4 miles away from Westmoreland County center
On 1/16/1994 at 01:49:16, a magnitude 4.6 (4.6 MB, 4.6 LG, Depth: 3.1 mi) earthquake occurred 156.3 miles away from the county center
Magnitude types: regional Lg-wave magnitude (LG), body-wave magnitude (MB), local magnitude (ML), moment magnitude (MW)
Most recent natural disasters:
- Virginia Covid-19 Pandemic, Incident Period: January 20, 2020, Major Disaster (Presidential) Declared DR-4512-VA: April 2, 2020, FEMA Id: 4512, Natural disaster type: Other
- Virginia Tropical Storm Michael, Incident Period: October 9, 2018 - October 16, 2018, FEMA Id: 4411, Natural disaster type: Tropical Storm
- Virginia Hurricane Sandy, Incident Period: October 26, 2012 to November 01, 2012, Emergency Declared EM-3359: October 29, 2012, FEMA Id: 3359, Natural disaster type: Hurricane
- Virginia Remnants of Tropical Storm Lee, Incident Period: September 08, 2011 to September 09, 2011, Major Disaster (Presidential) Declared DR-4045: November 17, 2011, FEMA Id: 4045, Natural disaster type: Tropical Storm
- Virginia Hurricane Irene, Incident Period: August 26, 2011 to September 04, 2011, Emergency Declared EM-3329: August 26, 2011, FEMA Id: 3329, Natural disaster type: Hurricane
- Virginia Hurricane Irene, Incident Period: August 26, 2011 to August 28, 2011, Major Disaster (Presidential) Declared DR-4024: September 03, 2011, FEMA Id: 4024, Natural disaster type: Hurricane
- Virginia Severe Storms and Flooding, Including Severe Storms and Flooding Associated with Tropical Depression Ernesto, Incident Period: August 29, 2006 to September 07, 2006, Major Disaster (Presidential) Declared DR-1661: September 22, 2006, FEMA Id: 1661, Natural disaster type: Storm, Flood, Tropical Depression
- Virginia Hurricane Katrina Evacuation, Incident Period: August 29, 2005 to October 01, 2005, Emergency Declared EM-3240: September 12, 2005, FEMA Id: 3240, Natural disaster type: Hurricane
- Virginia Hurricane Isabel, Incident Period: September 18, 2003 to October 01, 2003, Major Disaster (Presidential) Declared DR-1491: September 18, 2003, FEMA Id: 1491, Natural disaster type: Hurricane
- Virginia Winter Storm, Incident Period: January 25, 2000 to January 30, 2000, Major Disaster (Presidential) Declared DR-1318: February 28, 2000, FEMA Id: 1318, Natural disaster type: Winter Storm
- 9 other natural disasters have been reported since 1953.
The number of natural disasters in Westmoreland County (19) is greater than the US average (15).
Major Disasters (Presidential) Declared: 13
Emergencies Declared: 5
Causes of natural disasters: Hurricanes: 8, Floods: 4, Storms: 4, Tropical Storms: 3, Winter Storms: 2, Blizzard: 1, Ice Storm: 1, Tropical Depression: 1, Other: 1 (Note: some incidents may be assigned to more than one category).

Means of transportation to work:
- Drove a car alone: 2,597 (60.6%)
- Carpooled: 442 (10.3%)
- Bus: 26 (0.6%)
- Taxicab, motorcycle, or other means: 21 (0.5%)
- Bicycle: 46 (1.1%)
- Walked: 48 (1.1%)
- Worked at home: 1,224 (28.6%)


- Health care and social assistance (19%)
- Retail trade (17%)
- Public administration (16%)
- Professional, scientific, and technical services (9%)
- Educational services (8%)
- Agriculture, forestry, fishing and hunting (7%)
- Other services, except public administration (7%)

- Health care and social assistance (16%)
- Retail trade (14%)
- Public administration (13%)
- Professional, scientific, and technical services (8%)
- Educational services (7%)
- Agriculture, forestry, fishing and hunting (6%)
- Other services, except public administration (6%)

- Management occupations (18%)
- Construction and extraction occupations (16%)
- Transportation occupations (8%)
- Computer and mathematical occupations (8%)
- Sales and related occupations (7%)
- Installation, maintenance, and repair occupations (6%)
- Building and grounds cleaning and maintenance occupations (5%)

- Office and administrative support occupations (19%)
- Sales and related occupations (9%)
- Personal care and service occupations (7%)
- Management occupations (6%)
- Educational instruction, and library occupations (6%)
- Business and financial operations occupations (6%)
- Transportation occupations (5%)

- Mexico (42%)
- Bolivia (10%)
- Ethiopia (9%)
- El Salvador (9%)
- Vietnam (4%)
- England (4%)
- India (4%)

- American (13%)
- English (9%)
- Irish (7%)
- Italian (5%)
- German (4%)
- European (2%)
- Scottish (2%)


12 people in workers' group living quarters and job corps centers
People in group quarters in Westmoreland County, Virginia in 2000:
- 83 people in nursing homes
- 11 people in agriculture workers' dormitories on farms
- 6 people in other workers' dormitories
- 5 people in homes for the physically handicapped
9.79% of this county's 2021 resident taxpayers lived in other counties in 2020 ($73,591 average adjusted gross income)
| Here: | 9.79% |
| Virginia average: | 10.16% |
10 or fewer of this county's residents moved from foreign countries.
6.17% relocated from other counties in Virginia ($49,306 average AGI)
3.62% relocated from other states ($24,285 average AGI)
Westmoreland County: 3.62% Virginia average: 3.91%

Top counties from which taxpayers relocated into this county between 2020 and 2021:
| from King George County, VA | |
| from Spotsylvania County, VA | |
| from Fairfax County, VA | |
| from Charles County, MD | |
| from Stafford County, VA | |
| from Prince William County, VA | |
| from Fredericksburg city, VA |
8.39% of this county's 2020 resident taxpayers moved to other counties in 2021 ($53,517 average adjusted gross income)
| Here: | 8.39% |
| Virginia average: | 10.20% |
10 or fewer of this county's residents moved to foreign countries.
5.59% relocated to other counties in Virginia ($33,223 average AGI)
2.80% relocated to other states ($20,294 average AGI)
Westmoreland County: 2.80% Virginia average: 3.98%

Top counties to which taxpayers relocated from this county between 2020 and 2021:
| to King George County, VA | |
| to Richmond County, VA | |
| to Spotsylvania County, VA | |
| to Stafford County, VA | |
| to Fredericksburg city, VA | |
| to Fairfax County, VA | |
| to Essex County, VA |
Births per 1000 population from 1990 to 1999: 12.8
Births per 1000 population from 2000 to 2006: 10.9

Deaths per 1000 population from 1990 to 1999: 12.8
Deaths per 1000 population from 2000 to 2009: 12.5
Deaths per 1000 population from 2010 to 2020: 12.9

Infant deaths per 1000 live births from 1990 to 1999: 13.0
Infant deaths per 1000 live births from 2000 to 2006: 15.8

Persons under 19 years old without health insurance coverage in 2018: 6.1%


Persons enrolled in hospital insurance and/or supplemental medical insurance (Medicare) in July 1, 2007: 3,745 (3,252 aged, 493 disabled)
Children under 18 without health insurance coverage in 2007: 433 (11%)


Most common underlying causes of death in Westmoreland County, Virginia in 1999 - 2019:
- Bronchus or lung, unspecified - Malignant neoplasms (370)
- Atherosclerotic heart disease (225)
- Acute myocardial infarction, unspecified (144)
- Unspecified dementia (138)
- Chronic obstructive pulmonary disease, unspecified (85)
- Stroke, not specified as haemorrhage or infarction (44)
- Atherosclerotic cardiovascular disease, so described (11)
- Alzheimer disease, unspecified (10)
Population without health insurance coverage in 2000: 16%
Children under 18 without health insurance coverage in 2000: 15%
Medical specialist MDs per 100,000 population in 2005: 1,091
Dentists per 100,000 population in 1998: 12
Total births per 100,000 population, July 2005 - July 2006 : 12
Total deaths per 100,000 population, July 2005 - July 2006: 58
Limited-service eating places per 100,000 population in 2005 : 12
Crimes per 100,000 population in 1996: 1
Suicides per 1,000,000 population from 2000 to 2006: 178.7. This is more than state average.
Household type by relationship:
Households: 18,606- Male householders: 3,624 (1,267 living alone), Female householders: 4,428 (1,617 living alone)
3,132 spouses (3,086 opposite-sex spouses), 344 unmarried partners, (343 opposite-sex unmarried partners), 4,671 children (4,405 natural, 142 adopted, 118 stepchildren), 583 grandchildren, 422 brothers or sisters, 245 parents, 8 foster children, 385 other relatives, 609 non-relatives
- In group quarters: 135
Size of family households: 2,245 2-persons, 1,080 3-persons, 698 4-persons, 368 5-persons, 222 6-persons, 39 7-or-more-persons.
Size of nonfamily households: 2,884 1-person, 334 2-persons, 34 3-persons, 157 4-persons.
1,677 married couples with children.
1,091 single-parent households (263 men, 828 women).
93.1% of residents of Westmoreland speak English at home.
5.2% of residents speak Spanish at home (43% speak English very well, 34% speak English well, 20% speak English not well, 3% don't speak English at all).
1.2% of residents speak other Indo-European language at home (11% speak English very well, 52% speak English well, 27% speak English not well, 10% don't speak English at all).
0.7% of residents speak Asian or Pacific Island language at home (60% speak English very well, 28% speak English well, 12% speak English not well).
0.1% of residents speak other language at home (100% speak English very well).
In fiscal year 2004:
Federal Government expenditure: $129,843,000 ($7,620 per capita)
Department of Defense expenditure: $16,393,000
Federal direct payments to individuals for retirement and disability: $78,023,000
Federal other direct payments to individuals: $28,045,000
Federal direct payments not to individuals: $5,480,000
Federal grants: $11,646,000
Federal procurement contracts: $2,172,000 ($924,000 Department of Defense)
Federal salaries and wages: $4,476,000 ($0,000 Department of Defense)
Federal Government direct loans: $1,523,000
Federal guaranteed/insured loans: $10,110,000
Federal Government insurance: $60,523,000
Population change from April 1, 2000 to July 1, 2005:
Births: 975| Here: | 57 per 1000 residents |
| State: | 70 per 1000 residents |
Deaths: 1,147
| Here: | 67 per 1000 residents |
| State: | 40 per 1000 residents |
Net international migration: +77
| Here: | +4 per 1000 residents |
| State: | +18 per 1000 residents |
Net internal migration: +629
| Here: | +37 per 1000 residents |
| State: | +14 per 1000 residents |

Total withdrawal of fresh water for public supply: 0.91 millions of gallons per day (all from ground)
| Here: | 6.4 |
| State: | 7.0 |
| Here: | 4.9 |
| State: | 4.3 |

- Year house built in Westmoreland County, Virginia
- 292020 or later
- 1,1982010 to 2019
- 2,5362000 to 2009
- 1,1661990 to 1999
- 1,3161980 to 1989
- 1,4191970 to 1979
- 9741960 to 1969
- 1,0811950 to 1959
- 7081940 to 1949
- 9041939 or earlier

- Rooms in owner-occupied houses in Westmoreland County, Virginia
- 341 room
- 02 rooms
- 1413 rooms
- 4664 rooms
- 1,3225 rooms
- 1,2336 rooms
- 1,2617 rooms
- 9868 rooms
- 7399+ rooms

- Rooms in renter-occupied apartments in Westmoreland County, Virginia
- 231 room
- 92 rooms
- 2273 rooms
- 3514 rooms
- 5735 rooms
- 2566 rooms
- 2377 rooms
- 678 rooms
- 819+ rooms

- Bedrooms in owner-occupied houses in Westmoreland County, Virginia
- 38no bedroom
- 601 bedroom
- 9392 bedrooms
- 3,8843 bedrooms
- 9804 bedrooms
- 3045+ bedrooms

- Bedrooms in renter-occupied apartments in Westmoreland County, Virginia
- 23no bedroom
- 2371 bedroom
- 4742 bedrooms
- 8983 bedrooms
- 2034 bedrooms
- 55+ bedrooms

- Cars and other vehicles available in Westmoreland County in owner-occupied houses/condos
- 175no vehicle
- 1,7021 vehicle
- 2,2032 vehicles
- 1,4113 vehicles
- 3534 vehicles
- 3815+ vehicles

- Cars and other vehicles available in Westmoreland County in renter-occupied apartments
- 321no vehicle
- 7231 vehicle
- 5992 vehicles
- 1493 vehicles
- 434 vehicles
- 135+ vehicles
90.6% of Westmoreland County residents lived in the same house 1 years ago.
Out of people who lived in different houses, 27% lived in this county.
Out of people who lived in different counties, 81% lived in Virginia.
| Westmoreland County: | 90.6% |
| State average: | 86.6% |
Place of birth for U.S.-born residents:
- This state: 10,547
- Other state: 7,076
- Northeast: 1,655
- Midwest: 555
- South: 4,111
- West: 754


- 76.6%Electricity
- 11.8%Fuel oil, kerosene, etc.
- 5.6%Bottled, tank, or LP gas
- 2.8%Utility gas
- 2.6%Wood
- 0.5%No fuel used
- 0.1%Solar energy
- 0.1%Other fuel

- 78.3%Electricity
- 10.4%Fuel oil, kerosene, etc.
- 9.8%Bottled, tank, or LP gas
- 1.3%Wood
- 0.2%Utility gas
Private vs. public school enrollment:
| Here: | 7.1% |
| Virginia: | 13.2% |
| Here: | 0.0% |
| Virginia: | 10.2% |
| Here: | 9.0% |
| Virginia: | 18.7% |


Westmoreland County government finances - Expenditure in 2017:
- Charges - Sewerage: $1,102,000
Elementary and Secondary Education School Lunch: $270,000
Other: $105,000
Elementary and Secondary Education - Other: $34,000
Solid Waste Management: $15,000
- Construction - Sewerage: $816,000
Elementary and Secondary Education: $434,000
- Current Operations - Elementary and Secondary Education: $21,873,000
Public Welfare - Other: $3,522,000
Police Protection: $3,347,000
Solid Waste Management: $1,933,000
Local Fire Protection: $1,730,000
Judicial and Legal Services: $1,560,000
Financial Administration: $1,257,000
Central Staff Services: $921,000
General Public Buildings: $886,000
Sewerage: $879,000
Parks and Recreation: $755,000
Libraries: $458,000
Health - Other: $418,000
General - Other: $376,000
Corrections - Other: $268,000
Protective Inspection and Regulation - Other: $126,000
Housing and Community Development: $67,000
Regular Highways: $38,000
Water Utilities: $17,000
Natural Resources - Other: $13,000
- Federal Intergovernmental - Public Welfare: $925,000
Education: $68,000
Other: $50,000
General Local Government Support: $1,000
- General - Interest on Debt: $326,000
- Intergovernmental to Local - Other - Elementary and Secondary Education: $862,000
- Local Intergovernmental - Education: $781,000
- Long Term Debt - Beginning Outstanding - Unspecified Public Purpose: $15,329,000
Outstanding Unspecified Public Purpose: $14,648,000
Retired Unspecified Public Purpose: $681,000
- Miscellaneous - General Revenue - Other: $1,312,000
Rents: $259,000
Interest Earnings: $93,000
Fines and Forfeits: $78,000
Sale of Property: $10,000
- Other Capital Outlay - Elementary and Secondary Education: $1,641,000
General - Other: $703,000
Judicial and Legal Services: $230,000
- Other Funds - Cash and Securities: $11,740,000
- Revenue - Water Utilities: $31,000
- Sinking Funds - Cash and Securities: $193,000
- State Intergovernmental - Education: $15,127,000
General Local Government Support: $3,802,000
Public Welfare: $1,166,000
Other: $485,000
Highways: $24,000
Health and Hospitals: $21,000
- Tax - Property: $17,089,000
General Sales and Gross Receipts: $855,000
Other Selective Sales: $791,000
Motor Vehicle License: $616,000
Public Utilities Sales: $455,000
Documentary and Stock Transfer: $400,000
Other License: $386,000
- Total Salaries and Wages: $13,783,000
Westmoreland County government finances - Revenue in 2017:
- Charges - Sewerage: $1,102,000
Elementary and Secondary Education School Lunch: $270,000
Other: $105,000
Elementary and Secondary Education - Other: $34,000
Solid Waste Management: $15,000
- Construction - Sewerage: $816,000
Elementary and Secondary Education: $434,000
- Current Operations - Elementary and Secondary Education: $21,873,000
Public Welfare - Other: $3,522,000
Police Protection: $3,347,000
Solid Waste Management: $1,933,000
Local Fire Protection: $1,730,000
Judicial and Legal Services: $1,560,000
Financial Administration: $1,257,000
Central Staff Services: $921,000
General Public Buildings: $886,000
Sewerage: $879,000
Parks and Recreation: $755,000
Libraries: $458,000
Health - Other: $418,000
General - Other: $376,000
Corrections - Other: $268,000
Protective Inspection and Regulation - Other: $126,000
Housing and Community Development: $67,000
Regular Highways: $38,000
Water Utilities: $17,000
Natural Resources - Other: $13,000
- Federal Intergovernmental - Public Welfare: $925,000
Education: $68,000
Other: $50,000
General Local Government Support: $1,000
- General - Interest on Debt: $326,000
- Intergovernmental to Local - Other - Elementary and Secondary Education: $862,000
- Local Intergovernmental - Education: $781,000
- Long Term Debt - Beginning Outstanding - Unspecified Public Purpose: $15,329,000
Outstanding Unspecified Public Purpose: $14,648,000
Retired Unspecified Public Purpose: $681,000
- Miscellaneous - General Revenue - Other: $1,312,000
Rents: $259,000
Interest Earnings: $93,000
Fines and Forfeits: $78,000
Sale of Property: $10,000
- Other Capital Outlay - Elementary and Secondary Education: $1,641,000
General - Other: $703,000
Judicial and Legal Services: $230,000
- Other Funds - Cash and Securities: $11,740,000
- Revenue - Water Utilities: $31,000
- Sinking Funds - Cash and Securities: $193,000
- State Intergovernmental - Education: $15,127,000
General Local Government Support: $3,802,000
Public Welfare: $1,166,000
Other: $485,000
Highways: $24,000
Health and Hospitals: $21,000
- Tax - Property: $17,089,000
General Sales and Gross Receipts: $855,000
Other Selective Sales: $791,000
Motor Vehicle License: $616,000
Public Utilities Sales: $455,000
Documentary and Stock Transfer: $400,000
Other License: $386,000
- Total Salaries and Wages: $13,783,000
Westmoreland County government finances - Debt in 2017:
- Charges - Sewerage: $1,102,000
Elementary and Secondary Education School Lunch: $270,000
Other: $105,000
Elementary and Secondary Education - Other: $34,000
Solid Waste Management: $15,000
- Construction - Sewerage: $816,000
Elementary and Secondary Education: $434,000
- Current Operations - Elementary and Secondary Education: $21,873,000
Public Welfare - Other: $3,522,000
Police Protection: $3,347,000
Solid Waste Management: $1,933,000
Local Fire Protection: $1,730,000
Judicial and Legal Services: $1,560,000
Financial Administration: $1,257,000
Central Staff Services: $921,000
General Public Buildings: $886,000
Sewerage: $879,000
Parks and Recreation: $755,000
Libraries: $458,000
Health - Other: $418,000
General - Other: $376,000
Corrections - Other: $268,000
Protective Inspection and Regulation - Other: $126,000
Housing and Community Development: $67,000
Regular Highways: $38,000
Water Utilities: $17,000
Natural Resources - Other: $13,000
- Federal Intergovernmental - Public Welfare: $925,000
Education: $68,000
Other: $50,000
General Local Government Support: $1,000
- General - Interest on Debt: $326,000
- Intergovernmental to Local - Other - Elementary and Secondary Education: $862,000
- Local Intergovernmental - Education: $781,000
- Long Term Debt - Beginning Outstanding - Unspecified Public Purpose: $15,329,000
Outstanding Unspecified Public Purpose: $14,648,000
Retired Unspecified Public Purpose: $681,000
- Miscellaneous - General Revenue - Other: $1,312,000
Rents: $259,000
Interest Earnings: $93,000
Fines and Forfeits: $78,000
Sale of Property: $10,000
- Other Capital Outlay - Elementary and Secondary Education: $1,641,000
General - Other: $703,000
Judicial and Legal Services: $230,000
- Other Funds - Cash and Securities: $11,740,000
- Revenue - Water Utilities: $31,000
- Sinking Funds - Cash and Securities: $193,000
- State Intergovernmental - Education: $15,127,000
General Local Government Support: $3,802,000
Public Welfare: $1,166,000
Other: $485,000
Highways: $24,000
Health and Hospitals: $21,000
- Tax - Property: $17,089,000
General Sales and Gross Receipts: $855,000
Other Selective Sales: $791,000
Motor Vehicle License: $616,000
Public Utilities Sales: $455,000
Documentary and Stock Transfer: $400,000
Other License: $386,000
- Total Salaries and Wages: $13,783,000
Westmoreland County government finances - Cash and Securities in 2017:
- Charges - Sewerage: $1,102,000
Elementary and Secondary Education School Lunch: $270,000
Other: $105,000
Elementary and Secondary Education - Other: $34,000
Solid Waste Management: $15,000
- Construction - Sewerage: $816,000
Elementary and Secondary Education: $434,000
- Current Operations - Elementary and Secondary Education: $21,873,000
Public Welfare - Other: $3,522,000
Police Protection: $3,347,000
Solid Waste Management: $1,933,000
Local Fire Protection: $1,730,000
Judicial and Legal Services: $1,560,000
Financial Administration: $1,257,000
Central Staff Services: $921,000
General Public Buildings: $886,000
Sewerage: $879,000
Parks and Recreation: $755,000
Libraries: $458,000
Health - Other: $418,000
General - Other: $376,000
Corrections - Other: $268,000
Protective Inspection and Regulation - Other: $126,000
Housing and Community Development: $67,000
Regular Highways: $38,000
Water Utilities: $17,000
Natural Resources - Other: $13,000
- Federal Intergovernmental - Public Welfare: $925,000
Education: $68,000
Other: $50,000
General Local Government Support: $1,000
- General - Interest on Debt: $326,000
- Intergovernmental to Local - Other - Elementary and Secondary Education: $862,000
- Local Intergovernmental - Education: $781,000
- Long Term Debt - Beginning Outstanding - Unspecified Public Purpose: $15,329,000
Outstanding Unspecified Public Purpose: $14,648,000
Retired Unspecified Public Purpose: $681,000
- Miscellaneous - General Revenue - Other: $1,312,000
Rents: $259,000
Interest Earnings: $93,000
Fines and Forfeits: $78,000
Sale of Property: $10,000
- Other Capital Outlay - Elementary and Secondary Education: $1,641,000
General - Other: $703,000
Judicial and Legal Services: $230,000
- Other Funds - Cash and Securities: $11,740,000
- Revenue - Water Utilities: $31,000
- Sinking Funds - Cash and Securities: $193,000
- State Intergovernmental - Education: $15,127,000
General Local Government Support: $3,802,000
Public Welfare: $1,166,000
Other: $485,000
Highways: $24,000
Health and Hospitals: $21,000
- Tax - Property: $17,089,000
General Sales and Gross Receipts: $855,000
Other Selective Sales: $791,000
Motor Vehicle License: $616,000
Public Utilities Sales: $455,000
Documentary and Stock Transfer: $400,000
Other License: $386,000
- Total Salaries and Wages: $13,783,000
Supplemental Security Income (SSI) in 2006:
- Total number of recipients: 416
- Number of aged recipients: 85
- Number of blind and disabled recipients: 331
- Number of recipients under 18: 65
- Number of recipients between 18 and 64: 215
- Number of recipients older than 64: 136
- Number of recipients also receiving OASDI: 208
- Amount of payments (thousands of dollars): 173
| Most common first names in Westmoreland County, VA among deceased individuals | ||
| Name | Count | Lived (average) |
|---|---|---|
| William | 171 | 72.3 years |
| James | 138 | 70.8 years |
| John | 124 | 74.2 years |
| Robert | 110 | 73.7 years |
| Mary | 110 | 79.0 years |
| George | 92 | 72.9 years |
| Charles | 78 | 74.7 years |
| Margaret | 59 | 78.2 years |
| Joseph | 49 | 74.7 years |
| Dorothy | 47 | 75.8 years |
| Most common last names in Westmoreland County, VA among deceased individuals | ||
| Last name | Count | Lived (average) |
|---|---|---|
| Johnson | 81 | 76.0 years |
| Jones | 65 | 76.0 years |
| Tate | 53 | 72.1 years |
| Smith | 53 | 75.5 years |
| Jenkins | 50 | 77.0 years |
| Davis | 39 | 77.1 years |
| Thompson | 35 | 76.0 years |
| Hall | 30 | 78.4 years |
| Ashton | 30 | 76.0 years |
| Brown | 29 | 75.1 years |
| Businesses in Westmoreland County, VA | ||||
| Name | Count | Name | Count | |
|---|---|---|---|---|
| 7-Eleven | 2 | Papa John's Pizza | 1 | |
| Chevrolet | 1 | Rite Aid | 2 | |
| Domino's Pizza | 1 | Subway | 1 | |
| FedEx | 1 | True Value | 2 | |
| H&R Block | 1 | U-Haul | 2 | |
| MasterBrand Cabinets | 8 | UPS | 2 | |
| McDonald's | 1 | |||
Westmoreland County on our top lists:
- #18 on the list of "Top 101 counties with highest percentage of residents voting for 3rd party candidates in the 2012 Presidential Election"