Spotsylvania County, Virginia (VA)
County owner-occupied free and clear houses and condos in 2010: 5,158
County owner-occupied houses and condos in 2000: 25,736
Renter-occupied apartments: 8,684 (it was 5,572 in 2000)
| % of renters here: | 18% |
| State: | 33% |
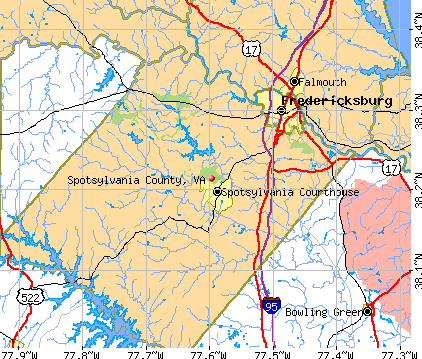
Land area: 401 sq. mi.
Water area: 11.4 sq. mi.
Population density: 366 people per square mile (high).
Industries providing employment: Educational, health and social services (20.1%), Professional, scientific, management, administrative, and waste management services (15.6%), Retail trade (13.1%), Public administration (12.7%).
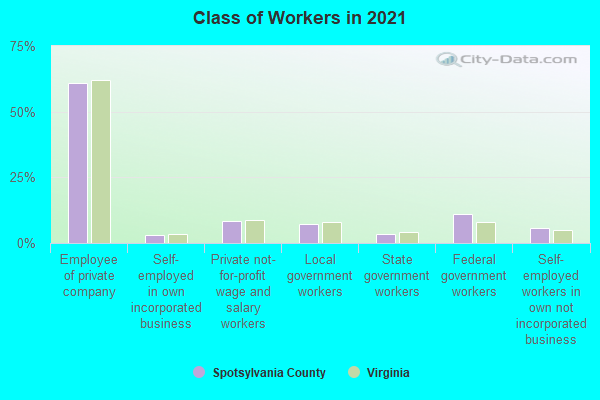
Type of workers:
- Private wage or salary: 71%
- Government: 25%
- Self-employed, not incorporated: 5%
- Unpaid family work: 0%
- OSM Map
- General Map
- Google Map
- MSN Map

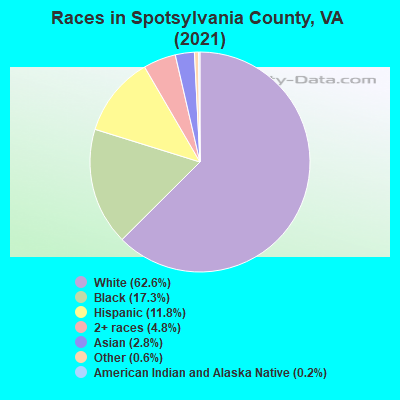
- 91,01762.0%White Non-Hispanic Alone
- 23,95716.3%Black Non-Hispanic Alone
- 18,55812.7%Hispanic or Latino
- 8,1835.6%Two or more races
- 4,1292.8%Asian alone
- 6100.4%Some other race alone
- 1460.10%American Indian and Alaska Native alone
- 880.06%Native Hawaiian and Other
Pacific Islander alone
| Median resident age: | 38.3 years |
| Virginia median age: | 39.0 years |
| Males: 73,440 | |
| Females: 73,248 |

 | Navigating Life in NOVA during Covid19 (490 replies) |
| Relocating to within 2 hours driving commute of Charlottesville and Chantilly, VA? (5 replies) |
| Relocation to Northern VA (49 replies) |
| Is Publix Expanding into Spotsylvania County, Virginia? (20 replies) |
| Spotsylvania Living—Is it for us (23 replies) |
| Seeking rural area for occasional commute to DC (18 replies) |
| Spotsylvania County: | 2.0 people |
| Virginia: | 3 people |
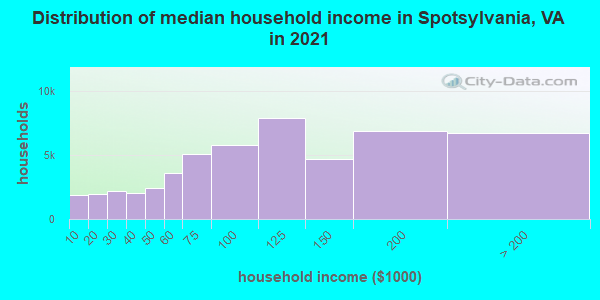
Estimated median household income in 2022: $95,870 ($57,525 in 1999)
| This county: | $95,870 |
| Virginia: | $85,873 |
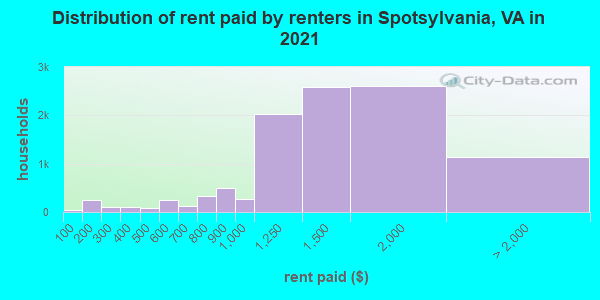
Median contract rent in 2022 for apartments: $1,478 (lower quartile is $1,198, upper quartile is $1,807)
| This county: | $1478 |
| State: | $1270 |
Estimated median house or condo value in 2022: $391,900 (it was $125,700 in 2000)
| Spotsylvania: | $391,900 |
| Virginia: | $365,700 |
Mean price in 2022:
Median monthly housing costs for homes and condos with a mortgage: $1,850Detached houses: $420,353
Here: $420,353 State: $472,865 Townhouses or other attached units: $341,880
Here: $341,880 State: $457,437 In 5-or-more-unit structures: $495,171
Here: $495,171 State: $382,551 Mobile homes: $114,725
Here: $114,725 State: $100,736
Median monthly housing costs for units without a mortgage: $484
Institutionalized population: 413
Crime in 2021 (reported by the sheriff's office or county police, not the county total):
- Murders: 3
- Rapes: 18
- Robberies: 13
- Assaults: 100
- Burglaries: 44
- Thefts: 588
- Auto thefts: 64
Crime in 2020 (reported by the sheriff's office or county police, not the county total):
- Murders: 5
- Rapes: 30
- Robberies: 11
- Assaults: 104
- Burglaries: 43
- Thefts: 664
- Auto thefts: 73
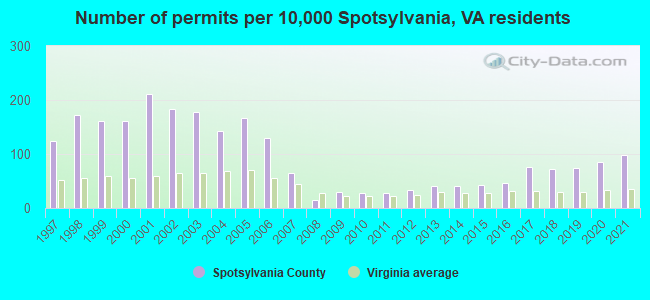
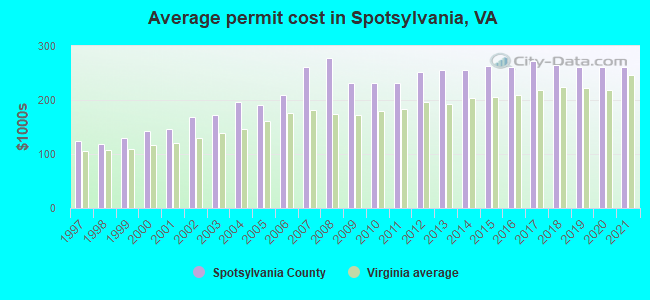
Single-family new house construction building permits:
- 2022: 766 buildings, average cost: $262,000
- 2021: 888 buildings, average cost: $262,000
- 2020: 779 buildings, average cost: $262,100
- 2019: 675 buildings, average cost: $261,500
- 2018: 648 buildings, average cost: $264,100
- 2017: 689 buildings, average cost: $271,900
- 2016: 420 buildings, average cost: $260,900
- 2015: 390 buildings, average cost: $262,500
- 2014: 375 buildings, average cost: $256,000
- 2013: 362 buildings, average cost: $256,000
- 2012: 300 buildings, average cost: $251,400
- 2011: 248 buildings, average cost: $231,900
- 2010: 254 buildings, average cost: $232,300
- 2009: 258 buildings, average cost: $230,600
- 2008: 131 buildings, average cost: $276,600
- 2007: 580 buildings, average cost: $261,400
- 2006: 1174 buildings, average cost: $210,000
- 2005: 1511 buildings, average cost: $190,100
- 2004: 1290 buildings, average cost: $197,400
- 2003: 1596 buildings, average cost: $172,700
- 2002: 1651 buildings, average cost: $168,700
- 2001: 1903 buildings, average cost: $146,700
- 2000: 1460 buildings, average cost: $142,900
- 1999: 1463 buildings, average cost: $130,300
- 1998: 1562 buildings, average cost: $118,000
- 1997: 1117 buildings, average cost: $124,900
Median real estate property taxes paid for housing units with mortgages in 2022: $2,293 (0.6%)
Median real estate property taxes paid for housing units with no mortgage in 2022: $2,027 (0.5%)

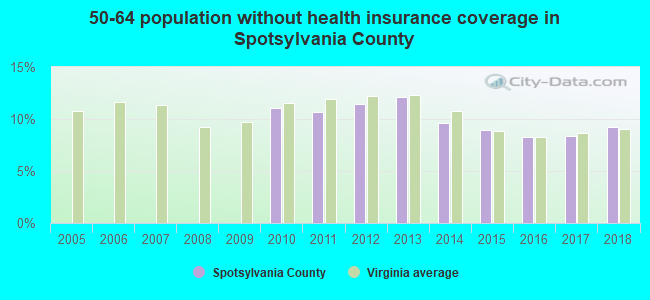
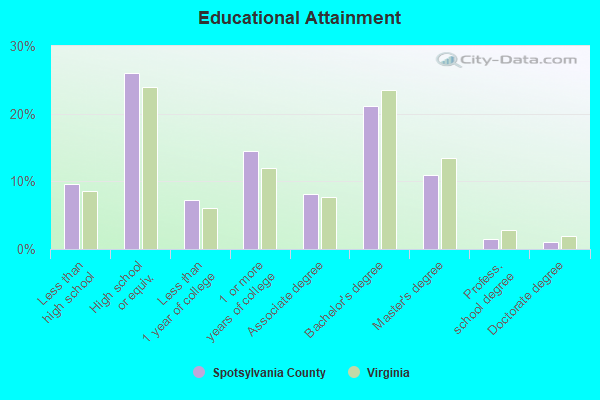
| Spotsylvania County: | 9.4% |
| Virginia: | 10.6% |
Median age of residents in 2022: 38.3 years old
(Males: 36.8 years old, Females: 39.8 years old)
(Median age for: White residents: 41.8 years old, Black residents: 36.8 years old, American Indian residents: 60.4 years old, Asian residents: 37.9 years old, Hispanic or Latino residents: 26.6 years old, Other race residents: 32.5 years old)
Area name: Washington-Arlington-Alexandria, DC-VA-MD HUD Metro FMR Area
Fair market rent in 2006 for a 1-bedroom apartment in Spotsylvania County is $1080 a month.
Fair market rent for a 2-bedroom apartment is $1225 a month.
Fair market rent for a 3-bedroom apartment is $1580 a month.
Cities in this county include: Spotsylvania Courthouse, Lake Wilderness.
Neighboring counties: Accomack County  , Clark County, Indiana
  , Harrison County, Indiana , Mineral County, Colorado , Madison County
  , Orange County, Indiana , Warrick County, Indiana .
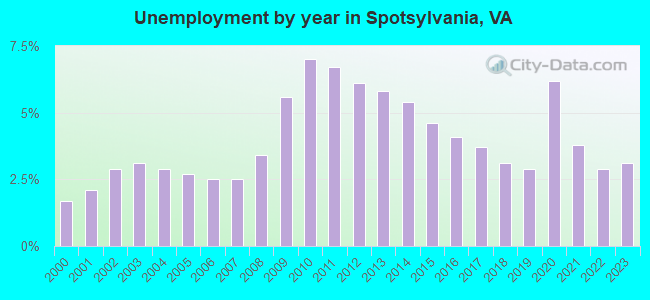
| Here: | 2.8% |
| Virginia: | 2.7% |
Current college students: 3,690
People 25 years of age or older with a high school degree or higher: 89.5%
People 25 years of age or older with a bachelor's degree or higher: 33.8%
Number of foreign born residents: 15,714 (55.9% naturalized citizens)
| Spotsylvania County: | 10.7% |
| Whole state: | 12.7% |
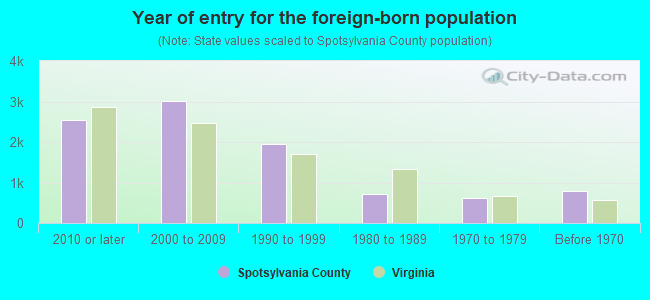
- Year of entry for the foreign-born population
- 3,4842010 or later
- 3,5512000 to 2009
- 2,3941990 to 1999
- 7081980 to 1989
- 6151970 to 1979
- 789Before 1970
Mean travel time to work (commute): % minutes
Percentage of county residents living and working in this county: 95.2%
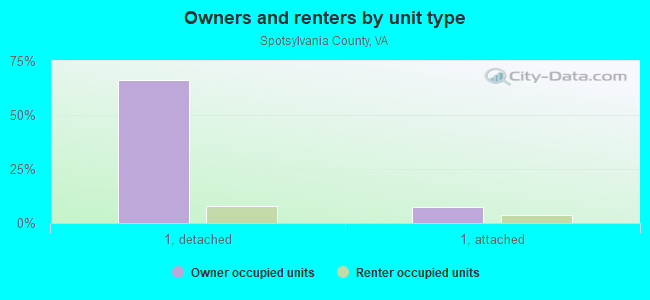
Housing units in structures:
- One, detached: 41,859
- One, attached: 5,640
- Two: 218
- 3 or 4: 530
- 5 to 9: 823
- 10 to 19: 1,119
- 20 to 49: 2,089
- 50 or more: 1,446
- Mobile homes: 1,683
- Boats, RVs, vans, etc.: 73
Housing units in Spotsylvania County with a mortgage: 29,816 (3,001 second mortgage, 459 home equity loan, 1,897 both second mortgage and home equity loan)
Houses without a mortgage: 696
| Here: | 4.0% with mortgage |
| State: | 97.2% with mortgage |
Religion statistics for Spotsylvania County
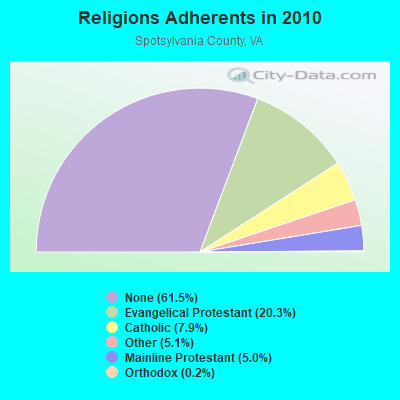
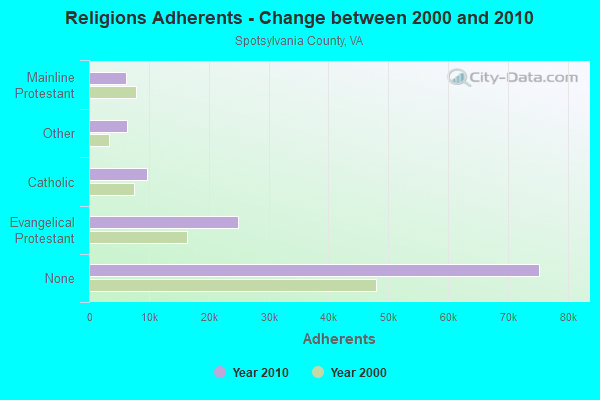
| Religion | Adherents | Congregations |
|---|---|---|
| Evangelical Protestant | 24,831 | 51 |
| Catholic | 9,627 | 3 |
| Other | 6,276 | 11 |
| Mainline Protestant | 6,155 | 15 |
| Orthodox | 225 | 1 |
| None | 75,283 | - |
Source: Clifford Grammich, Kirk Hadaway, Richard Houseal, Dale E.Jones, Alexei Krindatch, Richie Stanley and Richard H.Taylor. 2012. 2010 U.S.Religion Census: Religious Congregations & Membership Study. Association of Statisticians of American Religious Bodies. Jones, Dale E., et al. 2002. Congregations and Membership in the United States 2000. Nashville, TN: Glenmary Research Center.
Food Environment Statistics:
| Spotsylvania County: | 1.85 / 10,000 pop. |
| State: | 2.03 / 10,000 pop. |
| Here: | 0.25 / 10,000 pop. |
| Virginia: | 0.17 / 10,000 pop. |
| This county: | 0.59 / 10,000 pop. |
| Virginia: | 1.43 / 10,000 pop. |
| Spotsylvania County: | 4.04 / 10,000 pop. |
| Virginia: | 4.03 / 10,000 pop. |
| This county: | 5.47 / 10,000 pop. |
| State: | 7.65 / 10,000 pop. |
| Spotsylvania County: | 9.2% |
| Virginia: | 9.3% |
| Spotsylvania County: | 29.2% |
| State: | 26.7% |
| Here: | 19.0% |
| State: | 18.6% |
Agriculture in Spotsylvania County:
Average size of farms: 153 acresAverage value of agricultural products sold per farm: $16,090
Average value of crops sold per acre for harvested cropland: $96.99
The value of nursery, greenhouse, floriculture, and sod as a percentage of the total market value of agricultural products sold: 2.86%
The value of livestock, poultry, and their products as a percentage of the total market value of agricultural products sold: 70.70%
Average total farm production expenses per farm: $22,428
Harvested cropland as a percentage of land in farms: 31.83%
Irrigated harvested cropland as a percentage of land in farms: 1.84%
Average market value of all machinery and equipment per farm: $36,238
The percentage of farms operated by a family or individual: 89.43%
Average age of principal farm operators: 57 years
Average number of cattle and calves per 100 acres of all land in farms: 16.22
Milk cows as a percentage of all cattle and calves: 9.67%
Corn for grain: 3132 harvested acres
All wheat for grain: 487 harvested acres
Soybeans for beans: 1954 harvested acres
Vegetables: 60 harvested acres
Land in orchards: 62 acres
Earthquake activity:
Spotsylvania County-area historical earthquake activity is significantly above Virginia state average. It is 53% smaller than the overall U.S. average.On 8/23/2011 at 17:51:04, a magnitude 5.8 (5.8 MW, Depth: 3.7 mi, Class: Moderate, Intensity: VI - VII) earthquake occurred 28.0 miles away from Spotsylvania County center
On 8/25/2011 at 05:07:52, a magnitude 4.5 (4.5 ML, Depth: 4.2 mi, Class: Light, Intensity: IV - V) earthquake occurred 27.3 miles away from the county center
On 12/9/2003 at 20:59:18, a magnitude 4.5 (4.5 ML, Depth: 6.2 mi) earthquake occurred 40.9 miles away from the county center
On 12/9/2003 at 20:59:14, a magnitude 4.5 (4.5 MB, 4.5 LG) earthquake occurred 46.4 miles away from the county center
On 8/24/2011 at 00:04:36, a magnitude 4.2 (4.2 ML) earthquake occurred 28.4 miles away from Spotsylvania County center
On 8/9/2020 at 12:07:37, a magnitude 5.1 (5.1 MW, Depth: 4.7 mi) earthquake occurred 226.7 miles away from the county center
Magnitude types: regional Lg-wave magnitude (LG), body-wave magnitude (MB), local magnitude (ML), moment magnitude (MW)
Most recent natural disasters:
- Virginia Covid-19 Pandemic, Incident Period: January 20, 2020, Major Disaster (Presidential) Declared DR-4512-VA: April 2, 2020, FEMA Id: 4512, Natural disaster type: Other
- Virginia Severe Winter Storm And Snowstorm, Incident Period: January 22, 2016 to January 23, 2016, Major Disaster (Presidential) Declared DR-4262: March 07, 2016, FEMA Id: 4262, Natural disaster type: Snowstorm, Winter Storm
- Virginia Hurricane Sandy, Incident Period: October 26, 2012 to November 01, 2012, Emergency Declared EM-3359: October 29, 2012, FEMA Id: 3359, Natural disaster type: Hurricane
- Virginia Earthquake, Incident Period: August 23, 2011 to October 25, 2011, Major Disaster (Presidential) Declared DR-4042: November 04, 2011, FEMA Id: 4042, Natural disaster type: Earthquake
- Virginia Severe Winter Storms and Snowstorms, Incident Period: February 05, 2010 to February 11, 2010, Major Disaster (Presidential) Declared DR-1905: April 27, 2010, FEMA Id: 1905, Natural disaster type: Snowstorm, Winter Storm
- Virginia Severe Winter Storm and Snowstorm, Incident Period: December 18, 2009 to December 20, 2009, Major Disaster (Presidential) Declared DR-1874: February 16, 2010, FEMA Id: 1874, Natural disaster type: Snowstorm, Winter Storm
- Virginia Hurricane Katrina Evacuation, Incident Period: August 29, 2005 to October 01, 2005, Emergency Declared EM-3240: September 12, 2005, FEMA Id: 3240, Natural disaster type: Hurricane
- Virginia Hurricane Isabel, Incident Period: September 18, 2003 to October 01, 2003, Major Disaster (Presidential) Declared DR-1491: September 18, 2003, FEMA Id: 1491, Natural disaster type: Hurricane
- Virginia Winter Storm, Incident Period: January 25, 2000 to January 30, 2000, Major Disaster (Presidential) Declared DR-1318: February 28, 2000, FEMA Id: 1318, Natural disaster type: Winter Storm
- Virginia Blizzard, Incident Period: January 06, 1996 to January 12, 1996, Major Disaster (Presidential) Declared DR-1086: January 13, 1996, FEMA Id: 1086, Natural disaster type: Blizzard
- 5 other natural disasters have been reported since 1953.
The number of natural disasters in Spotsylvania County (15) is near the US average (15).
Major Disasters (Presidential) Declared: 11
Emergencies Declared: 4
Causes of natural disasters: Winter Storms: 6, Hurricanes: 3, Snowstorms: 3, Storms: 2, Blizzard: 1, Drought: 1, Earthquake: 1, Flood: 1, Ice Storm: 1, Tropical Storm: 1, Other: 1 (Note: some incidents may be assigned to more than one category).
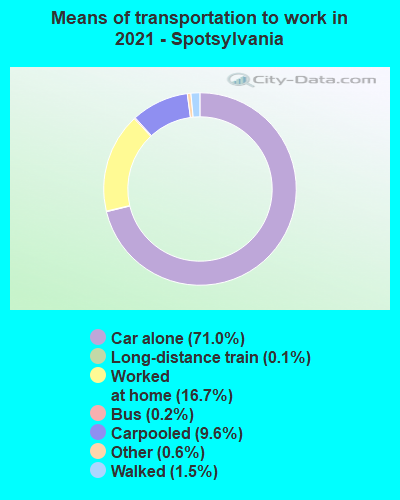
Means of transportation to work:
- Drove a car alone: 29,582 (65.4%)
- Carpooled: 3,960 (8.8%)
- Bus: 25 (0.1%)
- Subway or elevated rail: 13 (0.0%)
- Long-distance train or commuter rail: 28 (0.1%)
- Light rail, streetcar or trolley: 17 (0.0%)
- Taxicab, motorcycle, or other means: 331 (0.7%)
- Bicycle: 23 (0.1%)
- Walked: 711 (1.6%)
- Worked at home: 11,597 (25.6%)

- Health care and social assistance (18%)
- Educational services (9%)
- Retail trade (9%)
- Public administration (9%)
- Professional, scientific, and technical services (7%)
- Finance and insurance (6%)
- Other services, except public administration (6%)
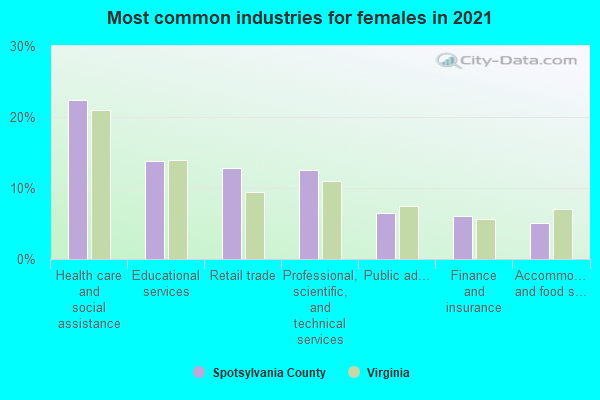
- Health care and social assistance (21%)
- Educational services (11%)
- Retail trade (11%)
- Public administration (11%)
- Professional, scientific, and technical services (8%)
- Finance and insurance (8%)
- Other services, except public administration (7%)
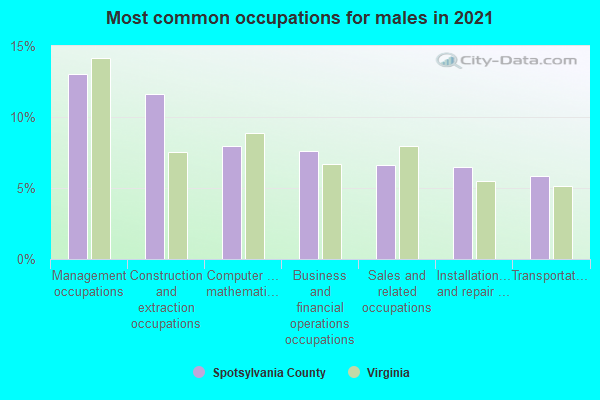
- Construction and extraction occupations (12%)
- Management occupations (11%)
- Installation, maintenance, and repair occupations (10%)
- Computer and mathematical occupations (8%)
- Sales and related occupations (7%)
- Office and administrative support occupations (6%)
- Architecture and engineering occupations (5%)
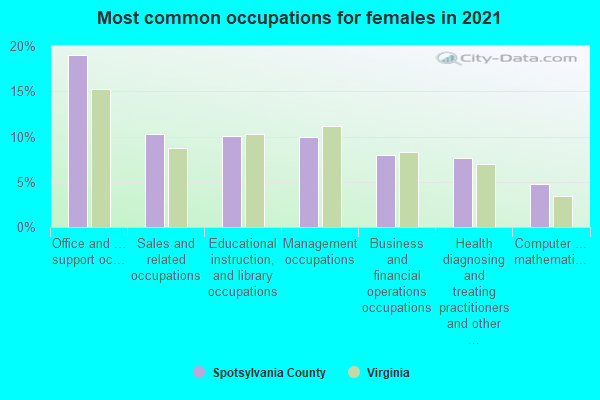
- Office and administrative support occupations (14%)
- Management occupations (10%)
- Sales and related occupations (9%)
- Educational instruction, and library occupations (9%)
- Health diagnosing and treating practitioners and other technical occupations (8%)
- Business and financial operations occupations (7%)
- Healthcare support occupations (6%)

- El Salvador (18%)
- Mexico (12%)
- China, excluding Hong Kong and Taiwan (4%)
- Afghanistan (4%)
- Korea (3%)
- Cuba (3%)
- Honduras (3%)
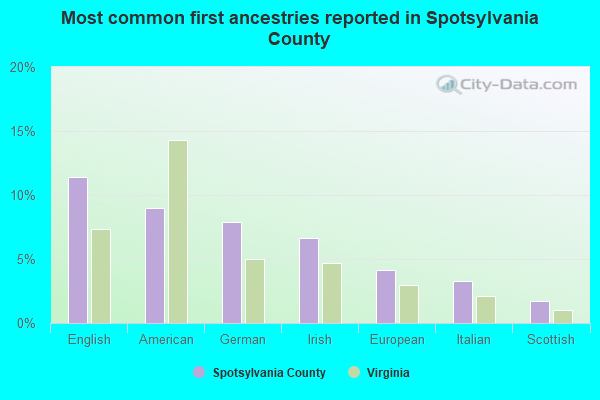
- English (12%)
- American (8%)
- German (7%)
- Irish (7%)
- European (4%)
- Italian (3%)
- Scottish (2%)

People in group quarters in Spotsylvania County, Virginia in 2010:
- 413 people in nursing facilities/skilled-nursing facilities
- 56 people in residential treatment centers for adults
- 55 people in group homes intended for adults
People in group quarters in Spotsylvania County, Virginia in 2000:
- 369 people in nursing homes
- 133 people in other noninstitutional group quarters
- 52 people in hospitals or wards for drug/alcohol abuse
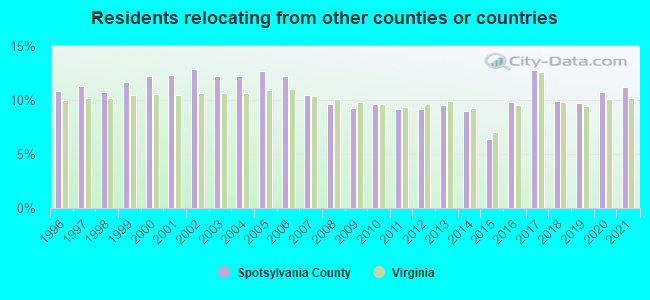
11.22% of this county's 2021 resident taxpayers lived in other counties in 2020 ($75,881 average adjusted gross income)
| Here: | 11.22% |
| Virginia average: | 10.16% |
0.07% of residents moved from foreign countries ($497 average AGI)
Spotsylvania County: 0.07% Virginia average: 0.12%
8.14% relocated from other counties in Virginia ($55,463 average AGI)
3.02% relocated from other states ($19,920 average AGI)
Spotsylvania County: 3.02% Virginia average: 3.91%
Top counties from which taxpayers relocated into this county between 2020 and 2021:
| from Stafford County, VA | |
| from Prince William County, VA | |
| from Fredericksburg city, VA | |
| from Fairfax County, VA | |
| from Caroline County, VA | |
| from Orange County, VA | |
| from King George County, VA |
9.52% of this county's 2020 resident taxpayers moved to other counties in 2021 ($66,345 average adjusted gross income)
| Here: | 9.52% |
| Virginia average: | 10.20% |
0.05% of residents moved to foreign countries ($568 average AGI)
Spotsylvania County: 0.05% Virginia average: 0.09%
6.31% relocated to other counties in Virginia ($41,450 average AGI)
3.16% relocated to other states ($24,327 average AGI)
Spotsylvania County: 3.16% Virginia average: 3.98%

Top counties to which taxpayers relocated from this county between 2020 and 2021:
| to Stafford County, VA | |
| to Fredericksburg city, VA | |
| to Caroline County, VA | |
| to Orange County, VA | |
| to Prince William County, VA | |
| to Fairfax County, VA | |
| to King George County, VA |
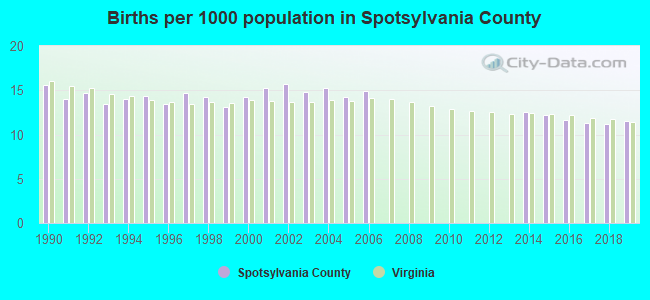
Births per 1000 population from 1990 to 1999: 14.2
Births per 1000 population from 2000 to 2009: 10.4
Births per 1000 population from 2010 to 2022: 6.3
Deaths per 1000 population from 1990 to 1999: 5.6
Deaths per 1000 population from 2000 to 2009: 5.7
Deaths per 1000 population from 2010 to 2020: 6.8

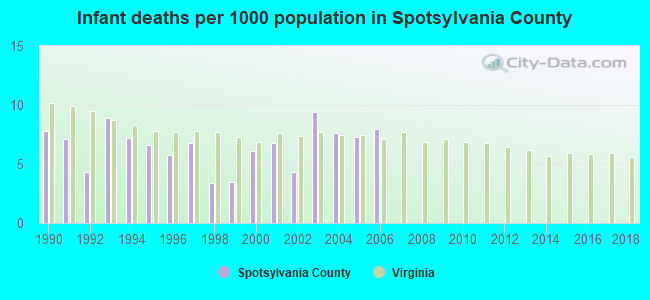
Infant deaths per 1000 live births from 1990 to 1999: 6.1
Infant deaths per 1000 live births from 2000 to 2006: 7.1
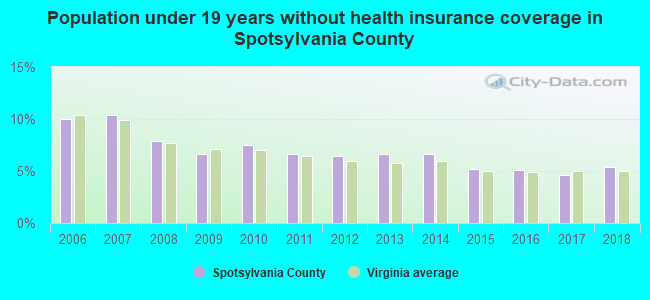
Persons under 19 years old without health insurance coverage in 2018: 5.4%
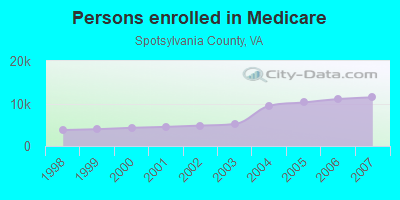
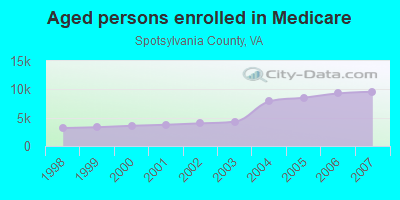
Persons enrolled in hospital insurance and/or supplemental medical insurance (Medicare) in July 1, 2007: 11,448 (9,577 aged, 1,871 disabled)
Children under 18 without health insurance coverage in 2007: 3,303 (10%)

Most common underlying causes of death in Spotsylvania County, Virginia in 1999 - 2019:
- Bronchus or lung, unspecified - Malignant neoplasms (1,083)
- Acute myocardial infarction, unspecified (795)
- Atherosclerotic heart disease (709)
- Chronic obstructive pulmonary disease, unspecified (585)
- Unspecified dementia (531)
- Alzheimer disease, unspecified (507)
- Stroke, not specified as haemorrhage or infarction (361)
- Congestive heart failure (331)
- Septicaemia, unspecified (306)
- Breast, unspecified - Malignant neoplasms (289)
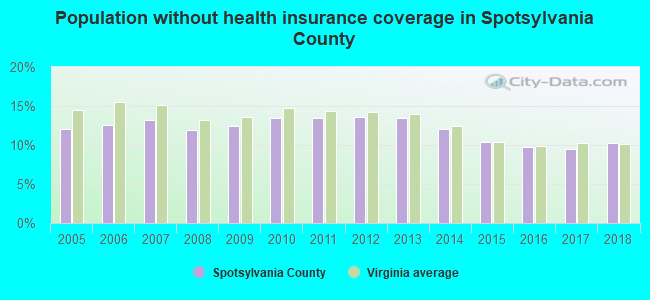
Population without health insurance coverage in 2000: 11%
Children under 18 without health insurance coverage in 2000: 9%
Medical specialist MDs per 100,000 population in 2005: 547
Dentists per 100,000 population in 1998: 3
Total births per 100,000 population, July 2005 - July 2006 : 31
Total deaths per 100,000 population, July 2005 - July 2006: 51
Limited-service eating places per 100,000 population in 2005 : 8
Beer, wine & liquor stores per 100,000 population in 2005: 1
Suicides per 1,000,000 population from 2000 to 2006: 107.0. This is less than state average.
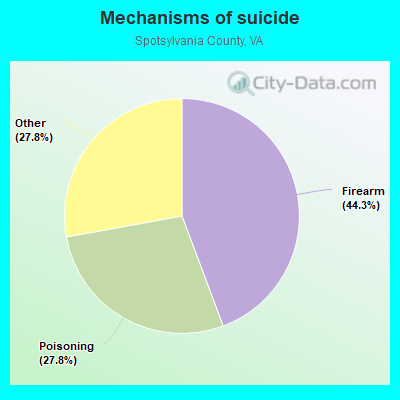
- Firearm - 47.4
- Poisoning - 29.8
- Other - 29.8
Household type by relationship:
Households: 146,688- Male householders: 26,525 (4,356 living alone), Female householders: 25,890 (6,481 living alone)
30,998 spouses (30,496 opposite-sex spouses), 4,151 unmarried partners, (3,922 opposite-sex unmarried partners), 45,718 children (42,512 natural, 921 adopted, 2,285 stepchildren), 2,816 grandchildren, 685 brothers or sisters, 2,191 parents, 68 foster children, 2,775 other relatives, 4,548 non-relatives
- In group quarters: 323
Size of family households: 15,438 2-persons, 8,251 3-persons, 7,137 4-persons, 3,872 5-persons, 2,346 6-persons, 1,525 7-or-more-persons.
Size of nonfamily households: 10,837 1-person, 2,459 2-persons, 197 3-persons, 105 4-persons, 248 7-or-more-persons.
23,865 married couples with children.
7,814 single-parent households (3,296 men, 4,518 women).
87.2% of residents of Spotsylvania speak English at home.
8.1% of residents speak Spanish at home (60% speak English very well, 25% speak English well, 14% speak English not well, 2% don't speak English at all).
2.0% of residents speak other Indo-European language at home (72% speak English very well, 20% speak English well, 7% speak English not well).
1.4% of residents speak Asian or Pacific Island language at home (51% speak English very well, 36% speak English well, 12% speak English not well).
0.9% of residents speak other language at home (73% speak English very well, 26% speak English well, 1% speak English not well).
In fiscal year 2004:
Federal Government expenditure: $302,750,000 ($2,707 per capita)
Department of Defense expenditure: $78,601,000
Federal direct payments to individuals for retirement and disability: $182,562,000
Federal other direct payments to individuals: $25,341,000
Federal direct payments not to individuals: $446,000
Federal grants: $17,271,000
Federal procurement contracts: $61,890,000 ($60,742,000 Department of Defense)
Federal salaries and wages: $15,240,000 ($0,000 Department of Defense)
Federal Government direct loans: $2,220,000
Federal guaranteed/insured loans: $312,488,000
Federal Government insurance: $28,973,000
Population change from April 1, 2000 to July 1, 2005:
Births: 8,218| Here: | 71 per 1000 residents |
| State: | 70 per 1000 residents |
Deaths: 3,255
| Here: | 28 per 1000 residents |
| State: | 40 per 1000 residents |
Net international migration: +335
| Here: | +3 per 1000 residents |
| State: | +18 per 1000 residents |
Net internal migration: +21,015
| Here: | +180 per 1000 residents |
| State: | +14 per 1000 residents |
Total withdrawal of fresh water for public supply: 3.31 millions of gallons per day (all from surface)
| Here: | 7.5 |
| State: | 7.0 |
| Here: | 4.8 |
| State: | 4.3 |
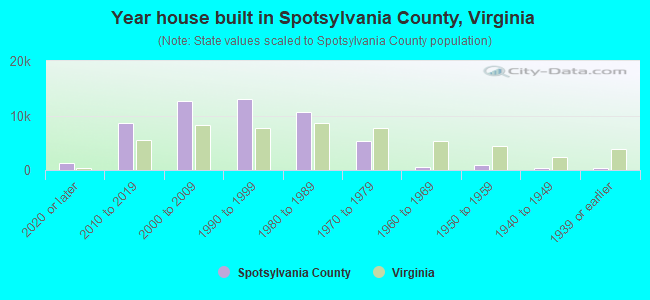
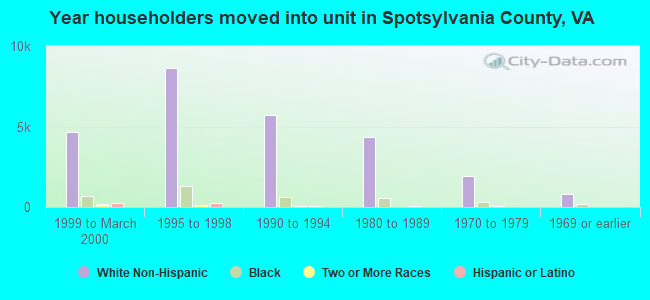
- Year house built in Spotsylvania County, Virginia
- 2,4042020 or later
- 9,1152010 to 2019
- 14,3342000 to 2009
- 10,6081990 to 1999
- 9,8731980 to 1989
- 5,5601970 to 1979
- 1,0761960 to 1969
- 1,5301950 to 1959
- 1871940 to 1949
- 7931939 or earlier
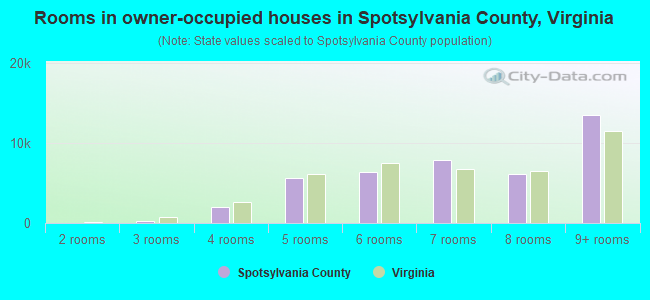
- Rooms in owner-occupied houses in Spotsylvania County, Virginia
- 01 room
- 02 rooms
- 4323 rooms
- 2,4434 rooms
- 4,5845 rooms
- 5,7226 rooms
- 7,1907 rooms
- 6,2378 rooms
- 14,4049+ rooms
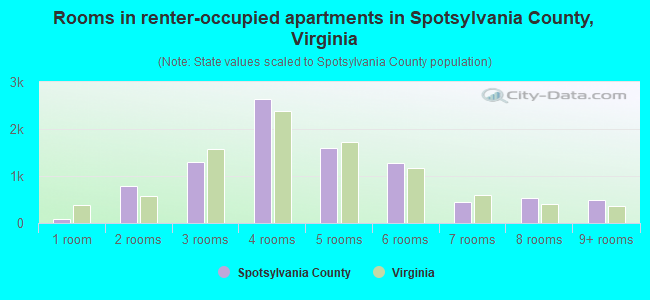
- Rooms in renter-occupied apartments in Spotsylvania County, Virginia
- 01 room
- 3372 rooms
- 1,8743 rooms
- 2,5984 rooms
- 2,9675 rooms
- 1,7306 rooms
- 1,1507 rooms
- 3238 rooms
- 4249+ rooms
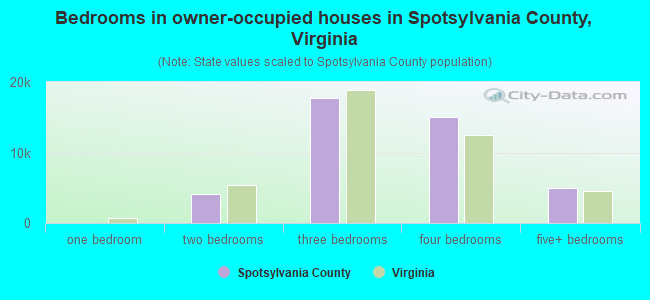
- Bedrooms in owner-occupied houses in Spotsylvania County, Virginia
- 0no bedroom
- 1741 bedroom
- 3,1572 bedrooms
- 16,5293 bedrooms
- 15,2344 bedrooms
- 5,9185+ bedrooms
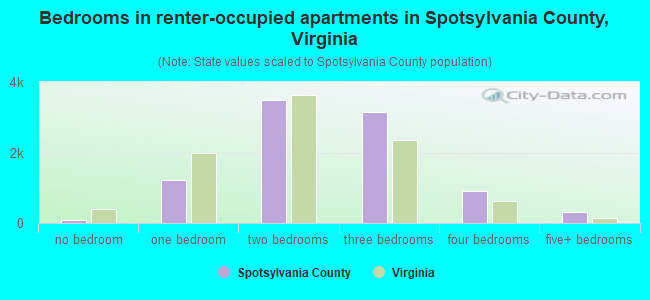
- Bedrooms in renter-occupied apartments in Spotsylvania County, Virginia
- 0no bedroom
- 1,9001 bedroom
- 3,4042 bedrooms
- 4,9013 bedrooms
- 1,1344 bedrooms
- 645+ bedrooms
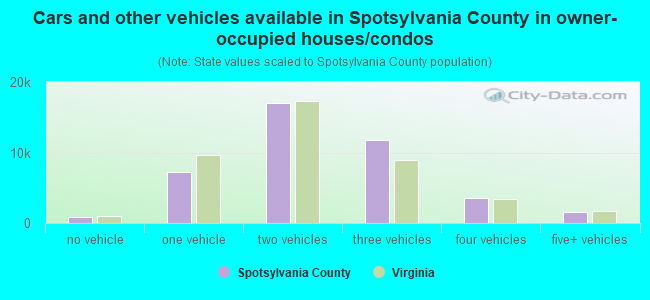
- Cars and other vehicles available in Spotsylvania County in owner-occupied houses/condos
- 776no vehicle
- 7,6791 vehicle
- 15,4392 vehicles
- 9,8493 vehicles
- 4,8654 vehicles
- 2,4045+ vehicles
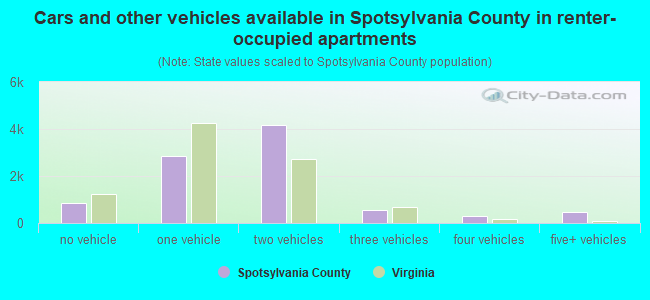
- Cars and other vehicles available in Spotsylvania County in renter-occupied apartments
- 1,214no vehicle
- 4,6391 vehicle
- 4,0052 vehicles
- 1,0323 vehicles
- 2554 vehicles
- 2585+ vehicles
88.0% of Spotsylvania County residents lived in the same house 1 years ago.
Out of people who lived in different houses, 25% lived in this county.
Out of people who lived in different counties, 73% lived in Virginia.
| Spotsylvania County: | 88.0% |
| State average: | 86.6% |
Place of birth for U.S.-born residents:
- This state: 72,565
- Other state: 55,537
- Northeast: 15,911
- Midwest: 7,245
- South: 26,718
- West: 5,663
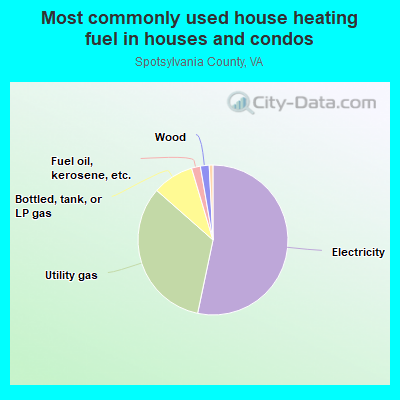
- 53.7%Electricity
- 33.4%Utility gas
- 8.3%Bottled, tank, or LP gas
- 2.2%Fuel oil, kerosene, etc.
- 1.7%Wood
- 0.4%No fuel used
- 0.2%Other fuel
- 0.1%Solar energy
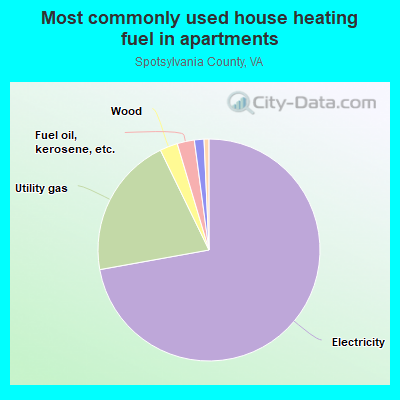
- 71.1%Electricity
- 21.7%Utility gas
- 2.7%Fuel oil, kerosene, etc.
- 2.5%Wood
- 1.2%Bottled, tank, or LP gas
- 0.6%No fuel used
- 0.3%Other fuel
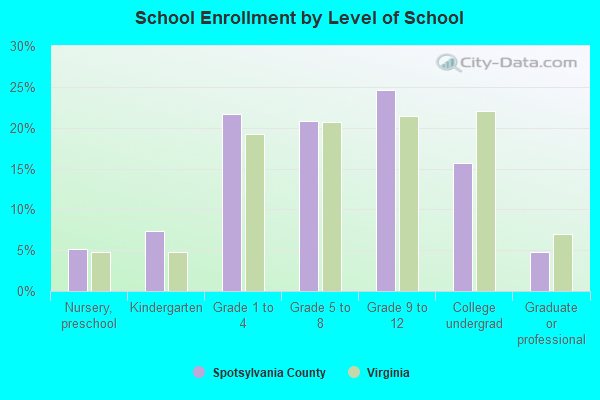
Private vs. public school enrollment:
| Here: | 12.5% |
| Virginia: | 13.2% |
| Here: | 10.8% |
| Virginia: | 10.2% |
| Here: | 19.7% |
| Virginia: | 18.7% |

Spotsylvania County government finances - Expenditure in 2018:
- Bond Funds - Cash and Securities: $24,747,000
Cash and Securities: $24,591,000
- Charges - Sewerage: $17,828,000
Sewerage: $17,456,000
Other: $5,265,000
Elementary and Secondary Education School Lunch: $4,572,000
Elementary and Secondary Education School Lunch: $4,237,000
Other: $4,183,000
Solid Waste Management: $3,077,000
Solid Waste Management: $2,763,000
Parks and Recreation: $535,000
Elementary and Secondary Education School Tuition and Transportation: $391,000
Parks and Recreation: $360,000
Elementary and Secondary Education - Other: $242,000
Elementary and Secondary Education School Tuition and Transportation: $124,000
Elementary and Secondary Education - Other: $74,000
Regular Highways: $6,000
- Construction - Elementary and Secondary Education: $33,235,000
Elementary and Secondary Education: $17,579,000
General - Other: $17,175,000
Water Utilities: $4,186,000
Water Utilities: $4,138,000
Sewerage: $3,038,000
Sewerage: $2,298,000
General Public Buildings: $1,771,000
Police Protection: $753,000
Judicial and Legal Services: $664,000
General - Other: $565,000
Local Fire Protection: $244,000
Parks and Recreation: $201,000
- Current Operations - Elementary and Secondary Education: $277,831,000
Elementary and Secondary Education: $255,641,000
Public Welfare - Other: $26,518,000
Local Fire Protection: $26,245,000
Police Protection: $23,176,000
Local Fire Protection: $22,815,000
Police Protection: $21,568,000
Public Welfare - Other: $12,321,000
Public Welfare, Vendor Payments for Other Purposes: $12,277,000
Water Utilities: $11,609,000
Public Welfare, Vendor Payments for Other Purposes: $10,929,000
Water Utilities: $9,376,000
Sewerage: $9,347,000
Judicial and Legal Services: $9,069,000
General - Other: $8,996,000
Sewerage: $8,521,000
General - Other: $7,775,000
Correctional Institutions: $7,612,000
Financial Administration: $6,673,000
Correctional Institutions: $6,466,000
General Public Buildings: $6,379,000
Financial Administration: $6,327,000
Judicial and Legal Services: $5,640,000
Solid Waste Management: $5,631,000
Libraries: $5,023,000
General Public Buildings: $4,630,000
Central Staff Services: $4,618,000
Libraries: $4,435,000
Housing and Community Development: $4,362,000
Solid Waste Management: $3,864,000
Protective Inspection and Regulation - Other: $3,843,000
Central Staff Services: $3,786,000
Parks and Recreation: $3,695,000
Parks and Recreation: $3,438,000
Transit Utilities: $2,373,000
Regular Highways: $2,144,000
Protective Inspection and Regulation - Other: $2,132,000
Health - Other: $1,087,000
Health - Other: $634,000
Corrections - Other: $232,000
Natural Resources - Other: $153,000
Miscellaneous Commercial Activities - Other: $93,000
- Federal Intergovernmental - Other: $2,953,000
Other: $2,028,000
Education: $1,565,000
Education: $1,452,000
General Local Government Support: $25,000
- General - Interest on Debt: $4,676,000
Interest on Debt: $4,165,000
- Intergovernmental to Local - Other - Elementary and Secondary Education: $2,280,000
Other - Elementary and Secondary Education: $2,044,000
Other - Transit Utilities: $414,000
Other - General - Other: $177,000
- Local Intergovernmental - Education: $6,075,000
Education: $5,863,000
- Long Term Debt - Beginning Outstanding - Unspecified Public Purpose: $412,852,000
Beginning Outstanding - Unspecified Public Purpose: $392,621,000
Outstanding Unspecified Public Purpose: $384,954,000
Outstanding Unspecified Public Purpose: $376,722,000
Retired Unspecified Public Purpose: $36,130,000
Retired Unspecified Public Purpose: $33,822,000
Issue, Unspecified Public Purpose: $26,155,000
Beginning Outstanding - Public Debt for Private Purpose: $3,300,000
Outstanding Nonguaranteed - Industrial Revenue: $3,300,000
Beginning Outstanding - Public Debt for Private Purpose: $3,300,000
Outstanding Nonguaranteed - Industrial Revenue: $3,300,000
- Miscellaneous - General Revenue - Other: $5,404,000
Interest Earnings: $3,935,000
General Revenue - Other: $2,451,000
Donations From Private Sources: $1,448,000
Donations From Private Sources: $927,000
Interest Earnings: $787,000
Rents: $558,000
Fines and Forfeits: $531,000
Rents: $498,000
Fines and Forfeits: $384,000
Sale of Property: $178,000
Sale of Property: $144,000
Special Assessments: $44,000
Special Assessments: $32,000
- Other Capital Outlay - Regular Highways: $11,858,000
Elementary and Secondary Education: $7,018,000
Water Utilities: $5,486,000
Local Fire Protection: $5,455,000
Elementary and Secondary Education: $5,147,000
Police Protection: $3,207,000
Parks and Recreation: $943,000
Sewerage: $773,000
Financial Administration: $708,000
General Public Building: $361,000
Housing and Community Development: $276,000
Solid Waste Management: $255,000
General - Other: $102,000
Libraries: $67,000
Public Welfare - Other: $58,000
Central Staff Services: $20,000
Judicial and Legal Services: $9,000
Protective Inspection and Regulation - Other: $6,000
- Other Funds - Cash and Securities: $254,094,000
Cash and Securities: $203,147,000
- Revenue - Water Utilities: $24,439,000
Water Utilities: $24,331,000
- Short Term Debt Outstanding - End of Fiscal Year: $1,352,000
Beginning: $905,000
Beginning: $90,000
- Sinking Funds - Cash and Securities: $7,061,000
Cash and Securities: $3,300,000
- State Intergovernmental - Education: $164,066,000
Education: $151,060,000
General Local Government Support: $31,282,000
General Local Government Support: $20,045,000
Public Welfare: $15,517,000
Public Welfare: $14,623,000
Other: $8,925,000
Other: $7,204,000
Water Utilities: $23,000
- Tax - Property: $183,584,000
Property: $171,714,000
General Sales and Gross Receipts: $19,568,000
General Sales and Gross Receipts: $18,105,000
Other Selective Sales: $13,426,000
Other Selective Sales: $10,611,000
Occupation and Business License - Other: $9,461,000
Occupation and Business License - Other: $4,983,000
Other License: $4,882,000
Motor Fuels Sales: $4,272,000
Public Utilities Sales: $3,942,000
Documentary and Stock Transfer: $3,663,000
Public Utilities Sales: $3,327,000
Motor Vehicle License: $3,247,000
Motor Vehicle License: $3,129,000
Other: $1,003,000
Other License: $377,000
- Total Salaries and Wages: $162,934,000
: $148,449,000
- Water Utilities - Interest on Debt: $4,469,000
Interest on Debt: $2,698,000
Spotsylvania County government finances - Revenue in 2018:
- Bond Funds - Cash and Securities: $24,747,000
Cash and Securities: $24,591,000
- Charges - Sewerage: $17,828,000
Sewerage: $17,456,000
Other: $5,265,000
Elementary and Secondary Education School Lunch: $4,572,000
Elementary and Secondary Education School Lunch: $4,237,000
Other: $4,183,000
Solid Waste Management: $3,077,000
Solid Waste Management: $2,763,000
Parks and Recreation: $535,000
Elementary and Secondary Education School Tuition and Transportation: $391,000
Parks and Recreation: $360,000
Elementary and Secondary Education - Other: $242,000
Elementary and Secondary Education School Tuition and Transportation: $124,000
Elementary and Secondary Education - Other: $74,000
Regular Highways: $6,000
- Construction - Elementary and Secondary Education: $33,235,000
Elementary and Secondary Education: $17,579,000
General - Other: $17,175,000
Water Utilities: $4,186,000
Water Utilities: $4,138,000
Sewerage: $3,038,000
Sewerage: $2,298,000
General Public Buildings: $1,771,000
Police Protection: $753,000
Judicial and Legal Services: $664,000
General - Other: $565,000
Local Fire Protection: $244,000
Parks and Recreation: $201,000
- Current Operations - Elementary and Secondary Education: $277,831,000
Elementary and Secondary Education: $255,641,000
Public Welfare - Other: $26,518,000
Local Fire Protection: $26,245,000
Police Protection: $23,176,000
Local Fire Protection: $22,815,000
Police Protection: $21,568,000
Public Welfare - Other: $12,321,000
Public Welfare, Vendor Payments for Other Purposes: $12,277,000
Water Utilities: $11,609,000
Public Welfare, Vendor Payments for Other Purposes: $10,929,000
Water Utilities: $9,376,000
Sewerage: $9,347,000
Judicial and Legal Services: $9,069,000
General - Other: $8,996,000
Sewerage: $8,521,000
General - Other: $7,775,000
Correctional Institutions: $7,612,000
Financial Administration: $6,673,000
Correctional Institutions: $6,466,000
General Public Buildings: $6,379,000
Financial Administration: $6,327,000
Judicial and Legal Services: $5,640,000
Solid Waste Management: $5,631,000
Libraries: $5,023,000
General Public Buildings: $4,630,000
Central Staff Services: $4,618,000
Libraries: $4,435,000
Housing and Community Development: $4,362,000
Solid Waste Management: $3,864,000
Protective Inspection and Regulation - Other: $3,843,000
Central Staff Services: $3,786,000
Parks and Recreation: $3,695,000
Parks and Recreation: $3,438,000
Transit Utilities: $2,373,000
Regular Highways: $2,144,000
Protective Inspection and Regulation - Other: $2,132,000
Health - Other: $1,087,000
Health - Other: $634,000
Corrections - Other: $232,000
Natural Resources - Other: $153,000
Miscellaneous Commercial Activities - Other: $93,000
- Federal Intergovernmental - Other: $2,953,000
Other: $2,028,000
Education: $1,565,000
Education: $1,452,000
General Local Government Support: $25,000
- General - Interest on Debt: $4,676,000
Interest on Debt: $4,165,000
- Intergovernmental to Local - Other - Elementary and Secondary Education: $2,280,000
Other - Elementary and Secondary Education: $2,044,000
Other - Transit Utilities: $414,000
Other - General - Other: $177,000
- Local Intergovernmental - Education: $6,075,000
Education: $5,863,000
- Long Term Debt - Beginning Outstanding - Unspecified Public Purpose: $412,852,000
Beginning Outstanding - Unspecified Public Purpose: $392,621,000
Outstanding Unspecified Public Purpose: $384,954,000
Outstanding Unspecified Public Purpose: $376,722,000
Retired Unspecified Public Purpose: $36,130,000
Retired Unspecified Public Purpose: $33,822,000
Issue, Unspecified Public Purpose: $26,155,000
Beginning Outstanding - Public Debt for Private Purpose: $3,300,000
Outstanding Nonguaranteed - Industrial Revenue: $3,300,000
Beginning Outstanding - Public Debt for Private Purpose: $3,300,000
Outstanding Nonguaranteed - Industrial Revenue: $3,300,000
- Miscellaneous - General Revenue - Other: $5,404,000
Interest Earnings: $3,935,000
General Revenue - Other: $2,451,000
Donations From Private Sources: $1,448,000
Donations From Private Sources: $927,000
Interest Earnings: $787,000
Rents: $558,000
Fines and Forfeits: $531,000
Rents: $498,000
Fines and Forfeits: $384,000
Sale of Property: $178,000
Sale of Property: $144,000
Special Assessments: $44,000
Special Assessments: $32,000
- Other Capital Outlay - Regular Highways: $11,858,000
Elementary and Secondary Education: $7,018,000
Water Utilities: $5,486,000
Local Fire Protection: $5,455,000
Elementary and Secondary Education: $5,147,000
Police Protection: $3,207,000
Parks and Recreation: $943,000
Sewerage: $773,000
Financial Administration: $708,000
General Public Building: $361,000
Housing and Community Development: $276,000
Solid Waste Management: $255,000
General - Other: $102,000
Libraries: $67,000
Public Welfare - Other: $58,000
Central Staff Services: $20,000
Judicial and Legal Services: $9,000
Protective Inspection and Regulation - Other: $6,000
- Other Funds - Cash and Securities: $254,094,000
Cash and Securities: $203,147,000
- Revenue - Water Utilities: $24,439,000
Water Utilities: $24,331,000
- Short Term Debt Outstanding - End of Fiscal Year: $1,352,000
Beginning: $905,000
Beginning: $90,000
- Sinking Funds - Cash and Securities: $7,061,000
Cash and Securities: $3,300,000
- State Intergovernmental - Education: $164,066,000
Education: $151,060,000
General Local Government Support: $31,282,000
General Local Government Support: $20,045,000
Public Welfare: $15,517,000
Public Welfare: $14,623,000
Other: $8,925,000
Other: $7,204,000
Water Utilities: $23,000
- Tax - Property: $183,584,000
Property: $171,714,000
General Sales and Gross Receipts: $19,568,000
General Sales and Gross Receipts: $18,105,000
Other Selective Sales: $13,426,000
Other Selective Sales: $10,611,000
Occupation and Business License - Other: $9,461,000
Occupation and Business License - Other: $4,983,000
Other License: $4,882,000
Motor Fuels Sales: $4,272,000
Public Utilities Sales: $3,942,000
Documentary and Stock Transfer: $3,663,000
Public Utilities Sales: $3,327,000
Motor Vehicle License: $3,247,000
Motor Vehicle License: $3,129,000
Other: $1,003,000
Other License: $377,000
- Total Salaries and Wages: $162,934,000
: $148,449,000
- Water Utilities - Interest on Debt: $4,469,000
Interest on Debt: $2,698,000
Spotsylvania County government finances - Debt in 2018:
- Bond Funds - Cash and Securities: $24,747,000
Cash and Securities: $24,591,000
- Charges - Sewerage: $17,828,000
Sewerage: $17,456,000
Other: $5,265,000
Elementary and Secondary Education School Lunch: $4,572,000
Elementary and Secondary Education School Lunch: $4,237,000
Other: $4,183,000
Solid Waste Management: $3,077,000
Solid Waste Management: $2,763,000
Parks and Recreation: $535,000
Elementary and Secondary Education School Tuition and Transportation: $391,000
Parks and Recreation: $360,000
Elementary and Secondary Education - Other: $242,000
Elementary and Secondary Education School Tuition and Transportation: $124,000
Elementary and Secondary Education - Other: $74,000
Regular Highways: $6,000
- Construction - Elementary and Secondary Education: $33,235,000
Elementary and Secondary Education: $17,579,000
General - Other: $17,175,000
Water Utilities: $4,186,000
Water Utilities: $4,138,000
Sewerage: $3,038,000
Sewerage: $2,298,000
General Public Buildings: $1,771,000
Police Protection: $753,000
Judicial and Legal Services: $664,000
General - Other: $565,000
Local Fire Protection: $244,000
Parks and Recreation: $201,000
- Current Operations - Elementary and Secondary Education: $277,831,000
Elementary and Secondary Education: $255,641,000
Public Welfare - Other: $26,518,000
Local Fire Protection: $26,245,000
Police Protection: $23,176,000
Local Fire Protection: $22,815,000
Police Protection: $21,568,000
Public Welfare - Other: $12,321,000
Public Welfare, Vendor Payments for Other Purposes: $12,277,000
Water Utilities: $11,609,000
Public Welfare, Vendor Payments for Other Purposes: $10,929,000
Water Utilities: $9,376,000
Sewerage: $9,347,000
Judicial and Legal Services: $9,069,000
General - Other: $8,996,000
Sewerage: $8,521,000
General - Other: $7,775,000
Correctional Institutions: $7,612,000
Financial Administration: $6,673,000
Correctional Institutions: $6,466,000
General Public Buildings: $6,379,000
Financial Administration: $6,327,000
Judicial and Legal Services: $5,640,000
Solid Waste Management: $5,631,000
Libraries: $5,023,000
General Public Buildings: $4,630,000
Central Staff Services: $4,618,000
Libraries: $4,435,000
Housing and Community Development: $4,362,000
Solid Waste Management: $3,864,000
Protective Inspection and Regulation - Other: $3,843,000
Central Staff Services: $3,786,000
Parks and Recreation: $3,695,000
Parks and Recreation: $3,438,000
Transit Utilities: $2,373,000
Regular Highways: $2,144,000
Protective Inspection and Regulation - Other: $2,132,000
Health - Other: $1,087,000
Health - Other: $634,000
Corrections - Other: $232,000
Natural Resources - Other: $153,000
Miscellaneous Commercial Activities - Other: $93,000
- Federal Intergovernmental - Other: $2,953,000
Other: $2,028,000
Education: $1,565,000
Education: $1,452,000
General Local Government Support: $25,000
- General - Interest on Debt: $4,676,000
Interest on Debt: $4,165,000
- Intergovernmental to Local - Other - Elementary and Secondary Education: $2,280,000
Other - Elementary and Secondary Education: $2,044,000
Other - Transit Utilities: $414,000
Other - General - Other: $177,000
- Local Intergovernmental - Education: $6,075,000
Education: $5,863,000
- Long Term Debt - Beginning Outstanding - Unspecified Public Purpose: $412,852,000
Beginning Outstanding - Unspecified Public Purpose: $392,621,000
Outstanding Unspecified Public Purpose: $384,954,000
Outstanding Unspecified Public Purpose: $376,722,000
Retired Unspecified Public Purpose: $36,130,000
Retired Unspecified Public Purpose: $33,822,000
Issue, Unspecified Public Purpose: $26,155,000
Beginning Outstanding - Public Debt for Private Purpose: $3,300,000
Outstanding Nonguaranteed - Industrial Revenue: $3,300,000
Beginning Outstanding - Public Debt for Private Purpose: $3,300,000
Outstanding Nonguaranteed - Industrial Revenue: $3,300,000
- Miscellaneous - General Revenue - Other: $5,404,000
Interest Earnings: $3,935,000
General Revenue - Other: $2,451,000
Donations From Private Sources: $1,448,000
Donations From Private Sources: $927,000
Interest Earnings: $787,000
Rents: $558,000
Fines and Forfeits: $531,000
Rents: $498,000
Fines and Forfeits: $384,000
Sale of Property: $178,000
Sale of Property: $144,000
Special Assessments: $44,000
Special Assessments: $32,000
- Other Capital Outlay - Regular Highways: $11,858,000
Elementary and Secondary Education: $7,018,000
Water Utilities: $5,486,000
Local Fire Protection: $5,455,000
Elementary and Secondary Education: $5,147,000
Police Protection: $3,207,000
Parks and Recreation: $943,000
Sewerage: $773,000
Financial Administration: $708,000
General Public Building: $361,000
Housing and Community Development: $276,000
Solid Waste Management: $255,000
General - Other: $102,000
Libraries: $67,000
Public Welfare - Other: $58,000
Central Staff Services: $20,000
Judicial and Legal Services: $9,000
Protective Inspection and Regulation - Other: $6,000
- Other Funds - Cash and Securities: $254,094,000
Cash and Securities: $203,147,000
- Revenue - Water Utilities: $24,439,000
Water Utilities: $24,331,000
- Short Term Debt Outstanding - End of Fiscal Year: $1,352,000
Beginning: $905,000
Beginning: $90,000
- Sinking Funds - Cash and Securities: $7,061,000
Cash and Securities: $3,300,000
- State Intergovernmental - Education: $164,066,000
Education: $151,060,000
General Local Government Support: $31,282,000
General Local Government Support: $20,045,000
Public Welfare: $15,517,000
Public Welfare: $14,623,000
Other: $8,925,000
Other: $7,204,000
Water Utilities: $23,000
- Tax - Property: $183,584,000
Property: $171,714,000
General Sales and Gross Receipts: $19,568,000
General Sales and Gross Receipts: $18,105,000
Other Selective Sales: $13,426,000
Other Selective Sales: $10,611,000
Occupation and Business License - Other: $9,461,000
Occupation and Business License - Other: $4,983,000
Other License: $4,882,000
Motor Fuels Sales: $4,272,000
Public Utilities Sales: $3,942,000
Documentary and Stock Transfer: $3,663,000
Public Utilities Sales: $3,327,000
Motor Vehicle License: $3,247,000
Motor Vehicle License: $3,129,000
Other: $1,003,000
Other License: $377,000
- Total Salaries and Wages: $162,934,000
: $148,449,000
- Water Utilities - Interest on Debt: $4,469,000
Interest on Debt: $2,698,000
Spotsylvania County government finances - Cash and Securities in 2018:
- Bond Funds - Cash and Securities: $24,747,000
Cash and Securities: $24,591,000
- Charges - Sewerage: $17,828,000
Sewerage: $17,456,000
Other: $5,265,000
Elementary and Secondary Education School Lunch: $4,572,000
Elementary and Secondary Education School Lunch: $4,237,000
Other: $4,183,000
Solid Waste Management: $3,077,000
Solid Waste Management: $2,763,000
Parks and Recreation: $535,000
Elementary and Secondary Education School Tuition and Transportation: $391,000
Parks and Recreation: $360,000
Elementary and Secondary Education - Other: $242,000
Elementary and Secondary Education School Tuition and Transportation: $124,000
Elementary and Secondary Education - Other: $74,000
Regular Highways: $6,000
- Construction - Elementary and Secondary Education: $33,235,000
Elementary and Secondary Education: $17,579,000
General - Other: $17,175,000
Water Utilities: $4,186,000
Water Utilities: $4,138,000
Sewerage: $3,038,000
Sewerage: $2,298,000
General Public Buildings: $1,771,000
Police Protection: $753,000
Judicial and Legal Services: $664,000
General - Other: $565,000
Local Fire Protection: $244,000
Parks and Recreation: $201,000
- Current Operations - Elementary and Secondary Education: $277,831,000
Elementary and Secondary Education: $255,641,000
Public Welfare - Other: $26,518,000
Local Fire Protection: $26,245,000
Police Protection: $23,176,000
Local Fire Protection: $22,815,000
Police Protection: $21,568,000
Public Welfare - Other: $12,321,000
Public Welfare, Vendor Payments for Other Purposes: $12,277,000
Water Utilities: $11,609,000
Public Welfare, Vendor Payments for Other Purposes: $10,929,000
Water Utilities: $9,376,000
Sewerage: $9,347,000
Judicial and Legal Services: $9,069,000
General - Other: $8,996,000
Sewerage: $8,521,000
General - Other: $7,775,000
Correctional Institutions: $7,612,000
Financial Administration: $6,673,000
Correctional Institutions: $6,466,000
General Public Buildings: $6,379,000
Financial Administration: $6,327,000
Judicial and Legal Services: $5,640,000
Solid Waste Management: $5,631,000
Libraries: $5,023,000
General Public Buildings: $4,630,000
Central Staff Services: $4,618,000
Libraries: $4,435,000
Housing and Community Development: $4,362,000
Solid Waste Management: $3,864,000
Protective Inspection and Regulation - Other: $3,843,000
Central Staff Services: $3,786,000
Parks and Recreation: $3,695,000
Parks and Recreation: $3,438,000
Transit Utilities: $2,373,000
Regular Highways: $2,144,000
Protective Inspection and Regulation - Other: $2,132,000
Health - Other: $1,087,000
Health - Other: $634,000
Corrections - Other: $232,000
Natural Resources - Other: $153,000
Miscellaneous Commercial Activities - Other: $93,000
- Federal Intergovernmental - Other: $2,953,000
Other: $2,028,000
Education: $1,565,000
Education: $1,452,000
General Local Government Support: $25,000
- General - Interest on Debt: $4,676,000
Interest on Debt: $4,165,000
- Intergovernmental to Local - Other - Elementary and Secondary Education: $2,280,000
Other - Elementary and Secondary Education: $2,044,000
Other - Transit Utilities: $414,000
Other - General - Other: $177,000
- Local Intergovernmental - Education: $6,075,000
Education: $5,863,000
- Long Term Debt - Beginning Outstanding - Unspecified Public Purpose: $412,852,000
Beginning Outstanding - Unspecified Public Purpose: $392,621,000
Outstanding Unspecified Public Purpose: $384,954,000
Outstanding Unspecified Public Purpose: $376,722,000
Retired Unspecified Public Purpose: $36,130,000
Retired Unspecified Public Purpose: $33,822,000
Issue, Unspecified Public Purpose: $26,155,000
Beginning Outstanding - Public Debt for Private Purpose: $3,300,000
Outstanding Nonguaranteed - Industrial Revenue: $3,300,000
Beginning Outstanding - Public Debt for Private Purpose: $3,300,000
Outstanding Nonguaranteed - Industrial Revenue: $3,300,000
- Miscellaneous - General Revenue - Other: $5,404,000
Interest Earnings: $3,935,000
General Revenue - Other: $2,451,000
Donations From Private Sources: $1,448,000
Donations From Private Sources: $927,000
Interest Earnings: $787,000
Rents: $558,000
Fines and Forfeits: $531,000
Rents: $498,000
Fines and Forfeits: $384,000
Sale of Property: $178,000
Sale of Property: $144,000
Special Assessments: $44,000
Special Assessments: $32,000
- Other Capital Outlay - Regular Highways: $11,858,000
Elementary and Secondary Education: $7,018,000
Water Utilities: $5,486,000
Local Fire Protection: $5,455,000
Elementary and Secondary Education: $5,147,000
Police Protection: $3,207,000
Parks and Recreation: $943,000
Sewerage: $773,000
Financial Administration: $708,000
General Public Building: $361,000
Housing and Community Development: $276,000
Solid Waste Management: $255,000
General - Other: $102,000
Libraries: $67,000
Public Welfare - Other: $58,000
Central Staff Services: $20,000
Judicial and Legal Services: $9,000
Protective Inspection and Regulation - Other: $6,000
- Other Funds - Cash and Securities: $254,094,000
Cash and Securities: $203,147,000
- Revenue - Water Utilities: $24,439,000
Water Utilities: $24,331,000
- Short Term Debt Outstanding - End of Fiscal Year: $1,352,000
Beginning: $905,000
Beginning: $90,000
- Sinking Funds - Cash and Securities: $7,061,000
Cash and Securities: $3,300,000
- State Intergovernmental - Education: $164,066,000
Education: $151,060,000
General Local Government Support: $31,282,000
General Local Government Support: $20,045,000
Public Welfare: $15,517,000
Public Welfare: $14,623,000
Other: $8,925,000
Other: $7,204,000
Water Utilities: $23,000
- Tax - Property: $183,584,000
Property: $171,714,000
General Sales and Gross Receipts: $19,568,000
General Sales and Gross Receipts: $18,105,000
Other Selective Sales: $13,426,000
Other Selective Sales: $10,611,000
Occupation and Business License - Other: $9,461,000
Occupation and Business License - Other: $4,983,000
Other License: $4,882,000
Motor Fuels Sales: $4,272,000
Public Utilities Sales: $3,942,000
Documentary and Stock Transfer: $3,663,000
Public Utilities Sales: $3,327,000
Motor Vehicle License: $3,247,000
Motor Vehicle License: $3,129,000
Other: $1,003,000
Other License: $377,000
- Total Salaries and Wages: $162,934,000
: $148,449,000
- Water Utilities - Interest on Debt: $4,469,000
Interest on Debt: $2,698,000
Supplemental Security Income (SSI) in 2006:
- Total number of recipients: 926
- Number of aged recipients: 86
- Number of blind and disabled recipients: 840
- Number of recipients under 18: 205
- Number of recipients between 18 and 64: 559
- Number of recipients older than 64: 162
- Number of recipients also receiving OASDI: 303
- Amount of payments (thousands of dollars): 387
| Home Mortgage Disclosure Act Aggregated Statistics For Year 2009 (Based on 10 full tracts) | ||||||||||||||
| A) FHA, FSA/RHS & VA Home Purchase Loans | B) Conventional Home Purchase Loans | C) Refinancings | D) Home Improvement Loans | E) Loans on Dwellings For 5+ Families | F) Non-occupant Loans on < 5 Family Dwellings (A B C & D) | G) Loans On Manufactured Home Dwelling (A B C & D) | ||||||||
|---|---|---|---|---|---|---|---|---|---|---|---|---|---|---|
| Number | Average Value | Number | Average Value | Number | Average Value | Number | Average Value | Number | Average Value | Number | Average Value | Number | Average Value | |
| LOANS ORIGINATED | 1,269 | $211,757 | 583 | $204,763 | 2,680 | $235,002 | 138 | $78,051 | 2 | $7,294,000 | 325 | $233,108 | 47 | $116,553 |
| APPLICATIONS APPROVED, NOT ACCEPTED | 45 | $199,156 | 29 | $275,862 | 222 | $234,649 | 22 | $21,136 | 0 | $0 | 21 | $220,762 | 10 | $100,700 |
| APPLICATIONS DENIED | 165 | $222,376 | 80 | $210,862 | 1,229 | $254,180 | 108 | $81,694 | 0 | $0 | 80 | $202,962 | 44 | $96,068 |
| APPLICATIONS WITHDRAWN | 177 | $213,215 | 109 | $188,670 | 867 | $251,641 | 32 | $98,219 | 0 | $0 | 64 | $207,172 | 17 | $115,294 |
| FILES CLOSED FOR INCOMPLETENESS | 17 | $244,294 | 18 | $252,000 | 197 | $251,650 | 14 | $144,929 | 0 | $0 | 25 | $242,400 | 5 | $106,800 |
| Private Mortgage Insurance Companies Aggregated Statistics For Year 2009 (Based on 10 full tracts) | ||||||
| A) Conventional Home Purchase Loans | B) Refinancings | C) Non-occupant Loans on < 5 Family Dwellings (A & B) | ||||
|---|---|---|---|---|---|---|
| Number | Average Value | Number | Average Value | Number | Average Value | |
| LOANS ORIGINATED | 62 | $250,500 | 41 | $269,634 | 3 | $248,000 |
| APPLICATIONS APPROVED, NOT ACCEPTED | 18 | $323,500 | 12 | $315,750 | 2 | $224,500 |
| APPLICATIONS DENIED | 7 | $325,714 | 8 | $291,250 | 2 | $318,000 |
| APPLICATIONS WITHDRAWN | 4 | $286,000 | 9 | $298,667 | 0 | $0 |
| FILES CLOSED FOR INCOMPLETENESS | 1 | $302,000 | 1 | $161,000 | 0 | $0 |
| Most common first names in Spotsylvania County, VA among deceased individuals | ||
| Name | Count | Lived (average) |
|---|---|---|
| James | 111 | 72.2 years |
| John | 93 | 72.5 years |
| Mary | 83 | 77.7 years |
| William | 82 | 72.3 years |
| Robert | 55 | 69.3 years |
| Charles | 50 | 69.3 years |
| George | 47 | 69.4 years |
| Joseph | 31 | 73.6 years |
| Margaret | 30 | 79.0 years |
| Dorothy | 29 | 77.4 years |
| Most common last names in Spotsylvania County, VA among deceased individuals | ||
| Last name | Count | Lived (average) |
|---|---|---|
| Brooks | 60 | 72.5 years |
| Lewis | 41 | 73.3 years |
| Carter | 32 | 72.2 years |
| Williams | 32 | 71.3 years |
| Coleman | 29 | 72.4 years |
| Payne | 28 | 75.0 years |
| Brown | 26 | 72.5 years |
| Smith | 24 | 71.1 years |
| Wheeler | 23 | 77.7 years |
| Chewning | 22 | 79.7 years |
| Businesses in Spotsylvania County, VA | ||||
| Name | Count | Name | Count | |
|---|---|---|---|---|
| 7-Eleven | 7 | Home Depot | 1 | |
| ALDI | 1 | Hot Topic | 1 | |
| AMF Bowling | 1 | JCPenney | 1 | |
| AT&T | 3 | Jones New York | 1 | |
| Advance Auto Parts | 1 | Journeys | 1 | |
| Aeropostale | 1 | KFC | 1 | |
| American Eagle Outfitters | 1 | Kmart | 1 | |
| Applebee's | 1 | Kohl's | 1 | |
| Arby's | 1 | La-Z-Boy | 1 | |
| AutoZone | 1 | Lane Furniture | 1 | |
| Avenue | 1 | Little Caesars Pizza | 1 | |
| Baskin-Robbins | 1 | Lowe's | 1 | |
| Bath & Body Works | 1 | Macy's | 1 | |
| Bed Bath & Beyond | 1 | Marriott | 1 | |
| Burger King | 3 | MasterBrand Cabinets | 5 | |
| CVS | 4 | McDonald's | 2 | |
| Cache | 1 | Men's Wearhouse | 1 | |
| CarMax | 1 | Motherhood Maternity | 2 | |
| Casual Male XL | 1 | New Balance | 1 | |
| Charlotte Russe | 1 | New York & Co | 1 | |
| Chick-Fil-A | 3 | Nike | 4 | |
| Chipotle | 1 | Pac Sun | 1 | |
| Circle K | 1 | Panera Bread | 1 | |
| Cold Stone Creamery | 1 | Papa John's Pizza | 2 | |
| Coldwater Creek | 1 | Payless | 2 | |
| ColorTyme | 1 | PetSmart | 1 | |
| Comfort Inn | 1 | Popeyes | 1 | |
| Costco | 1 | Quiznos | 1 | |
| Cracker Barrel | 1 | RadioShack | 1 | |
| Cricket Wireless | 3 | Red Lobster | 1 | |
| Curves | 3 | Red Robin | 1 | |
| Dairy Queen | 1 | Rite Aid | 3 | |
| Deb | 1 | SAS Shoes | 1 | |
| Decora Cabinetry | 2 | SONIC Drive-In | 2 | |
| Dennys | 1 | Sears | 2 | |
| Domino's Pizza | 3 | Sephora | 1 | |
| DressBarn | 1 | Sleep Inn | 1 | |
| Dressbarn | 1 | Spencer Gifts | 1 | |
| Dunkin Donuts | 3 | Sprint Nextel | 3 | |
| Express | 1 | Starbucks | 3 | |
| Famous Footwear | 1 | Steak 'n Shake | 1 | |
| Fashion Bug | 1 | T-Mobile | 3 | |
| FedEx | 8 | Taco Bell | 1 | |
| Finish Line | 1 | Target | 1 | |
| Firestone Complete Auto Care | 2 | The Room Place | 1 | |
| Foot Locker | 1 | U-Haul | 2 | |
| GNC | 3 | UPS | 9 | |
| GameStop | 4 | Value City Furniture | 1 | |
| Giant | 2 | Vans | 2 | |
| Goodwill | 1 | Verizon Wireless | 2 | |
| Gymboree | 1 | Victoria's Secret | 1 | |
| H&R Block | 2 | Walgreens | 2 | |
| Hardee's | 1 | Walmart | 1 | |
| Holiday Inn | 1 | Wendy's | 2 | |
| Hollister Co. | 1 | YMCA | 1 | |
Spotsylvania County on our top lists:
- #23 on the list of "Top 101 counties with the largest number of children under 18 without health insurance coverage in 2000 (pop. 50,000+)"
- #62 on the list of "Top 101 counties with the lowest total withdrawal of fresh water for public supply (pop. 50,000+)"
- #87 on the list of "Top 101 counties with the lowest number of deaths per 1000 residents 2007-2013 (pop. 50,000+)"
- #90 on the list of "Top 101 counties with the largest number of children under 18 without health insurance coverage in 2000"