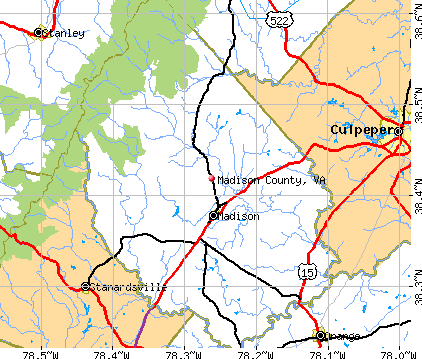
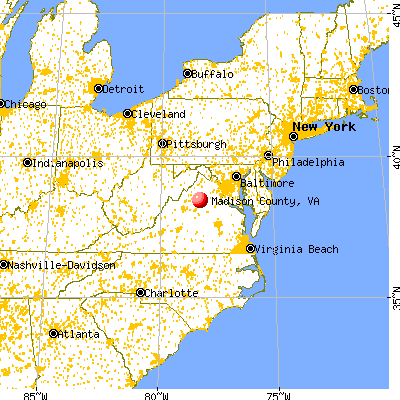
Madison County, Virginia (VA)
County owner-occupied free and clear houses and condos in 2010: 1,558
County owner-occupied houses and condos in 2000: 3,646
Renter-occupied apartments: 1,125 (it was 1,093 in 2000)
| % of renters here: | 23% |
| State: | 33% |
Land area: 321 sq. mi.
Water area: 0.4 sq. mi.
Population density: 43 people per square mile (average).
Industries providing employment: Educational, health and social services (23.6%), Retail trade (15.5%), Professional, scientific, management, administrative, and waste management services (13.2%).
Type of workers:
- Private wage or salary: 72%
- Government: 17%
- Self-employed, not incorporated: 12%
- Unpaid family work: 0%
- OSM Map
- General Map
- Google Map
- MSN Map

- 11,45883.1%White Non-Hispanic Alone
- 1,0827.9%Black Non-Hispanic Alone
- 6184.5%Two or more races
- 4973.6%Hispanic or Latino
- 920.7%Asian alone
- 290.2%Some other race alone
- 40.03%American Indian and Alaska Native alone

| Median resident age: | 47.0 years |
| Virginia median age: | 39.0 years |
| Males: 6,812 | |
| Females: 7,110 |

 | Does Madison County feel connected to DC? (12 replies) |
| McAuliffe is WAY TOO CORRUPT to be our next Governor (23 replies) |
| Define what makes up NOVA (28 replies) |
| Is This An Accurate Map of Virginia's Regions? (53 replies) |
| Buying property in "rural" Northern Virginia - what do I need to know? (13 replies) |
| Buying farm land (7 replies) |
| Madison County: | 2.0 people |
| Virginia: | 3 people |
Estimated median household income in 2022: $73,409 ($39,856 in 1999)
| This county: | $73,409 |
| Virginia: | $85,873 |
Median contract rent in 2022 for apartments: $817 (lower quartile is $588, upper quartile is $1,078)
| This county: | $817 |
| State: | $1270 |
Estimated median house or condo value in 2022: $335,243 (it was $111,800 in 2000)
| Madison: | $335,243 |
| Virginia: | $365,700 |
Mean price in 2022:
Median monthly housing costs for homes and condos with a mortgage: $1,525Detached houses: $520,137
Here: $520,137 State: $472,865 Townhouses or other attached units: $435,130
Here: $435,130 State: $457,437 Mobile homes: $151,107
Here: $151,107 State: $100,736
Median monthly housing costs for units without a mortgage: $440
Institutionalized population: 110
Crime in 2021 (reported by the sheriff's office or county police, not the county total):
- Murders: 1
- Rapes: 11
- Robberies: 0
- Assaults: 11
- Burglaries: 9
- Thefts: 52
- Auto thefts: 13
Crime in 2020 (reported by the sheriff's office or county police, not the county total):
- Murders: 1
- Rapes: 5
- Robberies: 0
- Assaults: 3
- Burglaries: 6
- Thefts: 56
- Auto thefts: 3
Single-family new house construction building permits:
- 2022: 61 buildings, average cost: $292,900
- 2021: 76 buildings, average cost: $374,800
- 2020: 42 buildings, average cost: $260,500
- 2019: 61 buildings, average cost: $228,400
- 2018: 60 buildings, average cost: $228,400
- 2017: 49 buildings, average cost: $286,700
- 2016: 44 buildings, average cost: $286,700
- 2015: 41 buildings, average cost: $250,600
- 2014: 31 buildings, average cost: $239,000
- 2013: 31 buildings, average cost: $230,200
- 2012: 28 buildings, average cost: $735,300
- 2011: 31 buildings, average cost: $16,400
- 2010: 27 buildings, average cost: $206,700
- 2009: 42 buildings, average cost: $166,100
- 2008: 45 buildings, average cost: $236,400
- 2007: 71 buildings, average cost: $211,600
- 2006: 96 buildings, average cost: $214,800
- 2005: 123 buildings, average cost: $213,200
- 2004: 112 buildings, average cost: $182,100
- 2003: 120 buildings, average cost: $171,900
- 2002: 105 buildings, average cost: $131,600
- 2001: 106 buildings, average cost: $123,600
- 2000: 106 buildings, average cost: $110,600
- 1999: 99 buildings, average cost: $127,500
- 1998: 89 buildings, average cost: $101,400
- 1997: 86 buildings, average cost: $109,200


Median real estate property taxes paid for housing units with mortgages in 2022: $1,901 (0.6%)
Median real estate property taxes paid for housing units with no mortgage in 2022: $1,941 (0.6%)


| Madison County: | 8.4% |
| Virginia: | 10.6% |
Median age of residents in 2022: 47.0 years old
(Males: 45.7 years old, Females: 47.8 years old)
(Median age for: White residents: 47.5 years old, Black residents: 48.1 years old, Asian residents: 23.1 years old, Hispanic or Latino residents: 37.7 years old, Other race residents: 27.1 years old)
Fair market rent in 2006 for a 1-bedroom apartment in Madison County is $475 a month.
Fair market rent for a 2-bedroom apartment is $574 a month.
Fair market rent for a 3-bedroom apartment is $794 a month.
Cities in this county include: Brightwood, Madison.
2023 air pollution in Madison County:
Ozone (1-hour): 0.043 ppm (standard limit: 0.12 ppm). Above U.S. average.
Particulate Matter (PM2.5) Annual: 7.0 µg/m3(standard limit: 15.0 µg/m3). Near U.S. average.
Neighboring counties: Wicomico County, Maryland  , Montrose County, Colorado
  , Kearny County, Kansas , Orange County, Indiana , Kenton County, Kentucky , Pettis County, Missouri , Warrick County, Indiana , Spotsylvania County
  , Nelson County, Kentucky .
| Here: | 2.0% |
| Virginia: | 2.7% |


Current college students: 374
People 25 years of age or older with a high school degree or higher: 87.0%
People 25 years of age or older with a bachelor's degree or higher: 24.5%
Number of foreign born residents: 515 (67.0% naturalized citizens)
| Madison County: | 3.7% |
| Whole state: | 12.7% |

- Year of entry for the foreign-born population
- 1922010 or later
- 582000 to 2009
- 1101990 to 1999
- 491980 to 1989
- 301970 to 1979
- 113Before 1970
Mean travel time to work (commute): minutes
Percentage of county residents living and working in this county: 98.3%
Housing units in structures:
- One, detached: 5,841
- One, attached: 51
- Two: 11
- 3 or 4: 21
- 5 to 9: 23
- 20 to 49: 47
- 50 or more: 22
- Mobile homes: 147
Housing units in Madison County with a mortgage: 2,751 (397 second mortgage, 0 home equity loan, 312 both second mortgage and home equity loan)
Houses without a mortgage: 332
| Here: | 0.6% with mortgage |
| State: | 97.2% with mortgage |
Religion statistics for Madison County
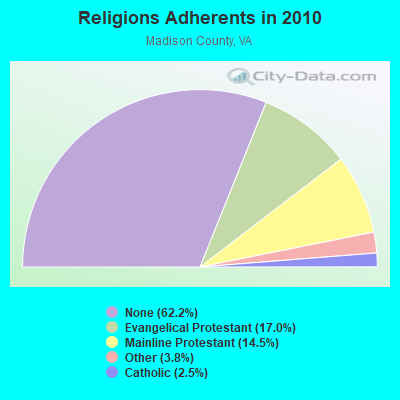
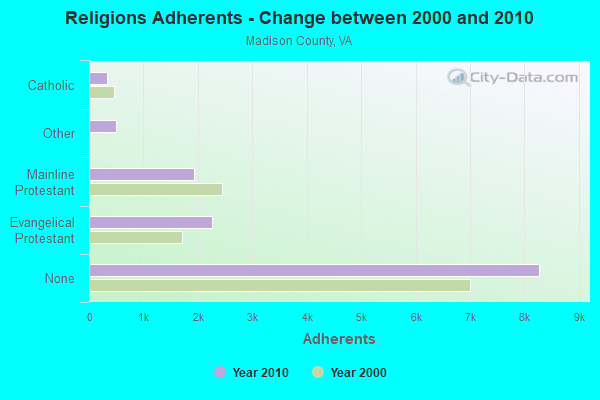
| Religion | Adherents | Congregations |
|---|---|---|
| Evangelical Protestant | 2,264 | 17 |
| Mainline Protestant | 1,927 | 17 |
| Other | 504 | 1 |
| Catholic | 337 | 1 |
| None | 8,276 | - |
Source: Clifford Grammich, Kirk Hadaway, Richard Houseal, Dale E.Jones, Alexei Krindatch, Richie Stanley and Richard H.Taylor. 2012. 2010 U.S.Religion Census: Religious Congregations & Membership Study. Association of Statisticians of American Religious Bodies. Jones, Dale E., et al. 2002. Congregations and Membership in the United States 2000. Nashville, TN: Glenmary Research Center.
Food Environment Statistics:
| Madison County: | 5.11 / 10,000 pop. |
| State: | 2.03 / 10,000 pop. |
| This county: | 1.46 / 10,000 pop. |
| Virginia: | 1.43 / 10,000 pop. |
| Madison County: | 5.11 / 10,000 pop. |
| Virginia: | 4.03 / 10,000 pop. |
| This county: | 2.92 / 10,000 pop. |
| State: | 7.65 / 10,000 pop. |
| Madison County: | 10.2% |
| Virginia: | 9.3% |
| Madison County: | 28.2% |
| State: | 26.7% |
| Here: | 22.9% |
| State: | 18.6% |
Agriculture in Madison County:
Average size of farms: 194 acresAverage value of agricultural products sold per farm: $33,954
Average value of crops sold per acre for harvested cropland: $113.78
The value of nursery, greenhouse, floriculture, and sod as a percentage of the total market value of agricultural products sold: 2.02%
The value of livestock, poultry, and their products as a percentage of the total market value of agricultural products sold: 81.64%
Average total farm production expenses per farm: $32,320
Harvested cropland as a percentage of land in farms: 28.28%
Average market value of all machinery and equipment per farm: $44,763
The percentage of farms operated by a family or individual: 92.09%
Average age of principal farm operators: 58 years
Average number of cattle and calves per 100 acres of all land in farms: 29.25
Milk cows as a percentage of all cattle and calves: 4.61%
Corn for grain: 4387 harvested acres
All wheat for grain: 706 harvested acres
Soybeans for beans: 2875 harvested acres
Vegetables: 38 harvested acres
Land in orchards: 373 acres
Earthquake activity:
Madison County-area historical earthquake activity is significantly above Virginia state average. It is 49% smaller than the overall U.S. average.On 8/23/2011 at 17:51:04, a magnitude 5.8 (5.8 MW, Depth: 3.7 mi, Class: Moderate, Intensity: VI - VII) earthquake occurred 39.4 miles away from Madison County center
On 8/25/2011 at 05:07:52, a magnitude 4.5 (4.5 ML, Depth: 4.2 mi, Class: Light, Intensity: IV - V) earthquake occurred 36.3 miles away from the county center
On 12/9/2003 at 20:59:18, a magnitude 4.5 (4.5 ML, Depth: 6.2 mi) earthquake occurred 45.4 miles away from the county center
On 12/9/2003 at 20:59:14, a magnitude 4.5 (4.5 MB, 4.5 LG) earthquake occurred 60.7 miles away from the county center
On 8/9/2020 at 12:07:37, a magnitude 5.1 (5.1 MW, Depth: 4.7 mi) earthquake occurred 205.4 miles away from Madison County center
On 9/25/1998 at 19:52:52, a magnitude 5.2 (4.8 MB, 4.3 MS, 5.2 LG, 4.5 MW, Depth: 3.1 mi) earthquake occurred 240.7 miles away from the county center
Magnitude types: regional Lg-wave magnitude (LG), body-wave magnitude (MB), local magnitude (ML), surface-wave magnitude (MS), moment magnitude (MW)
Most recent natural disasters:
- Virginia Covid-19 Pandemic, Incident Period: January 20, 2020, Major Disaster (Presidential) Declared DR-4512-VA: April 2, 2020, FEMA Id: 4512, Natural disaster type: Other
- Virginia Severe Winter Storm And Snowstorm, Incident Period: January 22, 2016 to January 23, 2016, Major Disaster (Presidential) Declared DR-4262: March 07, 2016, FEMA Id: 4262, Natural disaster type: Snowstorm, Winter Storm
- Virginia Hurricane Sandy, Incident Period: October 26, 2012 to November 01, 2012, Emergency Declared EM-3359: October 29, 2012, FEMA Id: 3359, Natural disaster type: Hurricane
- Virginia Severe Storms and Straight-line Winds, Incident Period: June 29, 2012 to July 01, 2012, Major Disaster (Presidential) Declared DR-4072: July 27, 2012, FEMA Id: 4072, Natural disaster type: Storm, Wind
- Virginia Severe Winter Storms and Snowstorms, Incident Period: February 05, 2010 to February 11, 2010, Major Disaster (Presidential) Declared DR-1905: April 27, 2010, FEMA Id: 1905, Natural disaster type: Snowstorm, Winter Storm
- Virginia Severe Winter Storm and Snowstorm, Incident Period: December 18, 2009 to December 20, 2009, Major Disaster (Presidential) Declared DR-1874: February 16, 2010, FEMA Id: 1874, Natural disaster type: Snowstorm, Winter Storm
- Virginia Hurricane Katrina Evacuation, Incident Period: August 29, 2005 to October 01, 2005, Emergency Declared EM-3240: September 12, 2005, FEMA Id: 3240, Natural disaster type: Hurricane
- Virginia Hurricane Isabel, Incident Period: September 18, 2003 to October 01, 2003, Major Disaster (Presidential) Declared DR-1491: September 18, 2003, FEMA Id: 1491, Natural disaster type: Hurricane
- Virginia Winter Storm, Incident Period: January 25, 2000 to January 30, 2000, Major Disaster (Presidential) Declared DR-1318: February 28, 2000, FEMA Id: 1318, Natural disaster type: Winter Storm
- Virginia Hurricane Fran, Incident Period: September 05, 1996 to September 23, 1996, Major Disaster (Presidential) Declared DR-1135: September 06, 1996, FEMA Id: 1135, Natural disaster type: Hurricane
- 8 other natural disasters have been reported since 1953.
The number of natural disasters in Madison County (18) is near the US average (15).
Major Disasters (Presidential) Declared: 14
Emergencies Declared: 4
Causes of natural disasters: Winter Storms: 6, Storms: 5, Hurricanes: 4, Floods: 3, Snowstorms: 3, Blizzard: 1, Drought: 1, Ice Storm: 1, Tropical Storm: 1, Wind: 1, Other: 1 (Note: some incidents may be assigned to more than one category).

Means of transportation to work:
- Drove a car alone: 3,253 (65.4%)
- Carpooled: 356 (7.2%)
- Bus: 18 (0.4%)
- Taxicab, motorcycle, or other means: 44 (0.9%)
- Walked: 178 (3.6%)
- Worked at home: 1,236 (24.8%)


- Health care and social assistance (20%)
- Retail trade (15%)
- Educational services (14%)
- Professional, scientific, and technical services (9%)
- Other services, except public administration (5%)
- Finance and insurance (5%)
- Public administration (3%)

- Health care and social assistance (25%)
- Retail trade (18%)
- Educational services (17%)
- Professional, scientific, and technical services (11%)
- Other services, except public administration (7%)
- Finance and insurance (6%)
- Public administration (4%)

- Management occupations (10%)
- Sales and related occupations (9%)
- Construction and extraction occupations (8%)
- Office and administrative support occupations (8%)
- Production occupations (7%)
- Building and grounds cleaning and maintenance occupations (6%)
- Law enforcement workers including supervisors (6%)

- Office and administrative support occupations (13%)
- Sales and related occupations (12%)
- Management occupations (10%)
- Healthcare support occupations (10%)
- Health diagnosing and treating practitioners and other technical occupations (8%)
- Business and financial operations occupations (8%)
- Material moving occupations (6%)

- Belarus (27%)
- Colombia (25%)
- Philippines (14%)
- Zimbabwe (10%)
- Scotland (7%)
- Switzerland (6%)
- United Kingdom, excluding England and Scotland (6%)

- American (23%)
- English (18%)
- German (11%)
- Irish (10%)
- Scottish (2%)
- European (2%)
- Scotch-Irish (1%)


People in group quarters in Madison County, Virginia in 2010:
- 107 people in nursing facilities/skilled-nursing facilities
- 62 people in workers' group living quarters and job corps centers
- 21 people in emergency and transitional shelters (with sleeping facilities) for people experiencing homelessness
- 3 people in correctional residential facilities
People in group quarters in Madison County, Virginia in 2000:
- 139 people in nursing homes
- 50 people in college dormitories (includes college quarters off campus)
- 30 people in other noninstitutional group quarters
6.74% of this county's 2021 resident taxpayers lived in other counties in 2020 ($77,315 average adjusted gross income)
| Here: | 6.74% |
| Virginia average: | 10.16% |
10 or fewer of this county's residents moved from foreign countries.
5.81% relocated from other counties in Virginia ($68,338 average AGI)
0.93% relocated from other states ($8,975 average AGI)
Madison County: 0.93% Virginia average: 3.91%

Top counties from which taxpayers relocated into this county between 2020 and 2021:
| from Culpeper County, VA | |
| from Orange County, VA | |
| from Fauquier County, VA | |
| from Prince William County, VA |
6.21% of this county's 2020 resident taxpayers moved to other counties in 2021 ($55,388 average adjusted gross income)
| Here: | 6.21% |
| Virginia average: | 10.20% |
10 or fewer of this county's residents moved to foreign countries.
4.87% relocated to other counties in Virginia ($39,474 average AGI)
1.34% relocated to other states ($15,917 average AGI)
Madison County: 1.34% Virginia average: 3.98%

Top counties to which taxpayers relocated from this county between 2020 and 2021:
| to Culpeper County, VA | |
| to Orange County, VA | |
| to Greene County, VA | |
| to Albemarle County, VA |
Births per 1000 population from 1990 to 1999: 11.3
Births per 1000 population from 2000 to 2006: 10.9

Deaths per 1000 population from 1990 to 1999: 9.8
Deaths per 1000 population from 2000 to 2009: 9.4
Deaths per 1000 population from 2010 to 2020: 11.2

Infant deaths per 1000 live births from 1990 to 1999: 5.5
Infant deaths per 1000 live births from 2000 to 2006: 5.0

Persons under 19 years old without health insurance coverage in 2018: 6.9%


Persons enrolled in hospital insurance and/or supplemental medical insurance (Medicare) in July 1, 2007: 2,182 (1,868 aged, 314 disabled)
Children under 18 without health insurance coverage in 2007: 484 (16%)


Most common underlying causes of death in Madison County, Virginia in 1999 - 2019:
- Unspecified dementia (71)
- Bronchus or lung, unspecified - Malignant neoplasms (69)
- Alzheimer disease, unspecified (22)
- Acute myocardial infarction, unspecified (20)
- Atherosclerotic heart disease (10)
- Chronic obstructive pulmonary disease, unspecified (10)
- Stroke, not specified as haemorrhage or infarction (10)
Population without health insurance coverage in 2000: 10%
Children under 18 without health insurance coverage in 2000: 6%
Medical specialist MDs per 100,000 population in 2005: 731
Dentists per 100,000 population in 1998: 7
Total births per 100,000 population, July 2005 - July 2006 : 24
Total deaths per 100,000 population, July 2005 - July 2006: 30
Beer, wine & liquor stores per 100,000 population in 2005: 1
Household type by relationship:
Households: 13,922- Male householders: 2,497 (694 living alone), Female householders: 2,976 (672 living alone)
2,937 spouses (2,937 opposite-sex spouses), 405 unmarried partners, (397 opposite-sex unmarried partners), 3,550 children (3,456 natural, 40 adopted, 58 stepchildren), 626 grandchildren, 112 brothers or sisters, 201 parents, 38 foster children, 158 other relatives, 168 non-relatives
- In group quarters: 242
Size of family households: 1,763 2-persons, 858 3-persons, 587 4-persons, 407 5-persons, 201 6-persons, 70 7-or-more-persons.
Size of nonfamily households: 1,366 1-person, 217 2-persons.
1,802 married couples with children.
462 single-parent households (131 men, 331 women).
96.5% of residents of Madison speak English at home.
1.6% of residents speak Spanish at home (70% speak English very well, 26% speak English well, 4% don't speak English at all).
1.4% of residents speak other Indo-European language at home (66% speak English very well, 34% speak English well).
0.5% of residents speak Asian or Pacific Island language at home (100% speak English very well).
In fiscal year 2004:
Federal Government expenditure: $64,216,000 ($4,889 per capita)
Department of Defense expenditure: $3,361,000
Federal direct payments to individuals for retirement and disability: $31,584,000
Federal other direct payments to individuals: $13,247,000
Federal direct payments not to individuals: $651,000
Federal grants: $11,142,000
Federal procurement contracts: $4,190,000 ($219,000 Department of Defense)
Federal salaries and wages: $3,403,000 ($0,000 Department of Defense)
Federal Government direct loans: $318,000
Federal guaranteed/insured loans: $5,678,000
Federal Government insurance: $8,033,000
Population change from April 1, 2000 to July 1, 2005:
Births: 721| Here: | 54 per 1000 residents |
| State: | 70 per 1000 residents |
Deaths: 680
| Here: | 51 per 1000 residents |
| State: | 40 per 1000 residents |
Net international migration: +44
| Here: | +3 per 1000 residents |
| State: | +18 per 1000 residents |
Net internal migration: +821
| Here: | +61 per 1000 residents |
| State: | +14 per 1000 residents |

Total withdrawal of fresh water for public supply: 0.02 millions of gallons per day (all from ground)
| Here: | 6.8 |
| State: | 7.0 |
| Here: | 5.3 |
| State: | 4.3 |

- Year house built in Madison County, Virginia
- 42020 or later
- 4752010 to 2019
- 1,0412000 to 2009
- 7731990 to 1999
- 7491980 to 1989
- 7531970 to 1979
- 4991960 to 1969
- 3321950 to 1959
- 3311940 to 1949
- 1,1501939 or earlier

- Rooms in owner-occupied houses in Madison County, Virginia
- 331 room
- 282 rooms
- 553 rooms
- 2554 rooms
- 8835 rooms
- 6886 rooms
- 7957 rooms
- 5948 rooms
- 1,0249+ rooms

- Rooms in renter-occupied apartments in Madison County, Virginia
- 291 room
- 02 rooms
- 913 rooms
- 924 rooms
- 3645 rooms
- 2146 rooms
- 1597 rooms
- 658 rooms
- 839+ rooms

- Bedrooms in owner-occupied houses in Madison County, Virginia
- 37no bedroom
- 391 bedroom
- 5952 bedrooms
- 2,5163 bedrooms
- 8664 bedrooms
- 3185+ bedrooms

- Bedrooms in renter-occupied apartments in Madison County, Virginia
- 30no bedroom
- 1241 bedroom
- 2882 bedrooms
- 4983 bedrooms
- 1404 bedrooms
- 315+ bedrooms

- Cars and other vehicles available in Madison County in owner-occupied houses/condos
- 72no vehicle
- 9451 vehicle
- 1,4452 vehicles
- 1,1583 vehicles
- 5744 vehicles
- 1535+ vehicles

- Cars and other vehicles available in Madison County in renter-occupied apartments
- 92no vehicle
- 4011 vehicle
- 4382 vehicles
- 1113 vehicles
- 524 vehicles
- 105+ vehicles
91.6% of Madison County residents lived in the same house 1 years ago.
Out of people who lived in different houses, 30% lived in this county.
Out of people who lived in different counties, 59% lived in Virginia.
| Madison County: | 91.6% |
| State average: | 86.6% |
Place of birth for U.S.-born residents:
- This state: 9,538
- Other state: 3,666
- Northeast: 1,230
- Midwest: 621
- South: 1,585
- West: 216


- 49.7%Electricity
- 20.5%Wood
- 16.0%Bottled, tank, or LP gas
- 8.6%Fuel oil, kerosene, etc.
- 3.7%Utility gas
- 0.9%No fuel used
- 0.6%Other fuel

- 55.3%Electricity
- 18.8%Fuel oil, kerosene, etc.
- 13.6%Wood
- 12.3%Bottled, tank, or LP gas
Private vs. public school enrollment:
| Here: | 23.6% |
| Virginia: | 13.2% |
| Here: | 7.0% |
| Virginia: | 10.2% |
| Here: | 32.4% |
| Virginia: | 18.7% |


Madison County government finances - Expenditure in 2017:
- Assistance and Subsidies - Public Welfare, Federal Categorical Assistance Programs: $789,000
Public Welfare, Cash Assistance Programs - Other: $212,000
- Charges - Other: $372,000
Elementary and Secondary Education School Lunch: $333,000
Parks and Recreation: $123,000
Solid Waste Management: $118,000
Elementary and Secondary Education School Tuition and Transportation: $2,000
Elementary and Secondary Education - Other: $1,000
- Current Operations - Elementary and Secondary Education: $20,440,000
Public Welfare, Vendor Payments for Other Purposes: $3,390,000
Police Protection: $2,500,000
Health - Other: $1,755,000
Public Welfare - Other: $1,179,000
Central Staff Services: $860,000
Correctional Institutions: $760,000
Financial Administration: $709,000
Judicial and Legal Services: $656,000
General Public Buildings: $592,000
General - Other: $475,000
Solid Waste Management: $446,000
Parks and Recreation: $308,000
Protective Inspection and Regulation - Other: $234,000
Local Fire Protection: $127,000
Libraries: $124,000
Corrections - Other: $68,000
- Federal Intergovernmental - General Local Government Support: $88,000
Education: $57,000
- Intergovernmental to Local - Other - Elementary and Secondary Education: $15,000
- Local Intergovernmental - Education: $521,000
- Long Term Debt - Beginning Outstanding - Unspecified Public Purpose: $12,483,000
Outstanding Unspecified Public Purpose: $11,513,000
Outstanding Nonguaranteed - Industrial Revenue: $10,474,000
Beginning Outstanding - Public Debt for Private Purpose: $10,474,000
Retired Unspecified Public Purpose: $970,000
- Miscellaneous - General Revenue - Other: $748,000
Fines and Forfeits: $170,000
Rents: $83,000
Donations From Private Sources: $78,000
Interest Earnings: $49,000
- Other Capital Outlay - Police Protection: $350,000
Elementary and Secondary Education: $292,000
General - Other: $107,000
Public Welfare - Other: $62,000
General Public Building: $49,000
Health - Other: $39,000
Parks and Recreation: $30,000
Judicial and Legal Services: $8,000
Financial Administration: $4,000
Corrections - Other: $3,000
Central Staff Services: $3,000
Protective Inspection and Regulation - Other: $1,000
- Other Funds - Cash and Securities: $12,887,000
- Sinking Funds - Cash and Securities: $10,474,000
- State Intergovernmental - Education: $10,978,000
Public Welfare: $3,865,000
General Local Government Support: $1,628,000
Other: $1,615,000
Health and Hospitals: $31,000
- Tax - Property: $15,224,000
General Sales and Gross Receipts: $1,957,000
Motor Vehicle License: $446,000
Other License: $223,000
Other: $158,000
Other Selective Sales: $105,000
Public Utilities Sales: $59,000
- Total Salaries and Wages: $12,137,000
Madison County government finances - Revenue in 2017:
- Assistance and Subsidies - Public Welfare, Federal Categorical Assistance Programs: $789,000
Public Welfare, Cash Assistance Programs - Other: $212,000
- Charges - Other: $372,000
Elementary and Secondary Education School Lunch: $333,000
Parks and Recreation: $123,000
Solid Waste Management: $118,000
Elementary and Secondary Education School Tuition and Transportation: $2,000
Elementary and Secondary Education - Other: $1,000
- Current Operations - Elementary and Secondary Education: $20,440,000
Public Welfare, Vendor Payments for Other Purposes: $3,390,000
Police Protection: $2,500,000
Health - Other: $1,755,000
Public Welfare - Other: $1,179,000
Central Staff Services: $860,000
Correctional Institutions: $760,000
Financial Administration: $709,000
Judicial and Legal Services: $656,000
General Public Buildings: $592,000
General - Other: $475,000
Solid Waste Management: $446,000
Parks and Recreation: $308,000
Protective Inspection and Regulation - Other: $234,000
Local Fire Protection: $127,000
Libraries: $124,000
Corrections - Other: $68,000
- Federal Intergovernmental - General Local Government Support: $88,000
Education: $57,000
- Intergovernmental to Local - Other - Elementary and Secondary Education: $15,000
- Local Intergovernmental - Education: $521,000
- Long Term Debt - Beginning Outstanding - Unspecified Public Purpose: $12,483,000
Outstanding Unspecified Public Purpose: $11,513,000
Outstanding Nonguaranteed - Industrial Revenue: $10,474,000
Beginning Outstanding - Public Debt for Private Purpose: $10,474,000
Retired Unspecified Public Purpose: $970,000
- Miscellaneous - General Revenue - Other: $748,000
Fines and Forfeits: $170,000
Rents: $83,000
Donations From Private Sources: $78,000
Interest Earnings: $49,000
- Other Capital Outlay - Police Protection: $350,000
Elementary and Secondary Education: $292,000
General - Other: $107,000
Public Welfare - Other: $62,000
General Public Building: $49,000
Health - Other: $39,000
Parks and Recreation: $30,000
Judicial and Legal Services: $8,000
Financial Administration: $4,000
Corrections - Other: $3,000
Central Staff Services: $3,000
Protective Inspection and Regulation - Other: $1,000
- Other Funds - Cash and Securities: $12,887,000
- Sinking Funds - Cash and Securities: $10,474,000
- State Intergovernmental - Education: $10,978,000
Public Welfare: $3,865,000
General Local Government Support: $1,628,000
Other: $1,615,000
Health and Hospitals: $31,000
- Tax - Property: $15,224,000
General Sales and Gross Receipts: $1,957,000
Motor Vehicle License: $446,000
Other License: $223,000
Other: $158,000
Other Selective Sales: $105,000
Public Utilities Sales: $59,000
- Total Salaries and Wages: $12,137,000
Madison County government finances - Debt in 2017:
- Assistance and Subsidies - Public Welfare, Federal Categorical Assistance Programs: $789,000
Public Welfare, Cash Assistance Programs - Other: $212,000
- Charges - Other: $372,000
Elementary and Secondary Education School Lunch: $333,000
Parks and Recreation: $123,000
Solid Waste Management: $118,000
Elementary and Secondary Education School Tuition and Transportation: $2,000
Elementary and Secondary Education - Other: $1,000
- Current Operations - Elementary and Secondary Education: $20,440,000
Public Welfare, Vendor Payments for Other Purposes: $3,390,000
Police Protection: $2,500,000
Health - Other: $1,755,000
Public Welfare - Other: $1,179,000
Central Staff Services: $860,000
Correctional Institutions: $760,000
Financial Administration: $709,000
Judicial and Legal Services: $656,000
General Public Buildings: $592,000
General - Other: $475,000
Solid Waste Management: $446,000
Parks and Recreation: $308,000
Protective Inspection and Regulation - Other: $234,000
Local Fire Protection: $127,000
Libraries: $124,000
Corrections - Other: $68,000
- Federal Intergovernmental - General Local Government Support: $88,000
Education: $57,000
- Intergovernmental to Local - Other - Elementary and Secondary Education: $15,000
- Local Intergovernmental - Education: $521,000
- Long Term Debt - Beginning Outstanding - Unspecified Public Purpose: $12,483,000
Outstanding Unspecified Public Purpose: $11,513,000
Outstanding Nonguaranteed - Industrial Revenue: $10,474,000
Beginning Outstanding - Public Debt for Private Purpose: $10,474,000
Retired Unspecified Public Purpose: $970,000
- Miscellaneous - General Revenue - Other: $748,000
Fines and Forfeits: $170,000
Rents: $83,000
Donations From Private Sources: $78,000
Interest Earnings: $49,000
- Other Capital Outlay - Police Protection: $350,000
Elementary and Secondary Education: $292,000
General - Other: $107,000
Public Welfare - Other: $62,000
General Public Building: $49,000
Health - Other: $39,000
Parks and Recreation: $30,000
Judicial and Legal Services: $8,000
Financial Administration: $4,000
Corrections - Other: $3,000
Central Staff Services: $3,000
Protective Inspection and Regulation - Other: $1,000
- Other Funds - Cash and Securities: $12,887,000
- Sinking Funds - Cash and Securities: $10,474,000
- State Intergovernmental - Education: $10,978,000
Public Welfare: $3,865,000
General Local Government Support: $1,628,000
Other: $1,615,000
Health and Hospitals: $31,000
- Tax - Property: $15,224,000
General Sales and Gross Receipts: $1,957,000
Motor Vehicle License: $446,000
Other License: $223,000
Other: $158,000
Other Selective Sales: $105,000
Public Utilities Sales: $59,000
- Total Salaries and Wages: $12,137,000
Madison County government finances - Cash and Securities in 2017:
- Assistance and Subsidies - Public Welfare, Federal Categorical Assistance Programs: $789,000
Public Welfare, Cash Assistance Programs - Other: $212,000
- Charges - Other: $372,000
Elementary and Secondary Education School Lunch: $333,000
Parks and Recreation: $123,000
Solid Waste Management: $118,000
Elementary and Secondary Education School Tuition and Transportation: $2,000
Elementary and Secondary Education - Other: $1,000
- Current Operations - Elementary and Secondary Education: $20,440,000
Public Welfare, Vendor Payments for Other Purposes: $3,390,000
Police Protection: $2,500,000
Health - Other: $1,755,000
Public Welfare - Other: $1,179,000
Central Staff Services: $860,000
Correctional Institutions: $760,000
Financial Administration: $709,000
Judicial and Legal Services: $656,000
General Public Buildings: $592,000
General - Other: $475,000
Solid Waste Management: $446,000
Parks and Recreation: $308,000
Protective Inspection and Regulation - Other: $234,000
Local Fire Protection: $127,000
Libraries: $124,000
Corrections - Other: $68,000
- Federal Intergovernmental - General Local Government Support: $88,000
Education: $57,000
- Intergovernmental to Local - Other - Elementary and Secondary Education: $15,000
- Local Intergovernmental - Education: $521,000
- Long Term Debt - Beginning Outstanding - Unspecified Public Purpose: $12,483,000
Outstanding Unspecified Public Purpose: $11,513,000
Outstanding Nonguaranteed - Industrial Revenue: $10,474,000
Beginning Outstanding - Public Debt for Private Purpose: $10,474,000
Retired Unspecified Public Purpose: $970,000
- Miscellaneous - General Revenue - Other: $748,000
Fines and Forfeits: $170,000
Rents: $83,000
Donations From Private Sources: $78,000
Interest Earnings: $49,000
- Other Capital Outlay - Police Protection: $350,000
Elementary and Secondary Education: $292,000
General - Other: $107,000
Public Welfare - Other: $62,000
General Public Building: $49,000
Health - Other: $39,000
Parks and Recreation: $30,000
Judicial and Legal Services: $8,000
Financial Administration: $4,000
Corrections - Other: $3,000
Central Staff Services: $3,000
Protective Inspection and Regulation - Other: $1,000
- Other Funds - Cash and Securities: $12,887,000
- Sinking Funds - Cash and Securities: $10,474,000
- State Intergovernmental - Education: $10,978,000
Public Welfare: $3,865,000
General Local Government Support: $1,628,000
Other: $1,615,000
Health and Hospitals: $31,000
- Tax - Property: $15,224,000
General Sales and Gross Receipts: $1,957,000
Motor Vehicle License: $446,000
Other License: $223,000
Other: $158,000
Other Selective Sales: $105,000
Public Utilities Sales: $59,000
- Total Salaries and Wages: $12,137,000
Supplemental Security Income (SSI) in 2006:
- Total number of recipients: 211
- Number of aged recipients: 44
- Number of blind and disabled recipients: 167
- Number of recipients under 18: 21
- Number of recipients between 18 and 64: 102
- Number of recipients older than 64: 88
- Number of recipients also receiving OASDI: 112
- Amount of payments (thousands of dollars): 75
| Most common first names in Madison County, VA among deceased individuals | ||
| Name | Count | Lived (average) |
|---|---|---|
| Mary | 49 | 77.9 years |
| John | 46 | 74.5 years |
| James | 44 | 72.7 years |
| Robert | 33 | 73.4 years |
| William | 26 | 71.9 years |
| Thomas | 22 | 80.4 years |
| Annie | 20 | 82.7 years |
| Charles | 14 | 75.6 years |
| Joseph | 14 | 75.3 years |
| George | 13 | 74.7 years |
| Most common last names in Madison County, VA among deceased individuals | ||
| Last name | Count | Lived (average) |
|---|---|---|
| Aylor | 34 | 80.3 years |
| Clore | 28 | 74.7 years |
| Smith | 26 | 81.7 years |
| Berry | 24 | 77.0 years |
| Utz | 21 | 79.6 years |
| Dodson | 21 | 69.5 years |
| Carpenter | 19 | 78.9 years |
| Taylor | 18 | 75.0 years |
| Jenkins | 18 | 80.8 years |
| Blankenbaker | 15 | 76.9 years |
| Businesses in Madison County, VA | ||||
| Name | Count | Name | Count | |
|---|---|---|---|---|
| 7-Eleven | 1 | McDonald's | 1 | |
| Decora Cabinetry | 2 | Nike | 1 | |
| FedEx | 1 | RadioShack | 1 | |
| Ford | 1 | Subway | 1 | |
| H&R Block | 1 | U-Haul | 1 | |
| MasterBrand Cabinets | 3 | |||
Madison County on our top lists:
- #20 on the list of "Top 101 counties with the highest Ozone (1-hour) air pollution readings in 2012 (ppm)"
- #20 on the list of "Top 101 counties with the lowest total withdrawal of fresh water for public supply"
- #50 on the list of "Top 101 counties with the lowest ground withdrawal of fresh water for public supply"