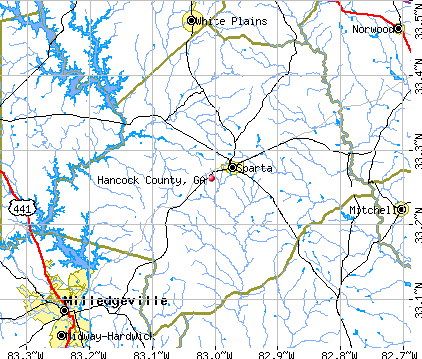
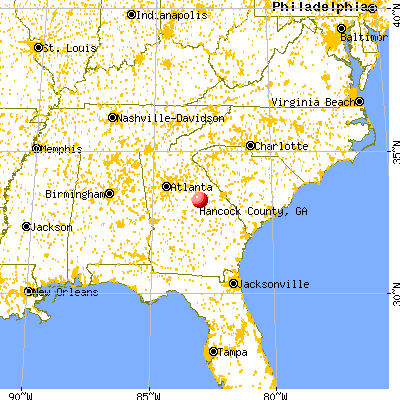
Hancock County, Georgia (GA)
County owner-occupied free and clear houses and condos in 2010: 1,251
County owner-occupied houses and condos in 2000: 2,475
Renter-occupied apartments: 825 (it was 762 in 2000)
| % of renters here: | 24% |
| State: | 34% |
Land area: 473 sq. mi.
Water area: 5.5 sq. mi.
Population density: 18 people per square mile (low).
Industries providing employment: Educational, health and social services (30.1%), Manufacturing (16.4%), Retail trade (15.2%), Transportation and warehousing,and utilities (13.5%).
Type of workers:
- Private wage or salary: 69%
- Government: 26%
- Self-employed, not incorporated: 6%
- Unpaid family work: 0%
- OSM Map
- General Map
- Google Map
- MSN Map

- 6,18371.5%Black Non-Hispanic Alone
- 2,16625.0%White Non-Hispanic Alone
- 1621.9%Two or more races
- 770.9%Asian alone
- 640.7%Hispanic or Latino

| Median resident age: | 46.5 years |
| Georgia median age: | 37.6 years |
| Males: 4,569 | |
| Females: 4,171 |

 | Georgia Republicans vote to suppress voters (98 replies) |
| Micropolitan Area Growth (6 replies) |
| Brian Kemp's approval rating stands at 39% weeks after he reopened Georgia (83 replies) |
| Historic Sparta, GA Courthouse burns (Hancock County) (18 replies) |
| Georgia tornado count by county (1950-2018) (1 reply) |
| Georgia Courthouses We Love (9 replies) |
| Hancock County: | 2.0 people |
| Georgia: | 3 people |
Estimated median household income in 2022: $32,426 ($22,003 in 1999)
| This county: | $32,426 |
| Georgia: | $72,837 |
Median contract rent in 2022 for apartments: $399 (lower quartile is $164, upper quartile is $584)
| This county: | $399 |
| State: | $1065 |
Estimated median house or condo value in 2022: $113,082 (it was $46,600 in 2000)
| Hancock: | $113,082 |
| Georgia: | $297,400 |
Median monthly housing costs for homes and condos with a mortgage: $1,495
Median monthly housing costs for units without a mortgage: $390
Institutionalized population: 1,469
Crime in 2021 (reported by the sheriff's office or county police, not the county total):
- Murders: 0
- Rapes: 1
- Robberies: 1
- Assaults: 8
- Burglaries: 8
- Thefts: 43
- Auto thefts: 6
Crime in 2020 (reported by the sheriff's office or county police, not the county total):
- Murders: 0
- Rapes: 4
- Robberies: 2
- Assaults: 10
- Burglaries: 5
- Thefts: 38
- Auto thefts: 5
Single-family new house construction building permits:
- 2022: 25 buildings, average cost: $238,900
- 2021: 31 buildings, average cost: $217,500
- 2020: 13 buildings, average cost: $209,100
- 2019: 14 buildings, average cost: $204,900
- 2018: 18 buildings, average cost: $195,200
- 2017: 15 buildings, average cost: $194,200
- 2016: 19 buildings, average cost: $133,000
- 2015: 16 buildings, average cost: $133,000
- 2014: 15 buildings, average cost: $133,000
- 2013: 16 buildings, average cost: $133,000
- 2012: 13 buildings, average cost: $133,000
- 2011: 12 buildings, average cost: $133,000
- 2010: 12 buildings, average cost: $133,000
- 2009: 0 buildings
- 2008: 32 buildings, average cost: $177,500
- 2007: 48 buildings, average cost: $170,500
- 2006: 72 buildings, average cost: $157,200
- 2005: 63 buildings, average cost: $148,500
- 2004: 69 buildings, average cost: $117,400
- 2003: 63 buildings, average cost: $117,400
- 2002: 58 buildings, average cost: $117,400
- 2001: 52 buildings, average cost: $117,400
- 2000: 37 buildings, average cost: $83,900
- 1999: 41 buildings, average cost: $83,900
- 1998: 39 buildings, average cost: $83,900
- 1997: 40 buildings, average cost: $83,900


Median real estate property taxes paid for housing units with mortgages in 2022: $1,416 (0.7%)
Median real estate property taxes paid for housing units with no mortgage in 2022: $960 (1.0%)


| Hancock County: | 25.7% |
| Georgia: | 12.7% |
Median age of residents in 2022: 46.5 years old
(Males: 45.0 years old, Females: 51.9 years old)
(Median age for: White residents: 58.9 years old, Black residents: 42.7 years old, Asian residents: 61.4 years old, Hispanic or Latino residents: 36.5 years old, Other race residents: 35.2 years old)
Fair market rent in 2006 for a 1-bedroom apartment in Hancock County is $397 a month.
Fair market rent for a 2-bedroom apartment is $458 a month.
Fair market rent for a 3-bedroom apartment is $575 a month.
Cities in this county include: Devereux, Sparta, Linton, Mayfield.
Neighboring counties: Bamberg County, South Carolina  , Bryan County, Oklahoma
  , East Carroll Parish, Louisiana , Morehouse Parish, Louisiana , Jefferson County, Alabama , Walker County, Alabama , Titus County, Texas .
| Here: | 5.4% |
| Georgia: | 2.9% |


Current college students: 330
People 25 years of age or older with a high school degree or higher: 75.1%
People 25 years of age or older with a bachelor's degree or higher: 9.6%
Number of foreign born residents: 121 (49.8% naturalized citizens)
| Hancock County: | 1.4% |
| Whole state: | 10.7% |

- Year of entry for the foreign-born population
- 522010 or later
- 192000 to 2009
- 201990 to 1999
- 21980 to 1989
- 31970 to 1979
- 22Before 1970
Mean travel time to work (commute): $ minutes
Percentage of county residents living and working in this county: 100.1%

Housing units in structures:
- One, detached: 2,644
- One, attached: 60
- Two: 71
- 3 or 4: 44
- 5 to 9: 25
- 10 to 19: 23
- 20 to 49: 129
- 50 or more: 5
- Mobile homes: 2,030
Housing units in Hancock County with a mortgage: 869 (17 second mortgage, 0 home equity loan, 18 both second mortgage and home equity loan)
Houses without a mortgage: 46
| Here: | 95.0% with mortgage |
| State: | 98.2% with mortgage |
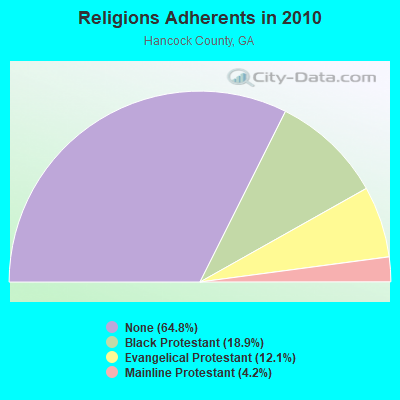
Religion statistics for Hancock County
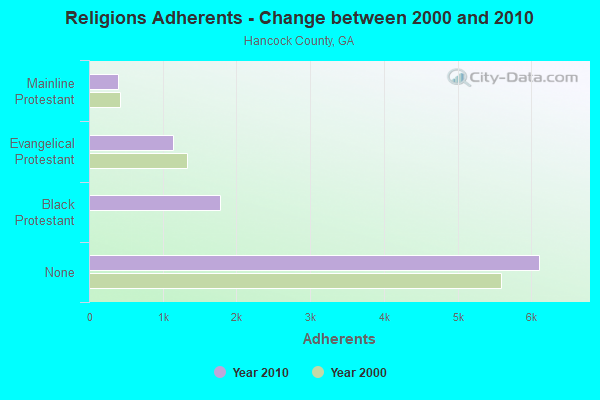
| Religion | Adherents | Congregations |
|---|---|---|
| Black Protestant | 1,779 | 12 |
| Evangelical Protestant | 1,139 | 13 |
| Mainline Protestant | 397 | 6 |
| Other | 6 | 1 |
| None | 6,108 | - |
Source: Clifford Grammich, Kirk Hadaway, Richard Houseal, Dale E.Jones, Alexei Krindatch, Richie Stanley and Richard H.Taylor. 2012. 2010 U.S.Religion Census: Religious Congregations & Membership Study. Association of Statisticians of American Religious Bodies. Jones, Dale E., et al. 2002. Congregations and Membership in the United States 2000. Nashville, TN: Glenmary Research Center.
Food Environment Statistics:
| Hancock County: | 1.05 / 10,000 pop. |
| State: | 1.91 / 10,000 pop. |
| This county: | 1.05 / 10,000 pop. |
| Georgia: | 0.86 / 10,000 pop. |
| Hancock County: | 7.32 / 10,000 pop. |
| Georgia: | 5.12 / 10,000 pop. |
| Hancock County: | 13.9% |
| Georgia: | 10.4% |
| Hancock County: | 34.7% |
| State: | 27.8% |
| Here: | 13.1% |
| State: | 14.6% |
Agriculture in Hancock County:
Average size of farms: 293 acresAverage value of agricultural products sold per farm: $10,762
Average value of crops sold per acre for harvested cropland: $73.58
The value of nursery, greenhouse, floriculture, and sod as a percentage of the total market value of agricultural products sold: 0.00%
The value of livestock, poultry, and their products as a percentage of the total market value of agricultural products sold: 83.43%
Average total farm production expenses per farm: $20,151
Harvested cropland as a percentage of land in farms: 8.27%
Irrigated harvested cropland as a percentage of land in farms: 8.77%
Average market value of all machinery and equipment per farm: $26,301
The percentage of farms operated by a family or individual: 88.89%
Average age of principal farm operators: 58 years
Average number of cattle and calves per 100 acres of all land in farms: 8.69
Vegetables: 18 harvested acres
Land in orchards: 421 acres
Earthquake activity:
Hancock County-area historical earthquake activity is significantly above Georgia state average. It is 4% greater than the overall U.S. average.On 8/2/1974 at 08:52:09, a magnitude 4.9 (4.3 MB, 4.9 LG, Class: Light, Intensity: IV - V) earthquake occurred 51.8 miles away from Hancock County center
On 4/29/2003 at 08:59:39, a magnitude 4.9 (4.4 MB, 4.6 MW, 4.9 LG) earthquake occurred 173.1 miles away from the county center
On 11/22/1974 at 05:25:55, a magnitude 4.7 (4.7 MB) earthquake occurred 167.7 miles away from the county center
On 8/9/2020 at 12:07:37, a magnitude 5.1 (5.1 MW, Depth: 4.7 mi, Class: Moderate, Intensity: VI - VII) earthquake occurred 247.5 miles away from the county center
On 11/30/1973 at 07:48:41, a magnitude 4.7 (4.7 MB, 4.6 ML) earthquake occurred 183.8 miles away from Hancock County center
On 2/15/2014 at 03:23:38, a magnitude 4.1 (4.1 MW, Depth: 3.2 mi) earthquake occurred 65.3 miles away from the county center
Magnitude types: regional Lg-wave magnitude (LG), body-wave magnitude (MB), local magnitude (ML), moment magnitude (MW)
Most recent natural disasters:
- Georgia Covid-19 Pandemic, Incident Period: January 20, 2020, FEMA Id: 4501, Natural disaster type: Other
- Georgia Hurricane Michael, Incident Period: October 9, 2018 - October 23, 2018, Major Disaster (Presidential) Declared DR-4400-GA: October 14, 2018, FEMA Id: 4400, Natural disaster type: Hurricane
- Georgia Severe Winter Storm, Incident Period: February 10, 2014 to February 14, 2014, Emergency Declared EM-3368: February 11, 2014, FEMA Id: 3368, Natural disaster type: Winter Storm
- Georgia Severe Winter Storm, Incident Period: February 10, 2014 to February 15, 2014, Major Disaster (Presidential) Declared DR-4165: March 06, 2014, FEMA Id: 4165, Natural disaster type: Winter Storm
- Georgia Severe Storms and Tornadoes, Incident Period: March 01, 2007 to March 02, 2007, Major Disaster (Presidential) Declared DR-1686: March 03, 2007, FEMA Id: 1686, Natural disaster type: Storm, Tornado
- Georgia Hurricane Katrina Evacuation, Incident Period: August 27, 2005 to October 01, 2005, Emergency Declared EM-3218: September 05, 2005, FEMA Id: 3218, Natural disaster type: Hurricane
- Georgia Drought, Incident Period: July 20, 1977, Emergency Declared EM-3044: July 20, 1977, FEMA Id: 3044, Natural disaster type: Drought
The number of natural disasters in Hancock County (7) is smaller than the US average (15).
Major Disasters (Presidential) Declared: 3
Emergencies Declared: 3

Means of transportation to work:
- Drove a car alone: 1,236 (67.2%)
- Carpooled: 93 (5.1%)
- Taxicab, motorcycle, or other means: 311 (16.9%)
- Walked: 17 (0.9%)
- Worked at home: 160 (8.7%)


- Health care and social assistance (41%)
- Educational services (20%)
- Retail trade (18%)
- Public administration (11%)
- Manufacturing (10%)
- Transportation and warehousing (9%)
- Accommodation and food services (3%)

- Health care and social assistance (33%)
- Educational services (16%)
- Retail trade (15%)
- Public administration (9%)
- Manufacturing (8%)
- Transportation and warehousing (8%)
- Accommodation and food services (3%)

- Production occupations (22%)
- Transportation occupations (16%)
- Office and administrative support occupations (16%)
- Construction and extraction occupations (13%)
- Material moving occupations (9%)
- Building and grounds cleaning and maintenance occupations (8%)
- Installation, maintenance, and repair occupations (4%)

- Management occupations (14%)
- Office and administrative support occupations (13%)
- Health technologists and technicians (9%)
- Personal care and service occupations (9%)
- Food preparation and serving related occupations (9%)
- Sales and related occupations (8%)
- Healthcare support occupations (7%)

- Mexico (37%)
- India (33%)
- Canada (12%)
- Korea (6%)
- Vietnam (3%)
- Guatemala (3%)
- Sweden (0%)

- American (7%)
- Irish (5%)
- English (5%)
- Scottish (1%)
- Scotch-Irish (1%)
- German (1%)
- French (except Basque) (0%)


People in group quarters in Hancock County, Georgia in 2010:
- 1,329 people in state prisons
- 112 people in nursing facilities/skilled-nursing facilities
- 28 people in local jails and other municipal confinement facilities
- 2 people in workers' group living quarters and job corps centers
People in group quarters in Hancock County, Georgia in 2000:
- 1,351 people in state prisons
- 84 people in nursing homes
- 16 people in local jails and other confinement facilities (including police lockups)
- 12 people in other noninstitutional group quarters
7.20% of this county's 2021 resident taxpayers lived in other counties in 2020 ($59,171 average adjusted gross income)
| Here: | 7.20% |
| Georgia average: | 10.21% |
10 or fewer of this county's residents moved from foreign countries.
6.16% relocated from other counties in Georgia ($52,053 average AGI)
1.04% relocated from other states ($7,123 average AGI)
Hancock County: 1.04% Georgia average: 3.80%

Top counties from which taxpayers relocated into this county between 2020 and 2021:
| from Baldwin County, GA |
6.44% of this county's 2020 resident taxpayers moved to other counties in 2021 ($39,819 average adjusted gross income)
| Here: | 6.44% |
| Georgia average: | 9.60% |
10 or fewer of this county's residents moved to foreign countries.
6.44% relocated to other counties in Georgia ($39,819 average AGI)
10 or fewer of this county's residents relocated to other states.

Top counties to which taxpayers relocated from this county between 2020 and 2021:
| to Baldwin County, GA |
Births per 1000 population from 1990 to 1999: 14.6
Births per 1000 population from 2000 to 2006: 11.9

Deaths per 1000 population from 1990 to 1999: 10.6
Deaths per 1000 population from 2000 to 2009: 10.7
Deaths per 1000 population from 2010 to 2020: 12.1

Infant deaths per 1000 live births from 1990 to 1999: 16.5
Infant deaths per 1000 live births from 2000 to 2006: 19.8

Persons under 19 years old without health insurance coverage in 2018: 5.6%


Persons enrolled in hospital insurance and/or supplemental medical insurance (Medicare) in July 1, 2007: 1,713 (1,262 aged, 451 disabled)
Children under 18 without health insurance coverage in 2007: 145 (7%)


Most common underlying causes of death in Hancock County, Georgia in 1999 - 2019:
- Cardiac arrest, unspecified (195)
- Bronchus or lung, unspecified - Malignant neoplasms (21)
Population without health insurance coverage in 2000: 19%
Children under 18 without health insurance coverage in 2000: 14%
Medical specialist MDs per 100,000 population in 2005: 1,130
Dentists per 100,000 population in 1998: 10
Total deaths per 100,000 population, July 2005 - July 2006: 62
EPA green book nonattainment status in 2004-2006: 1
Crimes per 100,000 population in 1996: 1
Household type by relationship:
Households: 8,740- Male householders: 1,054 (330 living alone), Female householders: 1,842 (721 living alone)
1,118 spouses (1,090 opposite-sex spouses), 122 unmarried partners, (122 opposite-sex unmarried partners), 2,112 children (1,967 natural, 71 adopted, 73 stepchildren), 343 grandchildren, 154 brothers or sisters, 65 parents, 0 foster children, 330 other relatives, 72 non-relatives
- In group quarters: 1,526
Size of family households: 918 2-persons, 525 3-persons, 140 4-persons, 100 5-persons, 48 6-persons.
Size of nonfamily households: 1,046 1-person, 103 2-persons.
307 married couples with children.
516 single-parent households (0 men, 516 women).
97.5% of residents of Hancock speak English at home.
1.7% of residents speak Spanish at home (68% speak English very well, 22% speak English well, 10% speak English not well).
0.9% of residents speak other Indo-European language at home (51% speak English very well, 49% speak English not well).
0.1% of residents speak Asian or Pacific Island language at home (100% speak English well).
In fiscal year 2004:
Federal Government expenditure: $82,148,000 ($8,373 per capita)
Department of Defense expenditure: $1,100,000
Federal direct payments to individuals for retirement and disability: $31,970,000
Federal other direct payments to individuals: $19,976,000
Federal direct payments not to individuals: $108,000
Federal grants: $28,903,000
Federal procurement contracts: $248,000 ($0,000 Department of Defense)
Federal salaries and wages: $943,000 ($0,000 Department of Defense)
Federal Government direct loans: $39,000
Federal guaranteed/insured loans: $877,000
Federal Government insurance: $4,000
Population change from April 1, 2000 to July 1, 2005:
Births: 650| Here: | 67 per 1000 residents |
| State: | 79 per 1000 residents |
Deaths: 562
| Here: | 58 per 1000 residents |
| State: | 38 per 1000 residents |
Net international migration: -1
| Here: | |
| State: |
Net internal migration: -498
| Here: | |
| State: |

Total withdrawal of fresh water for public supply: 0.79 millions of gallons per day (9% from ground, 91% from surface)
| Here: | 6.1 |
| State: | 6.8 |
| Here: | 4.6 |
| State: | 4.6 |

- Year house built in Hancock County, Georgia
- 332020 or later
- 3682010 to 2019
- 7412000 to 2009
- 1,3881990 to 1999
- 8361980 to 1989
- 5891970 to 1979
- 3001960 to 1969
- 2101950 to 1959
- 1371940 to 1949
- 2571939 or earlier

- Rooms in owner-occupied houses in Hancock County, Georgia
- 01 room
- 02 rooms
- 1143 rooms
- 1374 rooms
- 6045 rooms
- 4736 rooms
- 3647 rooms
- 2488 rooms
- 2569+ rooms

- Rooms in renter-occupied apartments in Hancock County, Georgia
- 551 room
- 212 rooms
- 813 rooms
- 1674 rooms
- 1705 rooms
- 1306 rooms
- 497 rooms
- 88 rooms
- 149+ rooms

- Bedrooms in owner-occupied houses in Hancock County, Georgia
- 0no bedroom
- 241 bedroom
- 3272 bedrooms
- 1,2893 bedrooms
- 5024 bedrooms
- 375+ bedrooms

- Bedrooms in renter-occupied apartments in Hancock County, Georgia
- 56no bedroom
- 831 bedroom
- 1532 bedrooms
- 3673 bedrooms
- 424 bedrooms
- 05+ bedrooms

- Cars and other vehicles available in Hancock County in owner-occupied houses/condos
- 150no vehicle
- 6471 vehicle
- 5762 vehicles
- 5733 vehicles
- 1364 vehicles
- 1145+ vehicles

- Cars and other vehicles available in Hancock County in renter-occupied apartments
- 185no vehicle
- 3041 vehicle
- 2062 vehicles
- 03 vehicles
- 04 vehicles
- 05+ vehicles
92.4% of Hancock County residents lived in the same house 1 years ago.
Out of people who lived in different houses, 10% lived in this county.
Out of people who lived in different counties, 90% lived in Georgia.
| Hancock County: | 92.4% |
| State average: | 86.6% |
Place of birth for U.S.-born residents:
- This state: 6,470
- Other state: 2,076
- Northeast: 812
- Midwest: 318
- South: 826
- West: 104


- 54.7%Electricity
- 33.3%Bottled, tank, or LP gas
- 6.6%Utility gas
- 2.7%No fuel used
- 2.7%Wood

- 47.0%Electricity
- 28.9%Bottled, tank, or LP gas
- 24.1%Utility gas
Private vs. public school enrollment:
| Here: | 3.5% |
| Georgia: | 12.1% |
| Here: | 3.1% |
| Georgia: | 10.8% |
| Here: | 18.4% |
| Georgia: | 17.1% |


Hancock County government finances - Expenditure in 2017:
- Charges - Other: $312,000
Other: $126,000
Sewerage: $94,000
Sewerage: $90,000
Regular Highways: $11,000
Parks and Recreation: $8,000
Regular Highways: $7,000
Parks and Recreation: $5,000
- Construction - General Public Buildings: $3,081,000
Health - Other: $562,000
General Public Buildings: $100,000
Regular Highways: $2,000
- Current Operations - Regular Highways: $2,685,000
Regular Highways: $2,267,000
General - Other: $1,581,000
Central Staff Services: $1,148,000
Financial Administration: $949,000
Correctional Institutions: $907,000
Police Protection: $874,000
Correctional Institutions: $851,000
General - Other: $834,000
Police Protection: $817,000
Judicial and Legal Services: $797,000
Judicial and Legal Services: $776,000
Financial Administration: $602,000
General Public Buildings: $599,000
Solid Waste Management: $570,000
General Public Buildings: $548,000
Health - Other: $533,000
Public Welfare - Other: $520,000
Central Staff Services: $509,000
Health - Other: $504,000
Solid Waste Management: $489,000
Parks and Recreation: $228,000
Parks and Recreation: $210,000
Libraries: $144,000
Local Fire Protection: $131,000
Libraries: $125,000
Local Fire Protection: $112,000
Natural Resources - Other: $57,000
Natural Resources - Other: $30,000
- General - Interest on Debt: $206,000
Interest on Debt: $195,000
- Local Intergovernmental - Other: $37,000
- Long Term Debt - Beginning Outstanding - Unspecified Public Purpose: $4,641,000
Outstanding Unspecified Public Purpose: $4,161,000
Beginning Outstanding - Unspecified Public Purpose: $3,395,000
Outstanding Unspecified Public Purpose: $3,149,000
Retired Unspecified Public Purpose: $524,000
Retired Unspecified Public Purpose: $246,000
Issue, Unspecified Public Purpose: $44,000
- Miscellaneous - General Revenue - Other: $1,396,000
Fines and Forfeits: $295,000
Fines and Forfeits: $282,000
General Revenue - Other: $47,000
Sale of Property: $34,000
Rents: $31,000
Rents: $30,000
Sale of Property: $15,000
Interest Earnings: $3,000
Interest Earnings: $2,000
Donations From Private Sources: $1,000
- Other Capital Outlay - Regular Highways: $456,000
Regular Highways: $179,000
Police Protection: $99,000
Financial Administration: $85,000
Public Welfare - Other: $41,000
Local Fire Protection: $39,000
Judicial and Legal Services: $20,000
Judicial and Legal Services: $12,000
Correctional Institutions: $10,000
Correctional Institutions: $10,000
General - Other: $4,000
- Other Funds - Cash and Securities: $1,603,000
Cash and Securities: $1,069,000
- Revenue - Water Utilities: $141,000
Water Utilities: $135,000
Transit Utilities: $98,000
- Sinking Funds - Cash and Securities: $1,012,000
- State Intergovernmental - Other: $738,000
Other: $707,000
Housing and Community Development: $609,000
Public Welfare: $325,000
General Local Government Support: $20,000
General Local Government Support: $13,000
- Tax - Property: $6,439,000
Property: $6,437,000
General Sales and Gross Receipts: $1,950,000
General Sales and Gross Receipts: $1,708,000
Insurance Premiums Sales: $553,000
Other: $450,000
Insurance Premiums Sales: $447,000
Other: $121,000
Other License: $72,000
Other License: $32,000
Alcoholic Beverage Sales: $22,000
Alcoholic Beverage Sales: $18,000
Occupation and Business License - Other: $10,000
Occupation and Business License - Other: $9,000
Alcoholic Beverage License: $3,000
Alcoholic Beverage License: $3,000
- Total Salaries and Wages: $37,000
Hancock County government finances - Revenue in 2017:
- Charges - Other: $312,000
Other: $126,000
Sewerage: $94,000
Sewerage: $90,000
Regular Highways: $11,000
Parks and Recreation: $8,000
Regular Highways: $7,000
Parks and Recreation: $5,000
- Construction - General Public Buildings: $3,081,000
Health - Other: $562,000
General Public Buildings: $100,000
Regular Highways: $2,000
- Current Operations - Regular Highways: $2,685,000
Regular Highways: $2,267,000
General - Other: $1,581,000
Central Staff Services: $1,148,000
Financial Administration: $949,000
Correctional Institutions: $907,000
Police Protection: $874,000
Correctional Institutions: $851,000
General - Other: $834,000
Police Protection: $817,000
Judicial and Legal Services: $797,000
Judicial and Legal Services: $776,000
Financial Administration: $602,000
General Public Buildings: $599,000
Solid Waste Management: $570,000
General Public Buildings: $548,000
Health - Other: $533,000
Public Welfare - Other: $520,000
Central Staff Services: $509,000
Health - Other: $504,000
Solid Waste Management: $489,000
Parks and Recreation: $228,000
Parks and Recreation: $210,000
Libraries: $144,000
Local Fire Protection: $131,000
Libraries: $125,000
Local Fire Protection: $112,000
Natural Resources - Other: $57,000
Natural Resources - Other: $30,000
- General - Interest on Debt: $206,000
Interest on Debt: $195,000
- Local Intergovernmental - Other: $37,000
- Long Term Debt - Beginning Outstanding - Unspecified Public Purpose: $4,641,000
Outstanding Unspecified Public Purpose: $4,161,000
Beginning Outstanding - Unspecified Public Purpose: $3,395,000
Outstanding Unspecified Public Purpose: $3,149,000
Retired Unspecified Public Purpose: $524,000
Retired Unspecified Public Purpose: $246,000
Issue, Unspecified Public Purpose: $44,000
- Miscellaneous - General Revenue - Other: $1,396,000
Fines and Forfeits: $295,000
Fines and Forfeits: $282,000
General Revenue - Other: $47,000
Sale of Property: $34,000
Rents: $31,000
Rents: $30,000
Sale of Property: $15,000
Interest Earnings: $3,000
Interest Earnings: $2,000
Donations From Private Sources: $1,000
- Other Capital Outlay - Regular Highways: $456,000
Regular Highways: $179,000
Police Protection: $99,000
Financial Administration: $85,000
Public Welfare - Other: $41,000
Local Fire Protection: $39,000
Judicial and Legal Services: $20,000
Judicial and Legal Services: $12,000
Correctional Institutions: $10,000
Correctional Institutions: $10,000
General - Other: $4,000
- Other Funds - Cash and Securities: $1,603,000
Cash and Securities: $1,069,000
- Revenue - Water Utilities: $141,000
Water Utilities: $135,000
Transit Utilities: $98,000
- Sinking Funds - Cash and Securities: $1,012,000
- State Intergovernmental - Other: $738,000
Other: $707,000
Housing and Community Development: $609,000
Public Welfare: $325,000
General Local Government Support: $20,000
General Local Government Support: $13,000
- Tax - Property: $6,439,000
Property: $6,437,000
General Sales and Gross Receipts: $1,950,000
General Sales and Gross Receipts: $1,708,000
Insurance Premiums Sales: $553,000
Other: $450,000
Insurance Premiums Sales: $447,000
Other: $121,000
Other License: $72,000
Other License: $32,000
Alcoholic Beverage Sales: $22,000
Alcoholic Beverage Sales: $18,000
Occupation and Business License - Other: $10,000
Occupation and Business License - Other: $9,000
Alcoholic Beverage License: $3,000
Alcoholic Beverage License: $3,000
- Total Salaries and Wages: $37,000
Hancock County government finances - Debt in 2017:
- Charges - Other: $312,000
Other: $126,000
Sewerage: $94,000
Sewerage: $90,000
Regular Highways: $11,000
Parks and Recreation: $8,000
Regular Highways: $7,000
Parks and Recreation: $5,000
- Construction - General Public Buildings: $3,081,000
Health - Other: $562,000
General Public Buildings: $100,000
Regular Highways: $2,000
- Current Operations - Regular Highways: $2,685,000
Regular Highways: $2,267,000
General - Other: $1,581,000
Central Staff Services: $1,148,000
Financial Administration: $949,000
Correctional Institutions: $907,000
Police Protection: $874,000
Correctional Institutions: $851,000
General - Other: $834,000
Police Protection: $817,000
Judicial and Legal Services: $797,000
Judicial and Legal Services: $776,000
Financial Administration: $602,000
General Public Buildings: $599,000
Solid Waste Management: $570,000
General Public Buildings: $548,000
Health - Other: $533,000
Public Welfare - Other: $520,000
Central Staff Services: $509,000
Health - Other: $504,000
Solid Waste Management: $489,000
Parks and Recreation: $228,000
Parks and Recreation: $210,000
Libraries: $144,000
Local Fire Protection: $131,000
Libraries: $125,000
Local Fire Protection: $112,000
Natural Resources - Other: $57,000
Natural Resources - Other: $30,000
- General - Interest on Debt: $206,000
Interest on Debt: $195,000
- Local Intergovernmental - Other: $37,000
- Long Term Debt - Beginning Outstanding - Unspecified Public Purpose: $4,641,000
Outstanding Unspecified Public Purpose: $4,161,000
Beginning Outstanding - Unspecified Public Purpose: $3,395,000
Outstanding Unspecified Public Purpose: $3,149,000
Retired Unspecified Public Purpose: $524,000
Retired Unspecified Public Purpose: $246,000
Issue, Unspecified Public Purpose: $44,000
- Miscellaneous - General Revenue - Other: $1,396,000
Fines and Forfeits: $295,000
Fines and Forfeits: $282,000
General Revenue - Other: $47,000
Sale of Property: $34,000
Rents: $31,000
Rents: $30,000
Sale of Property: $15,000
Interest Earnings: $3,000
Interest Earnings: $2,000
Donations From Private Sources: $1,000
- Other Capital Outlay - Regular Highways: $456,000
Regular Highways: $179,000
Police Protection: $99,000
Financial Administration: $85,000
Public Welfare - Other: $41,000
Local Fire Protection: $39,000
Judicial and Legal Services: $20,000
Judicial and Legal Services: $12,000
Correctional Institutions: $10,000
Correctional Institutions: $10,000
General - Other: $4,000
- Other Funds - Cash and Securities: $1,603,000
Cash and Securities: $1,069,000
- Revenue - Water Utilities: $141,000
Water Utilities: $135,000
Transit Utilities: $98,000
- Sinking Funds - Cash and Securities: $1,012,000
- State Intergovernmental - Other: $738,000
Other: $707,000
Housing and Community Development: $609,000
Public Welfare: $325,000
General Local Government Support: $20,000
General Local Government Support: $13,000
- Tax - Property: $6,439,000
Property: $6,437,000
General Sales and Gross Receipts: $1,950,000
General Sales and Gross Receipts: $1,708,000
Insurance Premiums Sales: $553,000
Other: $450,000
Insurance Premiums Sales: $447,000
Other: $121,000
Other License: $72,000
Other License: $32,000
Alcoholic Beverage Sales: $22,000
Alcoholic Beverage Sales: $18,000
Occupation and Business License - Other: $10,000
Occupation and Business License - Other: $9,000
Alcoholic Beverage License: $3,000
Alcoholic Beverage License: $3,000
- Total Salaries and Wages: $37,000
Hancock County government finances - Cash and Securities in 2017:
- Charges - Other: $312,000
Other: $126,000
Sewerage: $94,000
Sewerage: $90,000
Regular Highways: $11,000
Parks and Recreation: $8,000
Regular Highways: $7,000
Parks and Recreation: $5,000
- Construction - General Public Buildings: $3,081,000
Health - Other: $562,000
General Public Buildings: $100,000
Regular Highways: $2,000
- Current Operations - Regular Highways: $2,685,000
Regular Highways: $2,267,000
General - Other: $1,581,000
Central Staff Services: $1,148,000
Financial Administration: $949,000
Correctional Institutions: $907,000
Police Protection: $874,000
Correctional Institutions: $851,000
General - Other: $834,000
Police Protection: $817,000
Judicial and Legal Services: $797,000
Judicial and Legal Services: $776,000
Financial Administration: $602,000
General Public Buildings: $599,000
Solid Waste Management: $570,000
General Public Buildings: $548,000
Health - Other: $533,000
Public Welfare - Other: $520,000
Central Staff Services: $509,000
Health - Other: $504,000
Solid Waste Management: $489,000
Parks and Recreation: $228,000
Parks and Recreation: $210,000
Libraries: $144,000
Local Fire Protection: $131,000
Libraries: $125,000
Local Fire Protection: $112,000
Natural Resources - Other: $57,000
Natural Resources - Other: $30,000
- General - Interest on Debt: $206,000
Interest on Debt: $195,000
- Local Intergovernmental - Other: $37,000
- Long Term Debt - Beginning Outstanding - Unspecified Public Purpose: $4,641,000
Outstanding Unspecified Public Purpose: $4,161,000
Beginning Outstanding - Unspecified Public Purpose: $3,395,000
Outstanding Unspecified Public Purpose: $3,149,000
Retired Unspecified Public Purpose: $524,000
Retired Unspecified Public Purpose: $246,000
Issue, Unspecified Public Purpose: $44,000
- Miscellaneous - General Revenue - Other: $1,396,000
Fines and Forfeits: $295,000
Fines and Forfeits: $282,000
General Revenue - Other: $47,000
Sale of Property: $34,000
Rents: $31,000
Rents: $30,000
Sale of Property: $15,000
Interest Earnings: $3,000
Interest Earnings: $2,000
Donations From Private Sources: $1,000
- Other Capital Outlay - Regular Highways: $456,000
Regular Highways: $179,000
Police Protection: $99,000
Financial Administration: $85,000
Public Welfare - Other: $41,000
Local Fire Protection: $39,000
Judicial and Legal Services: $20,000
Judicial and Legal Services: $12,000
Correctional Institutions: $10,000
Correctional Institutions: $10,000
General - Other: $4,000
- Other Funds - Cash and Securities: $1,603,000
Cash and Securities: $1,069,000
- Revenue - Water Utilities: $141,000
Water Utilities: $135,000
Transit Utilities: $98,000
- Sinking Funds - Cash and Securities: $1,012,000
- State Intergovernmental - Other: $738,000
Other: $707,000
Housing and Community Development: $609,000
Public Welfare: $325,000
General Local Government Support: $20,000
General Local Government Support: $13,000
- Tax - Property: $6,439,000
Property: $6,437,000
General Sales and Gross Receipts: $1,950,000
General Sales and Gross Receipts: $1,708,000
Insurance Premiums Sales: $553,000
Other: $450,000
Insurance Premiums Sales: $447,000
Other: $121,000
Other License: $72,000
Other License: $32,000
Alcoholic Beverage Sales: $22,000
Alcoholic Beverage Sales: $18,000
Occupation and Business License - Other: $10,000
Occupation and Business License - Other: $9,000
Alcoholic Beverage License: $3,000
Alcoholic Beverage License: $3,000
- Total Salaries and Wages: $37,000
Supplemental Security Income (SSI) in 2006:
- Total number of recipients: 473
- Number of aged recipients: 107
- Number of blind and disabled recipients: 366
- Number of recipients under 18: 54
- Number of recipients between 18 and 64: 220
- Number of recipients older than 64: 199
- Number of recipients also receiving OASDI: 224
- Amount of payments (thousands of dollars): 184
| Most common first names in Hancock County, GA among deceased individuals | ||
| Name | Count | Lived (average) |
|---|---|---|
| Willie | 100 | 71.6 years |
| James | 90 | 71.4 years |
| Mary | 85 | 76.8 years |
| William | 68 | 71.9 years |
| John | 59 | 71.9 years |
| Annie | 51 | 80.8 years |
| Robert | 44 | 71.6 years |
| Charlie | 36 | 72.8 years |
| George | 34 | 72.3 years |
| Lillie | 28 | 80.4 years |
| Most common last names in Hancock County, GA among deceased individuals | ||
| Last name | Count | Lived (average) |
|---|---|---|
| Johnson | 76 | 77.7 years |
| Smith | 63 | 74.0 years |
| Lewis | 55 | 72.0 years |
| Jackson | 50 | 73.6 years |
| Brown | 49 | 73.7 years |
| Harris | 39 | 71.9 years |
| Ingram | 39 | 75.4 years |
| Warren | 37 | 75.0 years |
| Harper | 37 | 71.8 years |
| Wilson | 35 | 71.4 years |
Businesses in Hancock County, GA
- Ace Hardware: 1
- H&R Block: 1
- Subway: 1
Hancock County on our top lists:
- #24 on the list of "Top 101 counties with highest percentage of residents voting for Obama (Democrat) in the 2012 Presidential Election"