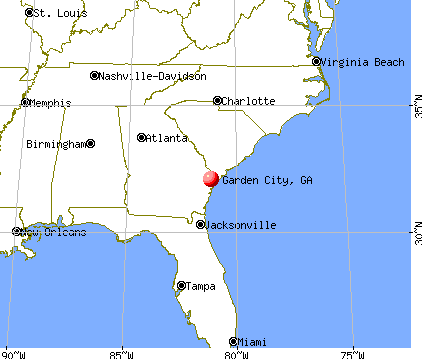
Garden City, Georgia
Submit your own pictures of this city and show them to the world
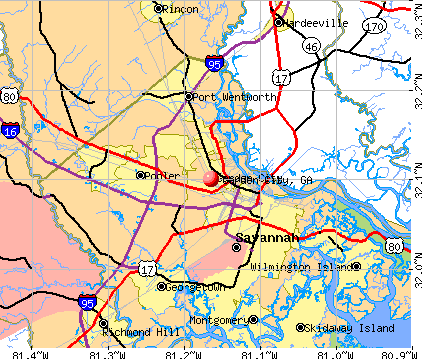
- OSM Map
- General Map
- Google Map
- MSN Map
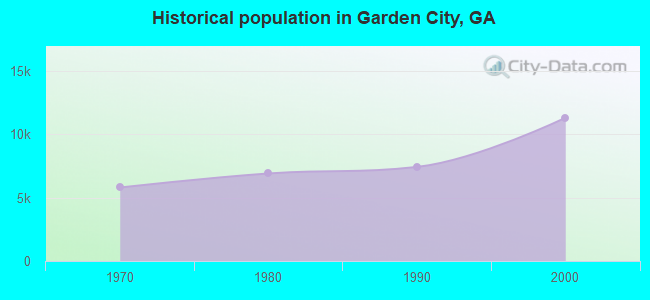
Population change since 2000: -7.6%
| Males: 5,289 | |
| Females: 5,137 |
| Median resident age: | 34.8 years |
| Georgia median age: | 37.6 years |
Zip codes: 31405, 31407, 31408, 31415.
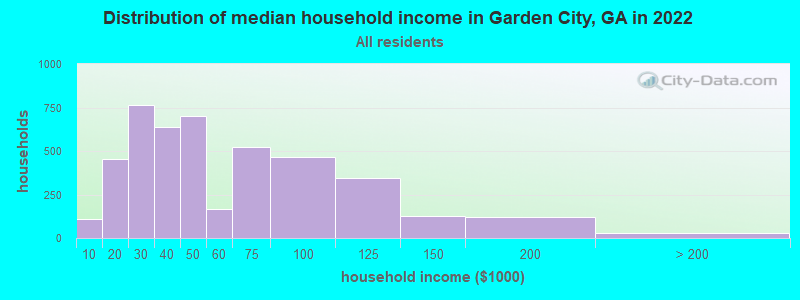
Garden City Zip Code Map| Garden City: | $44,661 |
| GA: | $72,837 |
Estimated per capita income in 2022: $23,148 (it was $14,139 in 2000)
Garden City city income, earnings, and wages data
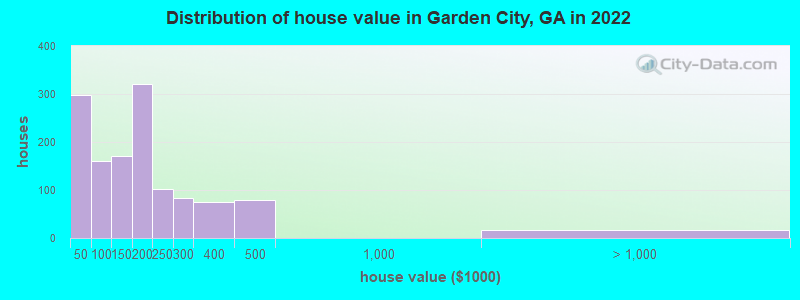
Estimated median house or condo value in 2022: $163,429 (it was $62,400 in 2000)
| Garden City: | $163,429 |
| GA: | $297,400 |
Mean prices in 2022: all housing units: $152,013; detached houses: $179,042; mobile homes: $112,743
Median gross rent in 2022: $1,107.
(16.1% for White Non-Hispanic residents, 7.2% for Black residents, 23.3% for Hispanic or Latino residents, 6.4% for other race residents, 28.2% for two or more races residents)
Detailed information about poverty and poor residents in Garden City, GA

Compare current foreclosures near Garden City, GA:
| Photo | Address | Area | Beds / Baths | Price | Details |
|---|---|---|---|---|---|

|
#1
Osteen St
Savannah, GA 31407
|
1,248 sq. feet
|
1 baths 3 beds |
$285,000
|
show details |

|
#2
Springfield Pl
Savannah, GA 31411
|
3,717 sq. feet
|
4 baths 6 beds |
$1,224,900
|
show details |

|
#3
Gentry Way
Richmond Hill, GA 31324
|
2,598 sq. feet
|
3 baths 4 beds |
show details | |

|
#4
Gable St
Savannah, GA 31404
|
1,350 sq. feet
|
2 baths 3 beds |
show details | |

|
#5
Carlisle Ln
Savannah, GA 31419
|
1,405 sq. feet
|
2 baths 3 beds |
show details | |

|
#6
Fairgreen St
Savannah, GA 31407
|
- sq. feet
|
2 baths 3 beds |
show details | |

|
#7
Crooked Oaks Dr
Rincon, GA 31326
|
- sq. feet
|
2 baths 5 beds |
show details | |

|
#8
Little River Dr
Savannah, GA 31419
|
1,456 sq. feet
|
2 baths 3 beds |
show details | |

|
#9
E 42nd St
Savannah, GA 31404
|
1,621 sq. feet
|
1 baths 3 beds |
show details | |

|
#10
Gray Fox Way
Savannah, GA 31406
|
1,727 sq. feet
|
2 baths 3 beds |
show details |
| Photo | Address | Area | Beds / Baths | Price | Details |
|---|---|---|---|---|---|

|
#11
Lorraine Ct
Savannah, GA 31404
|
1,014 sq. feet
|
1 baths 3 beds |
show details | |

|
#12
Olmstead Pl
Savannah, GA 31408
|
1,102 sq. feet
|
1 baths 3 beds |
show details | |

|
#13
Little River Dr
Savannah, GA 31419
|
1,901 sq. feet
|
2 baths 4 beds |
show details | |

|
#14
New York Ave
Savannah, GA 31404
|
1,848 sq. feet
|
2 baths 3 beds |
show details | |

|
#15
Walz Dr
Savannah, GA 31404
|
1,670 sq. feet
|
1 baths 3 beds |
show details | |

|
#16
Lake Shore Blvd
Savannah, GA 31407
|
3,278 sq. feet
|
2 baths 3 beds |
show details | |

|
#17
Mason Dr
Savannah, GA 31404
|
1,164 sq. feet
|
1 baths 3 beds |
show details | |

|
#18
Alabama Ave
Savannah, GA 31404
|
1,850 sq. feet
|
3 baths 3 beds |
show details | |

|
#19
N Leeds Gate Rd
Savannah, GA 31406
|
1,444 sq. feet
|
2 baths 3 beds |
show details | |

|
#20
Tigers Paw Dr
Pooler, GA 31322
|
2,364 sq. feet
|
2 baths 4 beds |
show details |
| Photo | Address | Area | Beds / Baths | Price | Details |
|---|---|---|---|---|---|

|
#21
Mosley St
Savannah, GA 31404
|
1,664 sq. feet
|
2 baths 4 beds |
show details | |

|
#22
Spring Hill Rd
Savannah, GA 31404
|
1,527 sq. feet
|
2 baths 3 beds |
show details | |

|
#23
Little River Dr
Savannah, GA 31419
|
1,438 sq. feet
|
2 baths 3 beds |
show details | |

|
#24
Larchmont Dr
Savannah, GA 31419
|
1,460 sq. feet
|
2 baths 3 beds |
show details | |

|
#25
E 57th St
Savannah, GA 31404
|
990 sq. feet
|
1 baths 2 beds |
show details | |

|
#26
E 62nd St
Savannah, GA 31404
|
1,348 sq. feet
|
1 baths 3 beds |
show details | |

|
#27
Corsair Cir
Port Wentworth, GA 31407
|
1,279 sq. feet
|
2 baths 3 beds |
show details | |

|
#28
Mclaws St
Savannah, GA 31405
|
1,678 sq. feet
|
2 baths 3 beds |
show details | |

|
#29
California Ave
Savannah, GA 31404
|
1,344 sq. feet
|
1 baths 3 beds |
show details | |

|
#30
Cordage Cir
Savannah, GA 31407
|
1,250 sq. feet
|
2 baths 3 beds |
show details |
| Photo | Address | Area | Beds / Baths | Price | Details |
|---|---|---|---|---|---|

|
#31
Corsair Cir
Savannah, GA 31407
|
1,868 sq. feet
|
2 baths 4 beds |
show details | |

|
#32
Eastgate Dr
Savannah, GA 31404
|
1,152 sq. feet
|
1 baths 3 beds |
show details | |

|
#33
Vermont Ave
Savannah, GA 31404
|
1,435 sq. feet
|
1 baths 2 beds |
show details | |

|
#34
Delesseps Ave
Savannah, GA 31404
|
1,404 sq. feet
|
2 baths 3 beds |
show details | |

|
#35
Gimbal Cir
Savannah, GA 31407
|
2,190 sq. feet
|
3 baths 4 beds |
show details | |

|
#36
Mosley St
Savannah, GA 31404
|
1,518 sq. feet
|
1 baths 3 beds |
show details | |

|
#37
Eastgate Dr
Savannah, GA 31404
|
1,260 sq. feet
|
1 baths 4 beds |
show details | |

|
#38
E 40th St
Savannah, GA 31404
|
1,161 sq. feet
|
1 baths 3 beds |
show details | |

|
#39
Pinetree Rd
Savannah, GA 31404
|
1,566 sq. feet
|
2 baths 4 beds |
show details | |

|
#40
Mosswood Dr
Savannah, GA 31405
|
1,983 sq. feet
|
3 baths 4 beds |
show details |
| Photo | Address | Area | Beds / Baths | Price | Details |
|---|---|---|---|---|---|

|
#41
Quail Forest Dr
Savannah, GA 31419
|
1,066 sq. feet
|
2 baths 3 beds |
show details | |

|
#42
Bent Oaks Dr
Savannah, GA 31404
|
1,120 sq. feet
|
2 baths 2 beds |
show details | |

|
#43
Manor Dr
Savannah, GA 31404
|
845 sq. feet
|
1 baths 3 beds |
show details | |

|
#44
Shirley Dr
Savannah, GA 31404
|
976 sq. feet
|
1 baths 3 beds |
show details | |

|
#45
Toussaint Ave
Savannah, GA 31404
|
1,352 sq. feet
|
2 baths 3 beds |
show details | |

|
#46
Russ Cir
Savannah, GA 31406
|
1,519 sq. feet
|
2 baths 3 beds |
show details | |

|
#47
S Parkwood Dr
Savannah, GA 31404
|
1,025 sq. feet
|
1 baths 3 beds |
show details | |

|
#48
Quail Xing
Savannah, GA 31419
|
1,189 sq. feet
|
2 baths 3 beds |
show details | |

|
#49
Lewis Dr
Savannah, GA 31406
|
1,413 sq. feet
|
2 baths 3 beds |
show details | |

|
Check over 1 million property listings on Foreclosure.com!
|
browse all offers | |||


- 4,19839.9%Black alone
- 3,61934.4%White alone
- 2,19620.9%Hispanic
- 2332.2%Asian alone
- 2051.9%Two or more races
- 230.2%Other race alone
- 80.08%American Indian alone
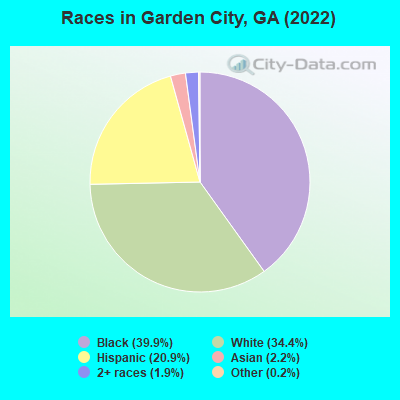
Races in Garden City detailed stats: ancestries, foreign born residents, place of birth
According to our research of Georgia and other state lists, there were 43 registered sex offenders living in Garden City, Georgia as of May 13, 2024.
The ratio of all residents to sex offenders in Garden City is 211 to 1.
Type |
2009 |
2010 |
2011 |
2012 |
2013 |
2014 |
2015 |
2016 |
2017 |
2018 |
2019 |
2020 |
2021 |
2022 |
|---|---|---|---|---|---|---|---|---|---|---|---|---|---|---|
| Murders (per 100,000) | 1 (10.7) | 0 (0.0) | 0 (0.0) | 0 (0.0) | 0 (0.0) | 0 (0.0) | 1 (11.1) | 0 (0.0) | 2 (22.4) | 0 (0.0) | 0 (0.0) | 5 (57.4) | 2 (21.6) | 2 (19.5) |
| Rapes (per 100,000) | 6 (64.3) | 1 (11.4) | 1 (11.2) | 4 (44.0) | 0 (0.0) | 3 (33.6) | 4 (44.2) | 4 (44.2) | 5 (56.0) | 4 (44.4) | 9 (101.6) | 8 (91.8) | 10 (107.9) | 8 (78.1) |
| Robberies (per 100,000) | 24 (257.3) | 20 (227.8) | 19 (213.6) | 18 (197.9) | 37 (412.6) | 44 (492.7) | 33 (364.9) | 13 (143.8) | 25 (279.9) | 19 (210.9) | 19 (214.6) | 20 (229.5) | 16 (172.6) | 9 (87.8) |
| Assaults (per 100,000) | 120 (1,286) | 121 (1,378) | 103 (1,158) | 96 (1,055) | 122 (1,360) | 108 (1,209) | 69 (763.0) | 109 (1,206) | 125 (1,399) | 100 (1,110) | 77 (869.7) | 87 (998.2) | 121 (1,306) | 87 (848.9) |
| Burglaries (per 100,000) | 106 (1,136) | 142 (1,618) | 110 (1,237) | 162 (1,781) | 156 (1,740) | 210 (2,351) | 177 (1,957) | 175 (1,936) | 261 (2,922) | 54 (599.5) | 54 (609.9) | 62 (711.3) | 51 (550.3) | 50 (487.9) |
| Thefts (per 100,000) | 264 (2,830) | 337 (3,839) | 303 (3,407) | 219 (2,407) | 237 (2,643) | 292 (3,270) | 284 (3,141) | 271 (2,998) | 341 (3,818) | 255 (2,831) | 201 (2,270) | 268 (3,075) | 277 (2,989) | 266 (2,596) |
| Auto thefts (per 100,000) | 80 (857.5) | 66 (751.9) | 44 (494.7) | 39 (428.7) | 31 (345.7) | 22 (246.3) | 23 (254.3) | 11 (121.7) | 5 (56.0) | 11 (122.1) | 39 (440.5) | 76 (872.0) | 73 (787.7) | 65 (634.3) |
| Arson (per 100,000) | 1 (10.7) | 4 (45.6) | 2 (22.5) | 3 (33.0) | 0 (0.0) | 1 (11.2) | 1 (11.1) | 3 (33.2) | 1 (11.2) | 0 (0.0) | 2 (22.6) | 0 (0.0) | 2 (21.6) | 2 (19.5) |
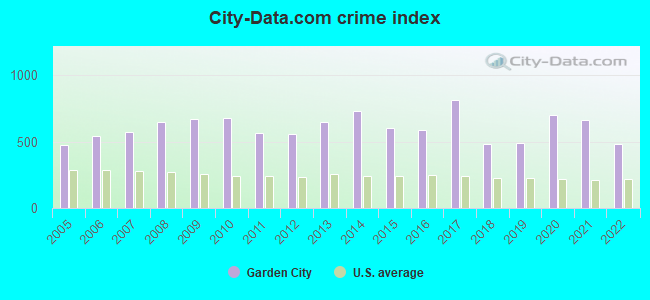
| City-Data.com crime index | 668.7 | 680.1 | 567.1 | 560.8 | 651.0 | 731.6 | 602.6 | 584.8 | 815.2 | 485.8 | 488.4 | 699.2 | 663.5 | 486.3 |
The City-Data.com crime index weighs serious crimes and violent crimes more heavily. Higher means more crime, U.S. average is 246.1. It adjusts for the number of visitors and daily workers commuting into cities.
Crime rate in Garden City detailed stats: murders, rapes, robberies, assaults, burglaries, thefts, arson
Full-time law enforcement employees in 2021, including police officers: 41 (32 officers - 26 male; 6 female).
| Officers per 1,000 residents here: | 3.45 |
| Georgia average: | 2.45 |
 Recent articles from our blog. Our writers, many of them Ph.D. graduates or candidates, create easy-to-read articles on a wide variety of topics.


Latest news from Garden City, GA collected exclusively by city-data.com from local newspapers, TV, and radio stations
Ancestries: Irish (6.0%), American (4.2%), English (3.1%), German (1.9%), African (1.5%), Scottish (1.2%).
Current Local Time: EST time zone
Elevation: 15 feet
Land area: 14.6 square miles.
Population density: 714 people per square mile (low).
1,326 residents are foreign born (9.9% Latin America, 2.1% Asia).
| This city: | 12.6% |
| Georgia: | 10.4% |
Median real estate property taxes paid for housing units with mortgages in 2022: $1,202 (0.7%)
Median real estate property taxes paid for housing units with no mortgage in 2022: $786 (0.7%)
Nearest city with pop. 50,000+: Savannah, GA  (5.0 miles , pop. 131,510).
Nearest city with pop. 200,000+: Jacksonville, FL (126.6 miles , pop. 735,617).
Nearest city with pop. 1,000,000+: Philadelphia, PA (641.3 miles , pop. 1,517,550).
Nearest cities:
), ), Latitude: 32.10 N, Longitude: 81.16 W
Daytime population change due to commuting: +6,566 (+62.4%)
Workers who live and work in this city: 862 (17.2%)
Area code commonly used in this area: 912

Garden City, Georgia accommodation & food services, waste management - Economy and Business Data
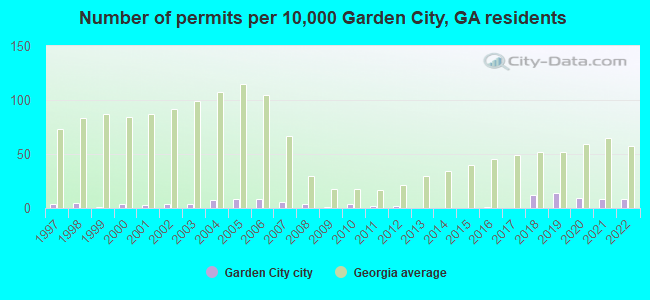
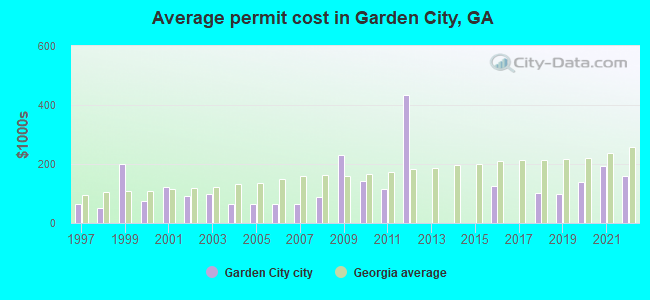
Single-family new house construction building permits:
- 2022: 9 buildings, average cost: $161,000
- 2021: 9 buildings, average cost: $191,800
- 2020: 10 buildings, average cost: $139,900
- 2019: 16 buildings, average cost: $97,300
- 2018: 13 buildings, average cost: $102,300
- 2016: 1 building, cost: $126,000
- 2012: 2 buildings, average cost: $435,000
- 2011: 2 buildings, average cost: $114,000
- 2010: 4 buildings, average cost: $141,300
- 2009: 1 building, cost: $230,000
- 2008: 5 buildings, average cost: $87,000
- 2007: 7 buildings, average cost: $64,000
- 2006: 9 buildings, average cost: $64,000
- 2005: 9 buildings, average cost: $64,000
- 2004: 8 buildings, average cost: $64,000
- 2003: 4 buildings, average cost: $96,700
- 2002: 5 buildings, average cost: $89,600
- 2001: 3 buildings, average cost: $121,600
- 2000: 4 buildings, average cost: $73,600
- 1999: 1 building, cost: $201,100
- 1998: 6 buildings, average cost: $52,000
- 1997: 4 buildings, average cost: $66,400
| Here: | 2.6% |
| Georgia: | 2.9% |
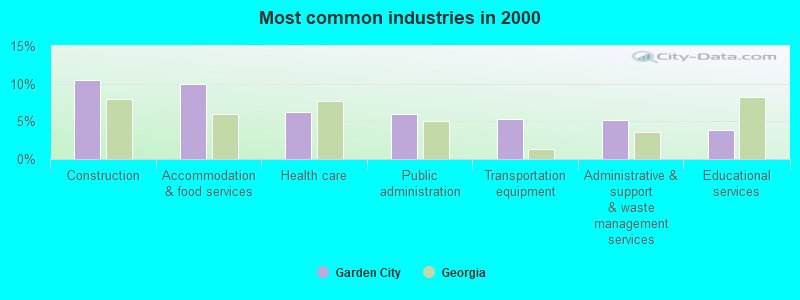
- Construction (10.5%)
- Accommodation & food services (10.0%)
- Health care (6.3%)
- Public administration (6.0%)
- Transportation equipment (5.3%)
- Administrative & support & waste management services (5.2%)
- Educational services (3.9%)
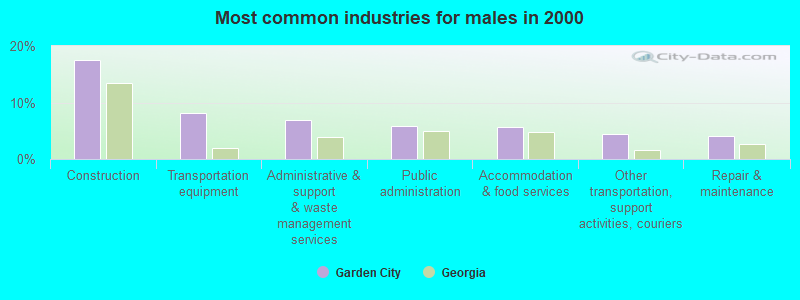
- Construction (17.5%)
- Transportation equipment (8.2%)
- Administrative & support & waste management services (6.9%)
- Public administration (5.8%)
- Accommodation & food services (5.6%)
- Other transportation, support activities, couriers (4.4%)
- Repair & maintenance (4.1%)
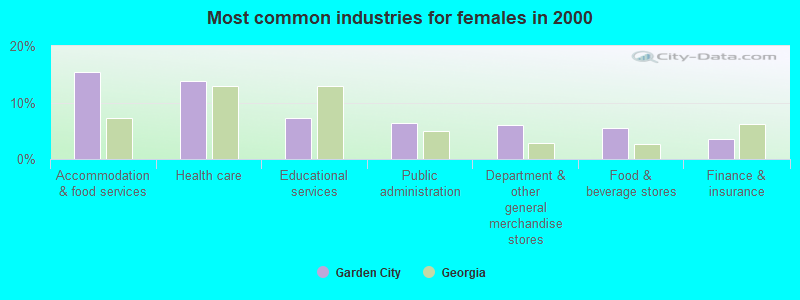
- Accommodation & food services (15.5%)
- Health care (13.9%)
- Educational services (7.2%)
- Public administration (6.3%)
- Department & other general merchandise stores (6.1%)
- Food & beverage stores (5.5%)
- Finance & insurance (3.6%)
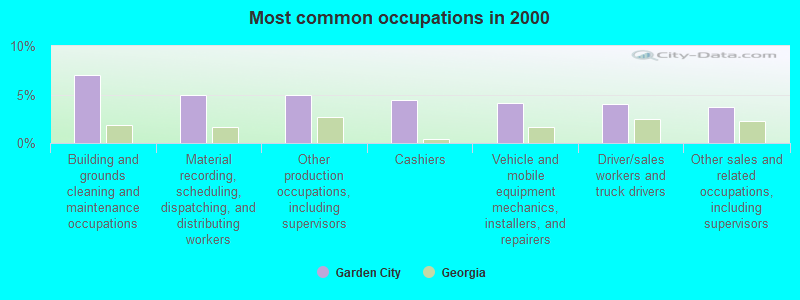
- Building and grounds cleaning and maintenance occupations (7.0%)
- Material recording, scheduling, dispatching, and distributing workers (4.9%)
- Other production occupations, including supervisors (4.9%)
- Cashiers (4.4%)
- Vehicle and mobile equipment mechanics, installers, and repairers (4.1%)
- Driver/sales workers and truck drivers (4.1%)
- Other sales and related occupations, including supervisors (3.7%)
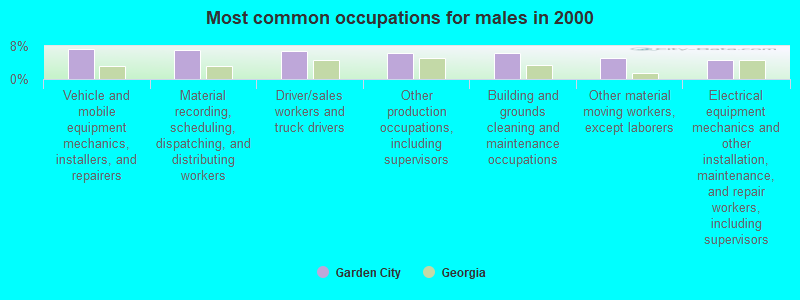
- Vehicle and mobile equipment mechanics, installers, and repairers (7.4%)
- Material recording, scheduling, dispatching, and distributing workers (6.9%)
- Driver/sales workers and truck drivers (6.7%)
- Other production occupations, including supervisors (6.4%)
- Building and grounds cleaning and maintenance occupations (6.4%)
- Other material moving workers, except laborers (5.1%)
- Electrical equipment mechanics and other installation, maintenance, and repair workers, including supervisors (4.5%)
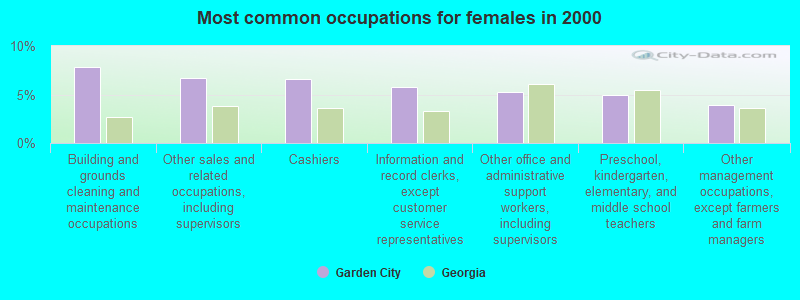
- Building and grounds cleaning and maintenance occupations (7.8%)
- Other sales and related occupations, including supervisors (6.7%)
- Cashiers (6.6%)
- Information and record clerks, except customer service representatives (5.8%)
- Other office and administrative support workers, including supervisors (5.3%)
- Preschool, kindergarten, elementary, and middle school teachers (4.9%)
- Other management occupations, except farmers and farm managers (3.9%)
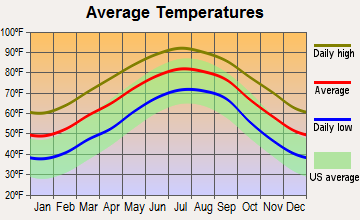
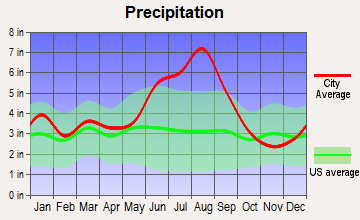
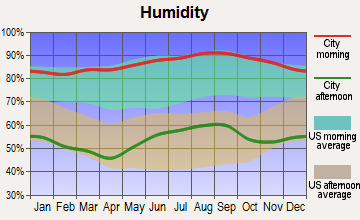
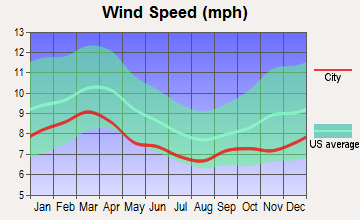
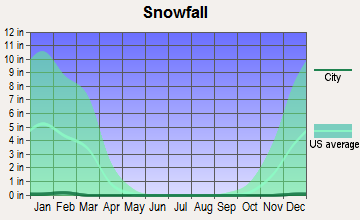
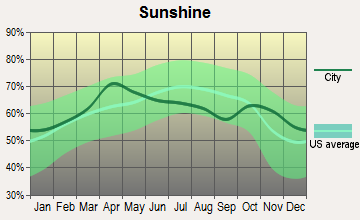
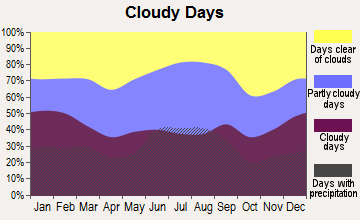
Average climate in Garden City, Georgia
Based on data reported by over 4,000 weather stations
(lower is better)
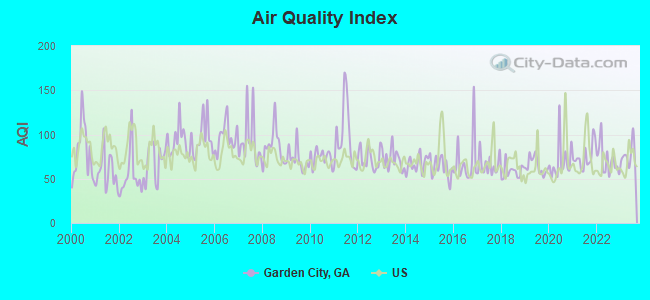
Air Quality Index (AQI) level in 2023 was 76.6. This is about average.
| City: | 76.6 |
| U.S.: | 72.6 |
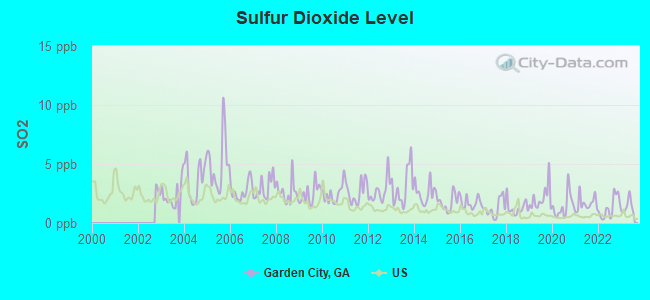
Sulfur Dioxide (SO2) [ppb] level in 2023 was 1.41. This is about average. Closest monitor was 2.1 miles away from the city center.
| City: | 1.41 |
| U.S.: | 1.51 |
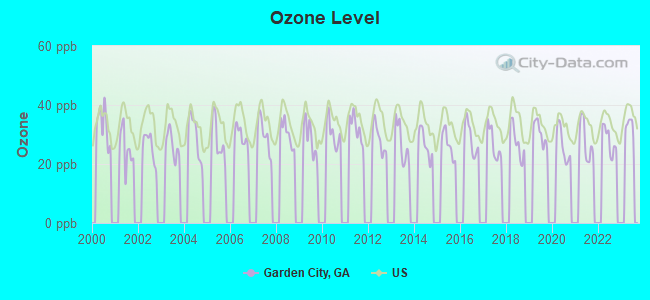
Ozone [ppb] level in 2022 was 28.0. This is about average. Closest monitor was 7.1 miles away from the city center.
| City: | 28.0 |
| U.S.: | 33.3 |
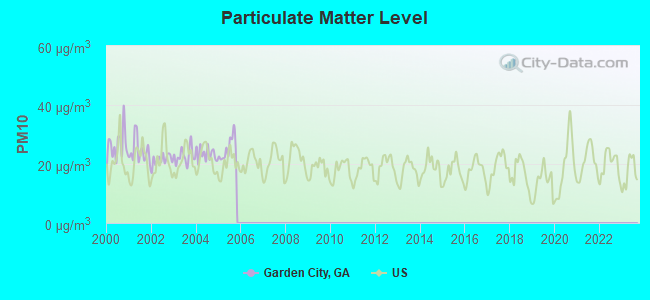
Particulate Matter (PM10) [µg/m3] level in 2005 was 25.2. This is worse than average. Closest monitor was 2.1 miles away from the city center.
| City: | 25.2 |
| U.S.: | 19.2 |
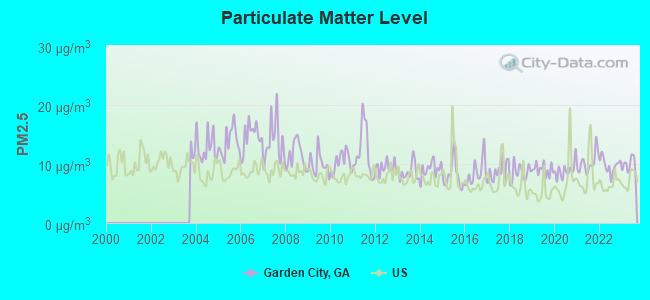
Particulate Matter (PM2.5) [µg/m3] level in 2023 was 9.90. This is worse than average. Closest monitor was 0.7 miles away from the city center.
| City: | 9.90 |
| U.S.: | 8.11 |
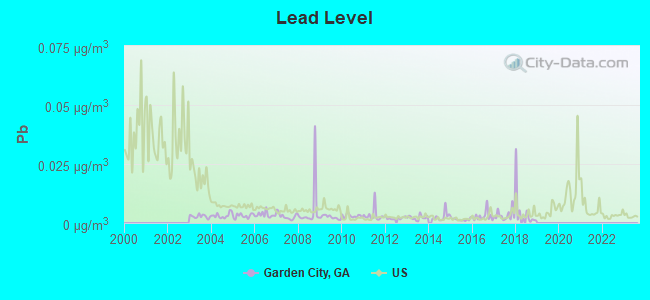
Lead (Pb) [µg/m3] level in 2018 was 0.00517. This is significantly better than average. Closest monitor was 4.2 miles away from the city center.
| City: | 0.00517 |
| U.S.: | 0.00931 |
Tornado activity:
Garden City-area historical tornado activity is significantly below Georgia state average. It is 39% smaller than the overall U.S. average.
On 4/9/1998, a category F3 (max. wind speeds 158-206 mph) tornado 12.0 miles away from the Garden City city center killed 2 people and injured 17 people and caused $3 million in damages.
On 5/11/2008, a category F4 (max. wind speeds 207-260 mph) tornado 50.8 miles away from the city center injured 9 people and caused $13 million in damages.
Earthquake activity:
Garden City-area historical earthquake activity is significantly above Georgia state average. It is 47% smaller than the overall U.S. average.On 11/22/1974 at 05:25:55, a magnitude 4.7 (4.7 MB, Class: Light, Intensity: IV - V) earthquake occurred 81.2 miles away from Garden City center
On 8/2/1974 at 08:52:09, a magnitude 4.9 (4.3 MB, 4.9 LG) earthquake occurred 144.6 miles away from the city center
On 8/21/1992 at 16:31:55, a magnitude 4.4 (4.1 MB, 4.1 LG, 4.4 LG, Depth: 6.2 mi) earthquake occurred 89.7 miles away from Garden City center
On 11/11/2002 at 23:39:29, a magnitude 4.0 (4.0 MB, Depth: 1.5 mi) earthquake occurred 74.9 miles away from Garden City center
On 8/9/2020 at 12:07:37, a magnitude 5.1 (5.1 MW, Depth: 4.7 mi, Class: Moderate, Intensity: VI - VII) earthquake occurred 302.6 miles away from the city center
On 4/17/1995 at 13:45:57, a magnitude 3.9 (3.9 LG, Depth: 6.2 mi, Class: Light, Intensity: II - III) earthquake occurred 86.7 miles away from the city center
Magnitude types: regional Lg-wave magnitude (LG), body-wave magnitude (MB), moment magnitude (MW)
Natural disasters:
The number of natural disasters in Chatham County (9) is smaller than the US average (15).Major Disasters (Presidential) Declared: 3
Emergencies Declared: 5
Causes of natural disasters: Hurricanes: 4, Floods: 2, Tornadoes: 2, Drought: 1, Heavy Rain: 1, Snowfall: 1, Storm: 1, Wind: 1, Winter Storm: 1, Other: 1 (Note: some incidents may be assigned to more than one category).

Hospitals and medical centers in Garden City:
Other hospitals and medical centers near Garden City:
- AMEDISYS HOME HEALTH (Home Health Center, about 3 miles away; SAVANNAH, GA)
- HOSPICE SAVANNAH, INC. (Hospital, about 3 miles away; SAVANNAH, GA)
- WESTVIEW NURSING AND REHABILITATION CENTER (Nursing Home, about 4 miles away; PORT WENTWORTH, GA)
- DSI SAVANNAH DRAYTON DIALYSIS (Dialysis Facility, about 5 miles away; SAVANNAH, GA)
- PLACE AT POOLER, THE (Nursing Home, about 6 miles away; POOLER, GA)
- DERENNE DIALYSIS (Dialysis Facility, about 6 miles away; SAVANNAH, GA)
- CHARLTON VISITING NURSES SERVICES- GREATER SAVAN (Home Health Center, about 6 miles away; POOLER, GA)
Colleges/universities with over 2000 students nearest to Garden City:
- Savannah College of Art and Design (about 5 miles; Savannah, GA; Full-time enrollment: 9,964)
- Savannah Technical College (about 7 miles; Savannah, GA; FT enrollment: 3,677)
- South University–Savannah Online (about 8 miles; Savannah, GA; FT enrollment: 13,512)
- Savannah State University (about 8 miles; Savannah, GA; FT enrollment: 4,193)
- Armstrong Atlantic State University (about 9 miles; Savannah, GA; FT enrollment: 6,399)
- Georgia Southern University (about 43 miles; Statesboro, GA; FT enrollment: 18,824)
- College of Coastal Georgia (about 70 miles; Brunswick, GA; FT enrollment: 2,447)
Public high school in Garden City:
- GROVES HIGH SCHOOL (Students: 1,362, Location: 100 PRISCILLA D THOMAS WAY, Grades: 9-12)
Public elementary/middle schools in Garden City:
- MERCER MIDDLE SCHOOL (Students: 842, Location: 201 ROMMEL AVE, Grades: 6-8)
- GARDEN CITY ELEMENTARY SCHOOL (Students: 588, Location: 4037 KESSLER AVE, Grades: PK-5)
Points of interest:
Notable locations in Garden City: Garden City Water Pollution Control Plant (A), Garden City Fire Department (B), Garden City Fire Department Station 2 (C), Garden City - City Hall (D), Garden City Municipal Court (E). Display/hide their locations on the map
Shopping Centers: Traffic Circle Shopping Center (1), West Side Shopping Center (2). Display/hide their locations on the map
Churches in Garden City include: Bible Church (A), Dean Forest Church (B), First Mount Calvary Church (C), Zion Fair Missionary Church (D), Fellowship Assembly of God Church (E), Chapel In the Gardens Church (F), Alpha and Omega Worship Center (G), Higgins Evangelist Church (H), Good Shepherd Lutheran Church (I). Display/hide their locations on the map
Cemetery: Hillcrest Abby West Cemetery (1). Display/hide its location on the map
Birthplace of: Barrod Heggs - College football player (Maryland Terrapins).
Drinking water stations with addresses in Garden City and their reported violations in the past:
BUCKLAND HALL PLANTATION (Population served: 52, Groundwater):Past monitoring violations:
- Follow-up Or Routine LCR Tap M/R - In OCT-01-2008, Contaminant: Lead and Copper Rule. Follow-up actions: St Public Notif requested (MAR-10-2009), St Violation/Reminder Notice (MAR-10-2009), St BCA signed (JAN-07-2011), St Compliance achieved (AUG-17-2011)
- Monitoring and Reporting (DBP) - In JAN-01-2005, Contaminant: DBP Stage 1. Follow-up actions: St Violation/Reminder Notice (JUN-16-2005), St Compliance achieved (DEC-01-2010)
- Initial Tap Sampling for Pb and Cu - In JUL-01-2004, Contaminant: Lead and Copper Rule. Follow-up actions: St AO (w/o penalty) issued (MAY-10-2005), St Public Notif received (JUL-15-2005), St Compliance achieved (NOV-14-2005)
- 2 regular monitoring violations
| This city: | 2.6 people |
| Georgia: | 2.6 people |
| This city: | 63.5% |
| Whole state: | 68.5% |
| This city: | 9.2% |
| Whole state: | 5.9% |
Likely homosexual households (counted as self-reported same-sex unmarried-partner households)
- Lesbian couples: 0.8% of all households
- Gay men: 0.1% of all households
7 people in group homes intended for adults in 2010
1,109 people in state prisons in 2000
4 people in other group homes in 2000
Banks with branches in Garden City (2011 data):
- The Savannah Bank, National Association: West Chatham Branch at 100 Chatham Parkway, branch established on 1995/11/20. Info updated 2010/06/26: Bank assets: $730.3 mil, Deposits: $632.9 mil, headquarters in Savannah, GA, positive income, Commercial Lending Specialization, 9 total offices, Holding Company: Savannah Bancorp, Inc., The
- Wells Fargo Bank, National Association: Garden City Branch at 4516 Augusta Road, branch established on 1990/06/27. Info updated 2011/04/05: Bank assets: $1,161,490.0 mil, Deposits: $905,653.0 mil, headquarters in Sioux Falls, SD, positive income, 6395 total offices, Holding Company: Wells Fargo & Company
- Atlantic Coast Bank: Garden City Branch at 213 Highway 80 West, branch established on 1992/11/30. Info updated 2011/09/01: Bank assets: $789.8 mil, Deposits: $510.1 mil, headquarters in Jacksonville, FL, negative income in the last year, Mortgage Lending Specialization, 12 total offices
- SunTrust Bank: Garden City Branch at 215 Main Street, branch established on 1973/03/12. Info updated 2010/05/27: Bank assets: $171,291.7 mil, Deposits: $129,833.2 mil, headquarters in Atlanta, GA, positive income, Commercial Lending Specialization, 1716 total offices, Holding Company: Suntrust Banks, Inc.
For population 15 years and over in Garden City:
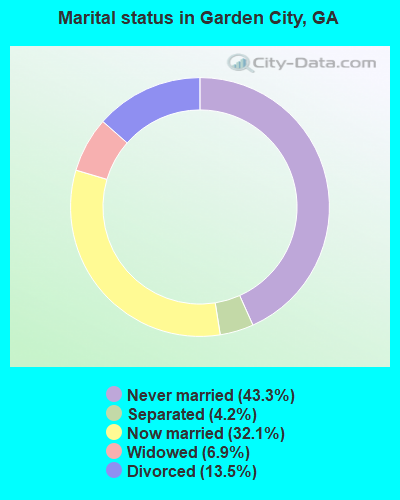
- Never married: 43.3%
- Now married: 32.1%
- Separated: 4.2%
- Widowed: 6.9%
- Divorced: 13.5%
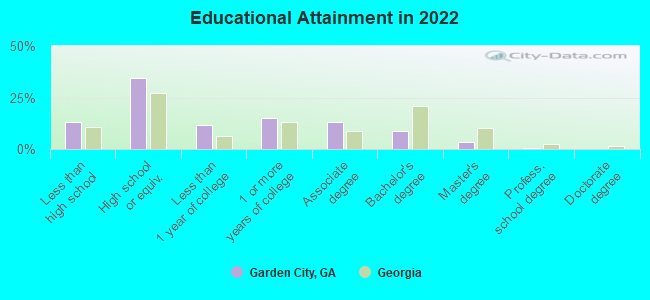
For population 25 years and over in Garden City:
- High school or higher: 87.7%
- Bachelor's degree or higher: 13.4%
- Graduate or professional degree: 4.0%
- Unemployed: 4.6%
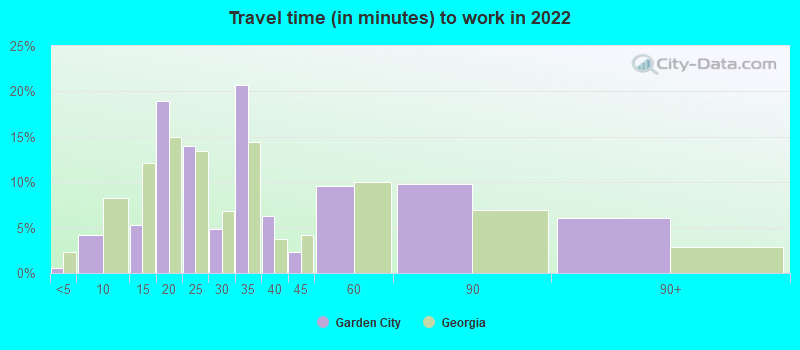
- Mean travel time to work (commute): 18.6 minutes
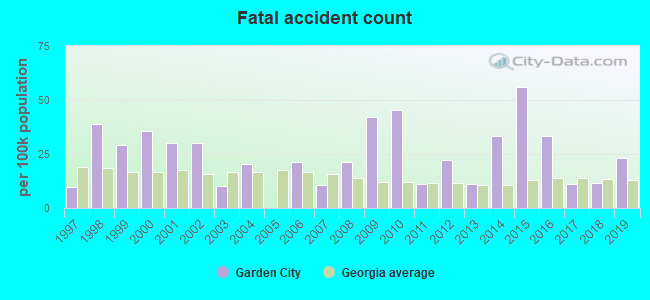
| Here: | 10.2 |
| Georgia average: | 12.2 |
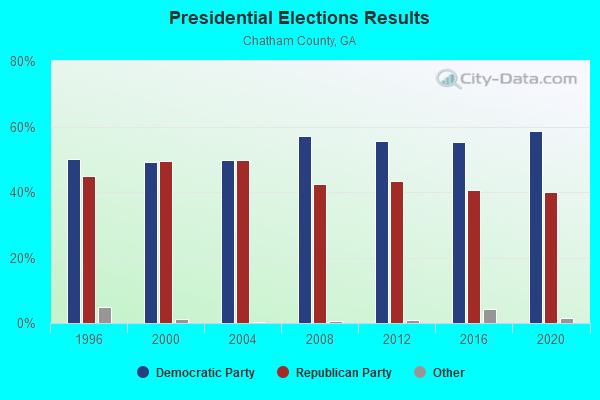
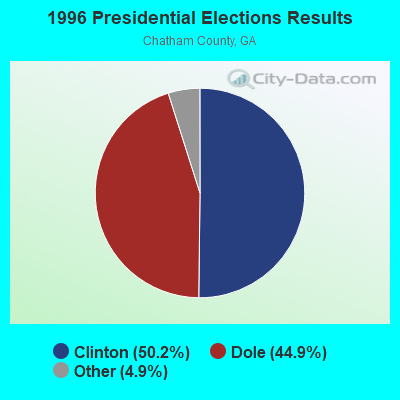
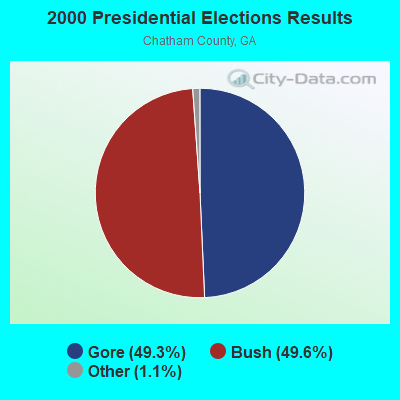
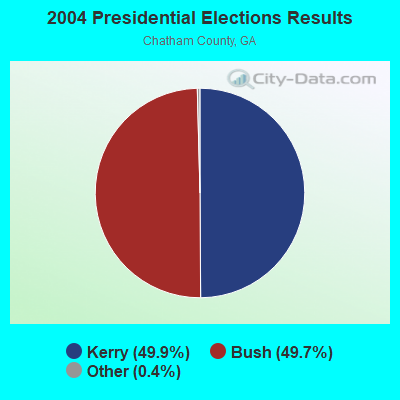

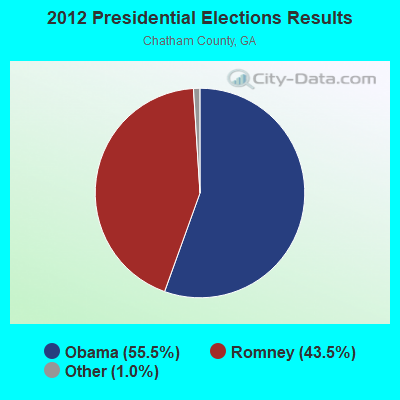
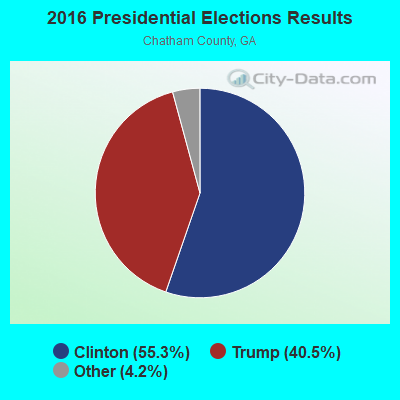
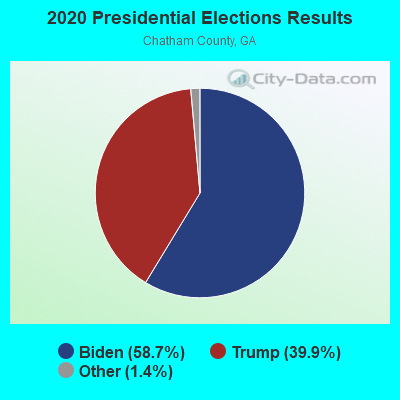
Graphs represent county-level data. Detailed 2008 Election Results
Religion statistics for Garden City, GA (based on Chatham County data)
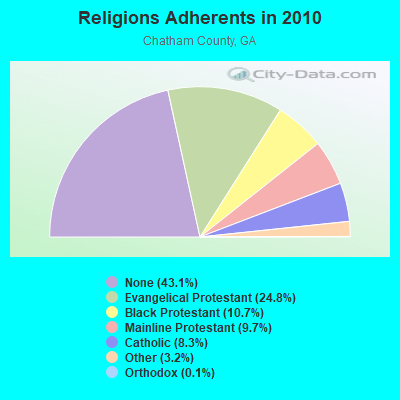
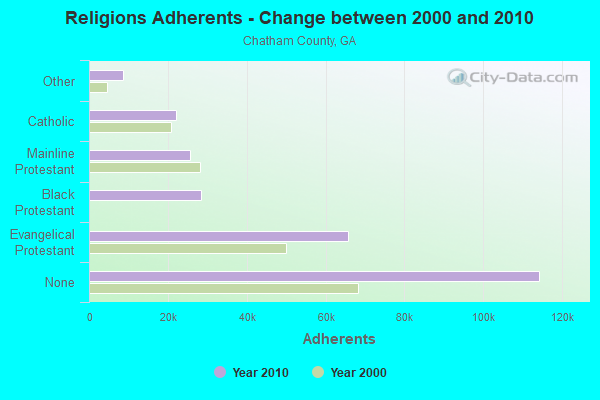
| Religion | Adherents | Congregations |
|---|---|---|
| Evangelical Protestant | 65,804 | 170 |
| Black Protestant | 28,308 | 57 |
| Mainline Protestant | 25,660 | 63 |
| Catholic | 22,109 | 10 |
| Other | 8,607 | 22 |
| Orthodox | 365 | 2 |
| None | 114,275 | - |
Food Environment Statistics:
| Chatham County: | 2.13 / 10,000 pop. |
| Georgia: | 1.91 / 10,000 pop. |
| This county: | 0.16 / 10,000 pop. |
| State: | 0.15 / 10,000 pop. |
| Chatham County: | 1.57 / 10,000 pop. |
| State: | 0.86 / 10,000 pop. |
| Chatham County: | 4.35 / 10,000 pop. |
| Georgia: | 5.12 / 10,000 pop. |
| Chatham County: | 10.70 / 10,000 pop. |
| Georgia: | 7.41 / 10,000 pop. |
| Chatham County: | 11.7% |
| Georgia: | 10.4% |
| This county: | 28.7% |
| Georgia: | 27.8% |
| This county: | 11.1% |
| Georgia: | 14.6% |
Health and Nutrition:
| This city: | 48.4% |
| Georgia: | 48.9% |
| Here: | 45.8% |
| Georgia: | 46.5% |
| This city: | 29.1 |
| Georgia: | 28.9 |
| This city: | 19.6% |
| Georgia: | 20.4% |
| Garden City: | 10.6% |
| Georgia: | 10.8% |
| Garden City: | 6.7 |
| State: | 6.7 |
| Garden City: | 32.7% |
| Georgia: | 33.5% |
| Here: | 56.2% |
| Georgia: | 56.2% |
| Here: | 81.6% |
| State: | 80.8% |
More about Health and Nutrition of Garden City, GA Residents
| Local government employment and payroll (March 2022) | |||||
| Function | Full-time employees | Monthly full-time payroll | Average yearly full-time wage | Part-time employees | Monthly part-time payroll |
|---|---|---|---|---|---|
| Police Protection - Officers | 25 | $129,259 | $62,044 | 0 | $0 |
| Firefighters | 19 | $86,625 | $54,711 | 4 | $3,846 |
| Police - Other | 14 | $34,106 | $29,234 | 0 | $0 |
| Water Supply | 10 | $44,199 | $53,039 | 0 | $0 |
| Other Government Administration | 9 | $69,097 | $92,129 | 9 | $5,198 |
| Parks and Recreation | 7 | $25,440 | $43,611 | 6 | $2,597 |
| Financial Administration | 6 | $28,097 | $56,194 | 0 | $0 |
| Fire - Other | 5 | $25,079 | $60,190 | 0 | $0 |
| Sewerage | 4 | $20,941 | $62,823 | 0 | $0 |
| Judicial and Legal | 2 | $7,309 | $43,854 | 0 | $0 |
| Other and Unallocable | 1 | $4,468 | $53,616 | 0 | $0 |
| Totals for Government | 102 | $474,620 | $55,838 | 19 | $11,642 |
Garden City government finances - Expenditure in 2017 (per resident):
- Construction - Regular Highways: $650,000 ($62.34)
Local Fire Protection: $377,000 ($36.16)
Financial Administration: $104,000 ($9.98)
General Public Buildings: $80,000 ($7.67)
Housing and Community Development: $46,000 ($4.41)
Parks and Recreation: $15,000 ($1.44)
General - Other: $1,000 ($0.10)
- Current Operations - Police Protection: $3,958,000 ($379.63)
General - Other: $3,059,000 ($293.40)
Sewerage: $2,076,000 ($199.12)
Regular Highways: $1,217,000 ($116.73)
Water Utilities: $1,000,000 ($95.91)
Central Staff Services: $941,000 ($90.26)
Parks and Recreation: $813,000 ($77.98)
Financial Administration: $654,000 ($62.73)
Solid Waste Management: $379,000 ($36.35)
Judicial and Legal Services: $180,000 ($17.26)
General Public Buildings: $67,000 ($6.43)
Housing and Community Development: $5,000 ($0.48)
- General - Interest on Debt: $251,000 ($24.07)
- Intergovernmental to Local - Other - General - Other: $45,000 ($4.32)
- Other Capital Outlay - Police Protection: $151,000 ($14.48)
Financial Administration: $83,000 ($7.96)
Regular Highways: $82,000 ($7.86)
Parks and Recreation: $31,000 ($2.97)
Local Fire Protection: $8,000 ($0.77)
- Water Utilities - Interest on Debt: $47,000 ($4.51)
Garden City government finances - Revenue in 2017 (per resident):
- Charges - Sewerage: $3,484,000 ($334.16)
Other: $933,000 ($89.49)
Solid Waste Management: $337,000 ($32.32)
Parks and Recreation: $124,000 ($11.89)
- Federal Intergovernmental - Other: $2,000 ($0.19)
- Local Intergovernmental - General Local Government Support: $2,977,000 ($285.54)
Other: $1,595,000 ($152.98)
- Miscellaneous - Fines and Forfeits: $762,000 ($73.09)
Rents: $147,000 ($14.10)
General Revenue - Other: $84,000 ($8.06)
Interest Earnings: $15,000 ($1.44)
Sale of Property: $1,000 ($0.10)
- Revenue - Water Utilities: $844,000 ($80.95)
- State Intergovernmental - Other: $341,000 ($32.71)
General Local Government Support: $49,000 ($4.70)
- Tax - Property: $1,282,000 ($122.96)
Public Utilities Sales: $861,000 ($82.58)
Insurance Premiums Sales: $549,000 ($52.66)
Occupation and Business License - Other: $461,000 ($44.22)
Other Selective Sales: $272,000 ($26.09)
Other License: $177,000 ($16.98)
Alcoholic Beverage Sales: $156,000 ($14.96)
Other: $77,000 ($7.39)
Alcoholic Beverage License: $41,000 ($3.93)
Garden City government finances - Debt in 2017 (per resident):
- Long Term Debt - Outstanding Unspecified Public Purpose: $7,646,000 ($733.36)
Beginning Outstanding - Unspecified Public Purpose: $7,150,000 ($685.79)
Issue, Unspecified Public Purpose: $858,000 ($82.29)
Retired Unspecified Public Purpose: $361,000 ($34.62)
Garden City government finances - Cash and Securities in 2017 (per resident):
- Other Funds - Cash and Securities: $8,662,000 ($830.81)
- Sinking Funds - Cash and Securities: $95,000 ($9.11)
10.12% of this county's 2021 resident taxpayers lived in other counties in 2020 ($62,856 average adjusted gross income)
| Here: | 10.12% |
| Georgia average: | 10.21% |
0.11% of residents moved from foreign countries ($541 average AGI)
Chatham County: 0.11% Georgia average: 0.04%
Top counties from which taxpayers relocated into this county between 2020 and 2021:
| from Effingham County, GA | |
| from Bryan County, GA | |
| from Liberty County, GA |
9.33% of this county's 2020 resident taxpayers moved to other counties in 2021 ($58,903 average adjusted gross income)
| Here: | 9.33% |
| Georgia average: | 9.60% |
0.06% of residents moved to foreign countries ($359 average AGI)
Chatham County: 0.06% Georgia average: 0.03%
Top counties to which taxpayers relocated from this county between 2020 and 2021:
| to Effingham County, GA | |
| to Bryan County, GA | |
| to Liberty County, GA |
| Businesses in Garden City, GA | ||||
| Name | Count | Name | Count | |
|---|---|---|---|---|
| Advance Auto Parts | 1 | KFC | 1 | |
| AutoZone | 1 | McDonald's | 1 | |
| Burger King | 1 | Nissan | 1 | |
| CVS | 1 | Payless | 1 | |
| Cricket Wireless | 1 | Penske | 1 | |
| DHL | 1 | Pizza Hut | 1 | |
| Dairy Queen | 1 | SONIC Drive-In | 1 | |
| Domino's Pizza | 1 | Subway | 3 | |
| FedEx | 1 | U-Haul | 2 | |
| Ford | 1 | Waffle House | 1 | |
| H&R Block | 1 | Walgreens | 1 | |
| Honda | 1 | |||
Strongest AM radio stations in Garden City:
- WTKS (1290 AM; 5 kW; SAVANNAH, GA; Owner: CAPSTAR TX LIMITED PARTNERSHIP)
- WJLG (900 AM; 4 kW; SAVANNAH, GA; Owner: CUMULUS LICENSING CORP.)
- WBMQ (630 AM; 5 kW; SAVANNAH, GA; Owner: CUMULUS LICENSING CORP.)
- WSOK (1230 AM; 1 kW; SAVANNAH, GA; Owner: CAPSTAR TX LIMITED PARTNERSHIP)
- WHGM (1400 AM; 1 kW; SAVANNAH, GA; Owner: WHGM RADIO, INC.)
- WOKV (690 AM; 50 kW; JACKSONVILLE, FL; Owner: COX RADIO, INC.)
- WIQB (1050 AM; 25 kW; CONWAY, SC; Owner: CUMULUS LICENSING CORP.)
- WBAJ (890 AM; daytime; 50 kW; BLYTHEWOOD, SC; Owner: FAMILY FIRST)
- WCEO (840 AM; daytime; 50 kW; COLUMBIA, SC; Owner: EASTERN BROADCASTING GROUP, INC.)
- WFVR (910 AM; 50 kW; VALDOSTA, GA; Owner: RAMA COMMUNICATIONS, INC.)
- WOBS (1530 AM; daytime; 50 kW; JACKSONVILLE, FL; Owner: WORD BROADCASTING NETWORK, INC.)
- WMAC (940 AM; 50 kW; MACON, GA; Owner: CUMULUS LICENSING CORP.)
- WGSR (1570 AM; 50 kW; FERNANDINA BEACH, FL; Owner: RJM COMMUNICATIONS, INC)
Strongest FM radio stations in Garden City:
- W206AT (89.1 FM; SAVANNAH, GA; Owner: CALVARY CHAPEL OF TWIN FALLS, INC.)
- WSVH (91.1 FM; SAVANNAH, GA; Owner: GEORGIA PUBLIC TELECOMMUNICATIONS COMMISSION)
- WZAT (102.1 FM; SAVANNAH, GA; Owner: CUMULUS LICENSING CORP.)
- WAEV (97.3 FM; SAVANNAH, GA; Owner: CAPSTAR TX LIMITED PARTNERSHIP)
- WQBT (94.1 FM; SAVANNAH, GA; Owner: CAPSTAR TX LIMITED PARTNERSHIP)
- WJCL-FM (96.5 FM; SAVANNAH, GA; Owner: CUMULUS LICENSING CORP.)
- WIXV (95.5 FM; SAVANNAH, GA; Owner: CUMULUS LICENSING CORP.)
- WEAS-FM (93.1 FM; SAVANNAH, GA; Owner: CUMULUS LICENSING CORP.)
- W201AU (88.1 FM; SAVANNAH, GA; Owner: FAMILY STATIONS, INC.)
- WLXP (88.1 FM; SAVANNAH, GA; Owner: CHRISTIAN MULTIMEDIA NETWORK, INC.)
- WLVH (101.1 FM; HARDEEVILLE, SC; Owner: CAPSTAR TX LIMITED PARTNERSHIP)
- WYFS (89.5 FM; SAVANNAH, GA; Owner: BIBLE BROADCASTING NETWORK, INC.)
- WLFS (91.9 FM; PORT WENTWORTH, GA; Owner: RADIO TRAINING NETWORK, INC)
- WGZR (106.9 FM; BLUFFTON, SC; Owner: MONTEREY LICENSES, LLC)
- WFXH-FM (106.1 FM; HILTON HEAD ISLAND, SC; Owner: MONTEREY LICENSES, LLC)
- WHCJ (90.3 FM; SAVANNAH, GA; Owner: SAVANNAH STATE UNIVERSITY)
- WYKZ (98.7 FM; BEAUFORT, SC; Owner: CAPSTAR TX LIMITED PARTNERSHIP)
- WRHQ (105.3 FM; RICHMOND HILL, GA; Owner: THOROUGHBRED COMMUNICATIONS, INC.)
- WLOW (107.9 FM; PORT ROYAL, SC; Owner: MONTEREY LICENSES, LLC)
- WSIS (103.9 FM; SPRINGFIELD, GA; Owner: CUMULUS LICENSING CORP.)
TV broadcast stations around Garden City:
- WGSA-CA (Channel 50; SAVANNAH, GA; Owner: SOUTHERN TV CORPORATION)
- WSAV-TV (Channel 3; SAVANNAH, GA; Owner: MEDIA GENERAL COMMUNICATIONS, INC.)
- WXSX-LP (Channel 13; SAVANNAH, GA; Owner: THE BOX WORLDWIDE LLC)
- WTOC-TV (Channel 11; SAVANNAH, GA; Owner: RAYCOM AMERICA, INC.)
- W55AW (Channel 55; SAVANNAH, GA; Owner: CHANNEL AMERICA LPTV LIC. SUBSIDIARY)
- WJCL (Channel 22; SAVANNAH, GA; Owner: PIEDMONT TELEVISION OF SAVANNAH LICENSE LLC)
- WTGS (Channel 28; HARDEEVILLE, SC; Owner: BLUENOSE BROADCASTING OF SAVANNAH LLC)
- W57CT (Channel 57; SAVANNAH, GA; Owner: TRINITY BROADCASTING NETWORK)
- WHDS-LP (Channel 32; SAVANNAH, GA; Owner: BROADCAST CORP. OF AMERICA)
- WVAN-TV (Channel 9; SAVANNAH, GA; Owner: GEORGIA PUBLIC TELECOMMUNICATIONS COMMISSION)
- WGSA (Channel 34; BAXLEY, GA; Owner: SOUTHERN TV CORPORATION)
- W53BX (Channel 53; HILTON HEAD ISLAND, SC; Owner: WHHI-TV, INC.)
- W35AY (Channel 35; HILTON HEAD ISLAND, SC; Owner: MYRON K. HINES)
- National Bridge Inventory (NBI) Statistics
- 31Number of bridges
- 541ft / 165mTotal length
- $202,430,000Total costs
- 578,510Total average daily traffic
- 18,731Total average daily truck traffic
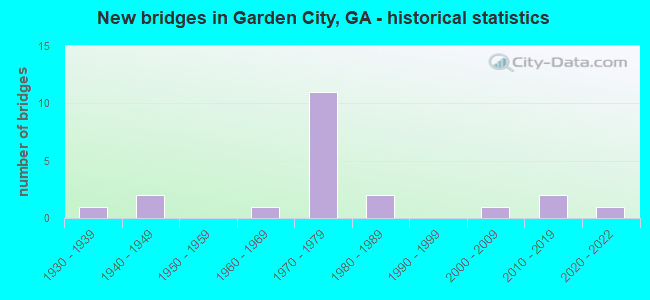
- New bridges - historical statistics
- 11930-1939
- 21940-1949
- 11960-1969
- 111970-1979
- 21980-1989
- 12000-2009
- 22010-2019
- 12020-2022
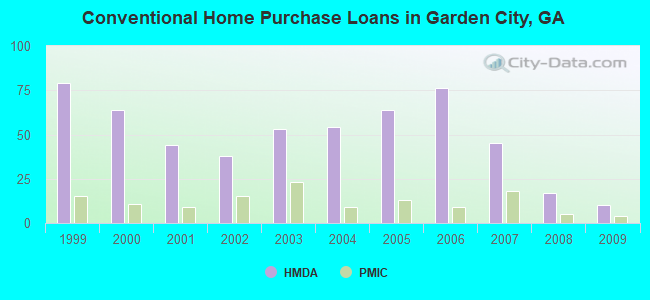
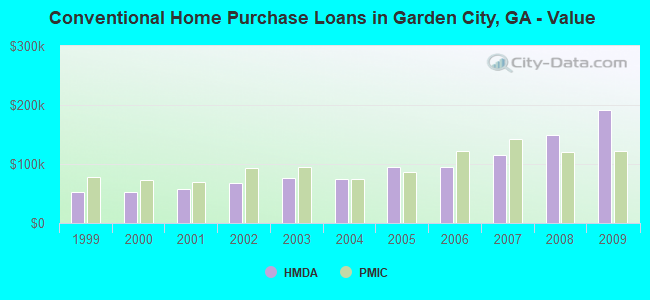
| Home Mortgage Disclosure Act Aggregated Statistics For Year 2009 (Based on 2 full and 2 partial tracts) | ||||||||||||||
| A) FHA, FSA/RHS & VA Home Purchase Loans | B) Conventional Home Purchase Loans | C) Refinancings | D) Home Improvement Loans | E) Loans on Dwellings For 5+ Families | F) Non-occupant Loans on < 5 Family Dwellings (A B C & D) | G) Loans On Manufactured Home Dwelling (A B C & D) | ||||||||
|---|---|---|---|---|---|---|---|---|---|---|---|---|---|---|
| Number | Average Value | Number | Average Value | Number | Average Value | Number | Average Value | Number | Average Value | Number | Average Value | Number | Average Value | |
| LOANS ORIGINATED | 19 | $140,463 | 10 | $191,315 | 53 | $141,895 | 0 | $0 | 0 | $0 | 14 | $235,836 | 6 | $239,530 |
| APPLICATIONS APPROVED, NOT ACCEPTED | 0 | $0 | 1 | $64,980 | 3 | $79,977 | 1 | $63,870 | 0 | $0 | 0 | $0 | 0 | $0 |
| APPLICATIONS DENIED | 8 | $128,046 | 4 | $71,545 | 32 | $113,145 | 10 | $25,634 | 1 | $2,620,210 | 4 | $80,830 | 3 | $45,103 |
| APPLICATIONS WITHDRAWN | 2 | $33,490 | 4 | $186,415 | 17 | $140,589 | 0 | $0 | 0 | $0 | 2 | $115,460 | 0 | $0 |
| FILES CLOSED FOR INCOMPLETENESS | 0 | $0 | 0 | $0 | 5 | $132,698 | 0 | $0 | 0 | $0 | 1 | $61,190 | 0 | $0 |
Detailed HMDA statistics for the following Tracts: 0105.01 , 0106.01, 0106.03
| Private Mortgage Insurance Companies Aggregated Statistics For Year 2009 (Based on 1 full and 2 partial tracts) | ||
| A) Conventional Home Purchase Loans | ||
|---|---|---|
| Number | Average Value | |
| LOANS ORIGINATED | 4 | $121,770 |
| APPLICATIONS APPROVED, NOT ACCEPTED | 1 | $235,930 |
| APPLICATIONS DENIED | 1 | $52,210 |
| APPLICATIONS WITHDRAWN | 0 | $0 |
| FILES CLOSED FOR INCOMPLETENESS | 0 | $0 |
Detailed PMIC statistics for the following Tracts: 0105.01 , 0106.01, 0106.03
2002 - 2018 National Fire Incident Reporting System (NFIRS) incidents
- Fire incident types reported to NFIRS in Garden City, GA
- 49942.1%Outside Fires
- 43536.7%Structure Fires
- 23319.7%Mobile Property/Vehicle Fires
- 171.4%Other
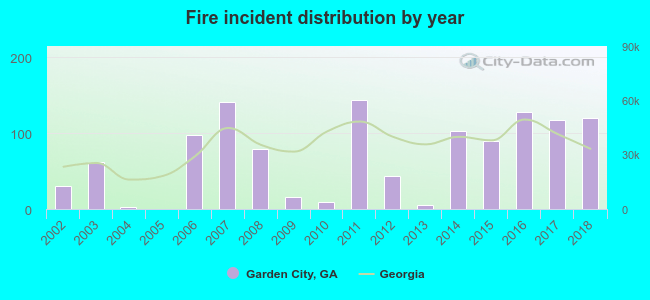 According to the data from the years 2002 - 2018 the average number of fires per year is 70. The highest number of fires - 143 took place in 2011, and the least - 0 in 2005. The data has a growing trend.
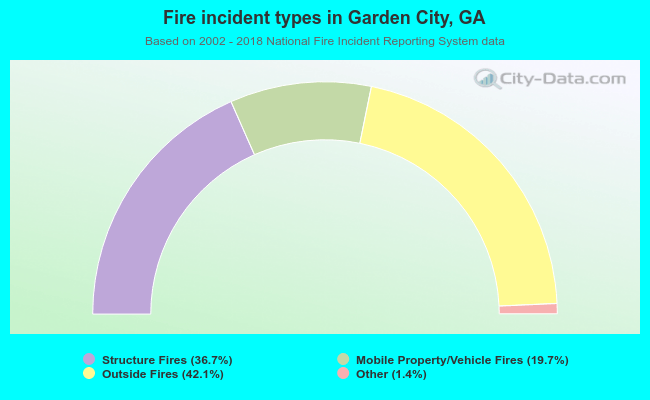 When looking into fire subcategories, the most reports belonged to: Outside Fires (42.1%), and Structure Fires (36.7%).
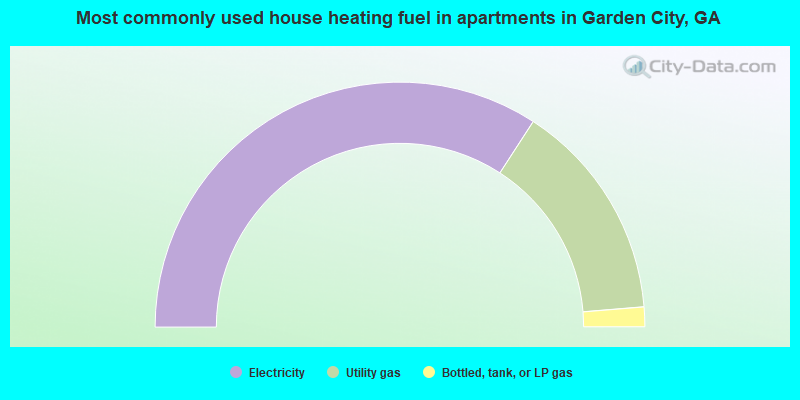
- 68.1%Electricity
- 27.8%Utility gas
- 2.8%Bottled, tank, or LP gas
- 1.1%Wood
- 0.3%No fuel used
- 68.4%Electricity
- 29.1%Utility gas
- 2.6%Bottled, tank, or LP gas
Garden City compared to Georgia state average:
- Median household income below state average.
- Median house value below state average.
- Unemployed percentage significantly below state average.
- Hispanic race population percentage above state average.
- Median age below state average.
- Renting percentage above state average.
- Length of stay since moving in significantly above state average.
- Institutionalized population percentage significantly above state average.
- Percentage of population with a bachelor's degree or higher below state average.
Garden City on our top lists:
- #2 on the list of "Top 101 cities with the lowest percentage of workers working at home, population 5,000+"
- #34 on the list of "Top 101 cities with the largest percentage population decrease from 2000 (population 5,000+)"
- #62 on the list of "Top 100 cities with declining populations from 2000 to 2014 (pop. 5,000+)"
- #81 on the list of "Top 101 cities with the highest number of assaults per 100,000 residents, excludes tourist destinations and others with a lot of outsiders visiting based on city industries data (population 5,000+)"
- #93 on the list of "Top 101 cities with largest percentage of females in occupations: fire fighting and prevention workers including supervisors (population 5,000+)"
- #47 (31415) on the list of "Top 101 zip codes with the lowest 2012 average net capital gain/loss (pop 5,000+)"
- #62 (31415) on the list of "Top 101 zip codes with the smallest percentage of taxpayers reporting net capital gain/loss in 2012 (pop 1,000+)"
- #70 (31415) on the list of "Top 101 zip codes with the lowest average reported salary/wage in 2012 (pop 5,000+)"
- #95 (31415) on the list of "Top 101 zip codes with the lowest 2012 average Adjusted Gross Income (AGI) for individuals (pop 5,000+)"
- #95 (31415) on the list of "Top 101 zip codes with the smallest percentage of taxpayers reporting taxable interest in 2012 (pop 5,000+)"
- #8 on the list of "Top 101 counties with the lowest lead air pollution readings in 2012 (µg/m3)"
- #20 on the list of "Top 101 counties with the highest lead air pollution readings in 2012 (µg/m3)"
- #20 on the list of "Top 101 counties with the highest Sulfur Oxides Annual air pollution readings in 2012 (µg/m3)"
- #32 on the list of "Top 101 counties with the largest decrease in the number of deaths per 1000 residents 2000-2006 to 2007-2013 (pop. 50,000+)"
- #33 on the list of "Top 101 counties with the largest number of people moving in compared to moving out (pop. 50,000+)"

|
Total of 7 patent applications in 2008-2024.