Estimated zip code population in 2022: 21,123 Zip code population in 2010: 18,910 Zip code population in 2000: 14,926
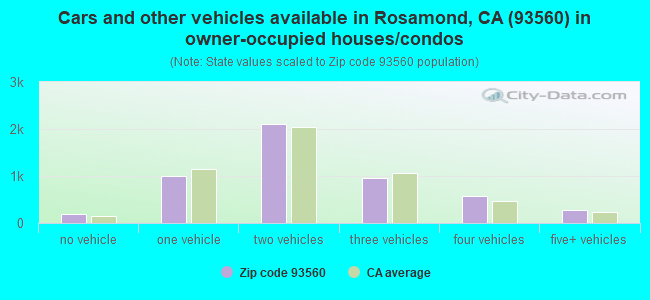
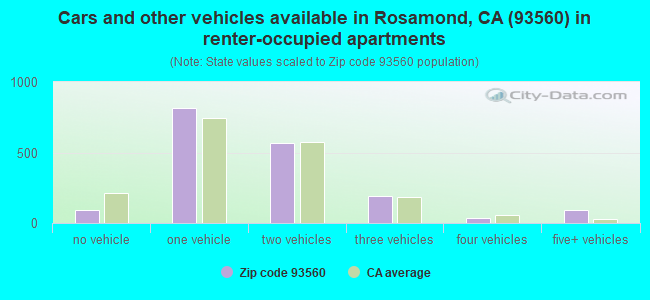
Houses and condos: 7,520 Renter-occupied apartments: 1,792
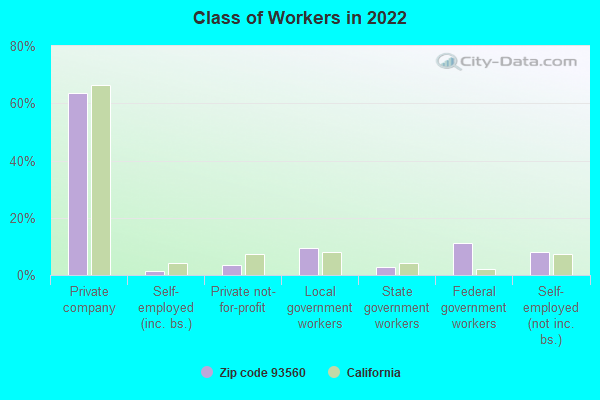
% of renters here:
26%
State:
44%
March 2022 cost of living index in zip code 93560: 91.0 (less than average, U.S. average is 100)
Land area: 159.6 sq. mi. Water area: 0.3 sq. mi.
Population density: 132 people per square mile
(very low).
OSM Map
General Map
Google Map
MSN Map
OSM Map
General Map
Google Map
MSN Map
OSM Map
General Map
Google Map
MSN Map
OSM Map
General Map
Google Map
MSN Map
Please wait while loading the map...
Real estate property taxes paid for housing units in 2022:
This zip code:
0.8% ($2,714)
California:
0.7% ($4,831)
Median real estate property taxes paid for housing units with mortgages in 2022: $3,022 (0.9%) Median real estate property taxes paid for housing units with no mortgage in 2022: $1,278 (0.6%)
Averages for the 2020 tax year for zip code 93560, filed in 2021:
Average Adjusted Gross Income (AGI) in 2020: $57,224 (Individual Income Tax Returns)
Here:
$57,224
State:
$95,910
Salary/wage: $54,587 (reported on 83.8% of returns)
Here:
$54,587
State:
$77,331
(% of AGI for various income ranges: 1069.3% for AGIs below $25k, 3665.8% for AGIs $25k-50k, 6727.0% for AGIs $50k-75k, 10153.3% for AGIs $75k-100k, 17886.2% for AGIs $100k-200k, 48912.9% for AGIs over 200k)
Taxable interest for individuals: $379 (reported on 30.6% of returns)
This zip code:
$379
California:
$2,294
(% of AGI for various income ranges: 4.4% for AGIs below $25k, 8.2% for AGIs $25k-50k, 15.7% for AGIs $50k-75k, 16.5% for AGIs $75k-100k, 52.6% for AGIs $100k-200k, 135.7% for AGIs over 200k)
Ordinary dividends: $1,536 (reported on 8.0% of returns)
Here:
$1,536
State:
$10,949
(% of AGI for various income ranges: 4.6% for AGIs below $25k, 6.9% for AGIs $25k-50k, 11.2% for AGIs $50k-75k, 19.4% for AGIs $75k-100k, 51.1% for AGIs $100k-200k, 322.9% for AGIs over 200k)
Net capital gain/loss in AGI: +$6,858 (reported on 9.0% of returns)
Here:
+$6,858
State:
+$49,306
(% of AGI for various income ranges: 1.2% for AGIs below $25k, 4.2% for AGIs $25k-50k, 30.8% for AGIs $50k-75k, 40.1% for AGIs $75k-100k, 199.5% for AGIs $100k-200k, 4831.4% for AGIs over 200k)
Profit/loss from business: +$5,959 (reported on 13.9% of returns)
Here:
+$5,959
State:
+$15,671
(% of AGI for various income ranges: 137.7% for AGIs below $25k, 109.0% for AGIs $25k-50k, 120.5% for AGIs $50k-75k, 41.8% for AGIs $75k-100k, 71.2% for AGIs $100k-200k, 352.9% for AGIs over 200k)
Taxable individual retirement arrangement distribution: $13,207 (reported on 3.1% of returns)
93560:
$13,207
California:
$23,505
(% of AGI for various income ranges: 16.0% for AGIs below $25k, 26.1% for AGIs $25k-50k, 46.2% for AGIs $50k-75k, 70.5% for AGIs $75k-100k, 234.3% for AGIs $100k-200k)
Total itemized deductions: $25,545 (reported on 10.6% of returns)
Here:
$25,545
State:
$39,517
(% of AGI for various income ranges: 35.7% for AGIs below $25k, 139.8% for AGIs $25k-50k, 426.9% for AGIs $50k-75k, 654.1% for AGIs $75k-100k, 1143.8% for AGIs $100k-200k, 3827.1% for AGIs over 200k)
Charity contributions: $5,789 (reported on 8.1% of returns)
Here:
$5,789
State:
$12,598
(% of AGI for various income ranges: 19.8% for AGIs $25k-50k, 49.7% for AGIs $50k-75k, 67.6% for AGIs $75k-100k, 245.1% for AGIs $100k-200k, 1364.3% for AGIs over 200k)
Taxes paid: $8,053 (reported on 10.5% of returns)
93560:
$8,053
State:
$8,807
(% of AGI for various income ranges: 7.2% for AGIs below $25k, 33.1% for AGIs $25k-50k, 119.8% for AGIs $50k-75k, 231.4% for AGIs $75k-100k, 393.6% for AGIs $100k-200k, 1097.1% for AGIs over 200k)
Earned income credit: $2,550 (reported on 20.6% of returns)
Here:
$2,550
State:
$2,074
(% of AGI for various income ranges: 135.0% for AGIs below $25k, 93.7% for AGIs $25k-50k, 1.4% for AGIs $50k-75k)
Percentage of individuals using paid preparers for their 2020 taxes: 94.2%
Here:
94%
State:
92%
(% for various income ranges: 92.5% for AGIs below $25k, 94.7% for AGIs $25k-50k, 93.8% for AGIs $50k-75k, 96.2% for AGIs $75k-100k, 95.4% for AGIs $100k-200k, 100.0% for AGIs over 200k)
Averages for the 2012 tax year for zip code 93560, filed in 2013:
Average Adjusted Gross Income (AGI) in 2012: $49,705 (Individual Income Tax Returns)
Here:
$49,705
State:
$72,726
Salary/wage: $48,176 (reported on 85.4% of returns)
Here:
$48,176
State:
$59,079
(% of AGI for various income ranges: 68.3% for AGIs below $25k, 84.6% for AGIs $25k-50k, 85.4% for AGIs $50k-75k, 87.5% for AGIs $75k-100k, 84.5% for AGIs $100k-200k, 67.1% for AGIs over 200k)
Taxable interest for individuals: $374 (reported on 33.0% of returns)
This zip code:
$374
California:
$2,146
(% of AGI for various income ranges: 0.4% for AGIs below $25k, 0.3% for AGIs $25k-50k, 0.2% for AGIs $50k-75k, 0.3% for AGIs $75k-100k, 0.2% for AGIs $100k-200k, 0.1% for AGIs over 200k)
Ordinary dividends: $1,289 (reported on 9.7% of returns)
Here:
$1,289
State:
$9,308
(% of AGI for various income ranges: 0.2% for AGIs below $25k, 0.2% for AGIs $25k-50k, 0.2% for AGIs $50k-75k, 0.2% for AGIs $75k-100k, 0.2% for AGIs $100k-200k, 0.9% for AGIs over 200k)
Net capital gain/loss in AGI: +$1,590 (reported on 6.6% of returns)
Here:
+$1,590
State:
+$30,460
(% of AGI for various income ranges: 0.1% for AGIs $75k-100k, 0.4% for AGIs $100k-200k, 1.8% for AGIs over 200k)
Profit/loss from business: +$7,180 (reported on 14.5% of returns)
Here:
+$7,180
State:
+$17,064
(% of AGI for various income ranges: 15.8% for AGIs below $25k, 1.4% for AGIs $25k-50k, 0.4% for AGIs $50k-75k, 0.3% for AGIs $75k-100k, 0.4% for AGIs $100k-200k)
Taxable individual retirement arrangement distribution: $13,697 (reported on 4.4% of returns)
93560:
$13,697
California:
$19,557
(% of AGI for various income ranges: 1.2% for AGIs below $25k, 1.0% for AGIs $25k-50k, 0.8% for AGIs $50k-75k, 1.3% for AGIs $75k-100k, 1.8% for AGIs $100k-200k)
Total itemized deductions: $20,303 (24% of AGI, reported on 35.7% of returns)
Here:
$20,303
State:
$34,004
Here:
23.9% of AGI
State:
22.7% of AGI
(% of AGI for various income ranges: 6.4% for AGIs below $25k, 11.7% for AGIs $25k-50k, 14.8% for AGIs $50k-75k, 15.9% for AGIs $75k-100k, 17.9% for AGIs $100k-200k, 14.7% for AGIs over 200k)
Charity contributions: $2,868 (reported on 29.9% of returns)
Here:
$2,868
State:
$4,659
(% of AGI for various income ranges: 0.6% for AGIs below $25k, 1.4% for AGIs $25k-50k, 1.5% for AGIs $50k-75k, 1.8% for AGIs $75k-100k, 2.2% for AGIs $100k-200k, 2.7% for AGIs over 200k)
Taxes paid: $6,322 (reported on 35.4% of returns)
93560:
$6,322
State:
$14,448
(% of AGI for various income ranges: 1.2% for AGIs below $25k, 2.4% for AGIs $25k-50k, 4.0% for AGIs $50k-75k, 4.9% for AGIs $75k-100k, 6.5% for AGIs $100k-200k, 6.8% for AGIs over 200k)
Earned income credit: $2,697 (reported on 24.3% of returns)
Here:
$2,697
State:
$2,286
(% of AGI for various income ranges: 10.8% for AGIs below $25k, 1.4% for AGIs $25k-50k)
Percentage of individuals using paid preparers for their 2012 taxes: 60.4%
Here:
60%
State:
64%
(% for various income ranges: 61.8% for AGIs below $25k, 59.0% for AGIs $25k-50k, 59.8% for AGIs $50k-75k, 56.4% for AGIs $75k-100k, 62.2% for AGIs $100k-200k, 71.4% for AGIs over 200k)
Averages for the 2004 tax year for zip code 93560, filed in 2005:
Average Adjusted Gross Income (AGI) in 2004: $42,822 (Individual Income Tax Returns)
Here:
$42,822
State:
$58,600
Salary/wage: $41,801 (reported on 88.7% of returns)
Here:
$41,801
State:
$49,455
(% of AGI for various income ranges: 111.2% for AGIs below $10k, 78.9% for AGIs $10k-25k, 86.7% for AGIs $25k-50k, 90.4% for AGIs $50k-75k, 89.0% for AGIs $75k-100k, 81.8% for AGIs over 100k)
Taxable interest for individuals: $493 (reported on 40.9% of returns)
This zip code:
$493
California:
$2,365
(% of AGI for various income ranges: 1.8% for AGIs below $10k, 0.9% for AGIs $10k-25k, 0.6% for AGIs $25k-50k, 0.3% for AGIs $50k-75k, 0.3% for AGIs $75k-100k, 0.4% for AGIs over 100k)
Taxable dividends: $775 (reported on 12.5% of returns)
Here:
$775
State:
$4,746
(% of AGI for various income ranges: 0.8% for AGIs below $10k, 0.3% for AGIs $10k-25k, 0.2% for AGIs $25k-50k, 0.2% for AGIs $50k-75k, 0.2% for AGIs $75k-100k, 0.3% for AGIs over 100k)
Net capital gain/loss: +$5,770 (reported on 9.2% of returns)
Here:
+$5,770
State:
+$23,418
(% of AGI for various income ranges: -0.8% for AGIs below $10k, -0.3% for AGIs $10k-25k, 0.3% for AGIs $25k-50k, 0.6% for AGIs $50k-75k, 0.8% for AGIs $75k-100k, 4.1% for AGIs over 100k)
Profit/loss from business: +$6,230 (reported on 12.5% of returns)
Here:
+$6,230
State:
+$16,826
(% of AGI for various income ranges: 12.6% for AGIs below $10k, 5.2% for AGIs $10k-25k, 2.1% for AGIs $25k-50k, 0.9% for AGIs $50k-75k, 1.1% for AGIs $75k-100k, 1.1% for AGIs over 100k)
IRA payment deduction: $2,029 (reported on 2.2% of returns)
93560:
$2,029
California:
$3,192
(% of AGI for various income ranges: 0.1% for AGIs $10k-25k, 0.1% for AGIs $25k-50k, 0.1% for AGIs $50k-75k, 0.1% for AGIs $75k-100k, 0.1% for AGIs over 100k)
Total itemized deductions: $17,531 (26% of AGI, reported on 43.2% of returns)
Here:
$17,531
State:
$28,113
Here:
26.0% of AGI
State:
25.3% of AGI
(% of AGI for various income ranges: 16.5% for AGIs below $10k, 10.4% for AGIs $10k-25k, 16.6% for AGIs $25k-50k, 19.3% for AGIs $50k-75k, 19.9% for AGIs $75k-100k, 18.1% for AGIs over 100k)
Charity contributions deductions: $2,600 (4% of AGI, reported on 38.9% of returns)
Here:
$2,600
State:
$3,923
Here:
3.8% of AGI
State:
3.3% of AGI
(% of AGI for various income ranges: 0.8% for AGIs below $10k, 1.1% for AGIs $10k-25k, 1.9% for AGIs $25k-50k, 2.6% for AGIs $50k-75k, 2.8% for AGIs $75k-100k, 2.8% for AGIs over 100k)
Total tax: $4,961 (reported on 74.4% of returns)
93560:
$4,961
State:
$10,761
(% of AGI for various income ranges: 4.1% for AGIs below $10k, 3.7% for AGIs $10k-25k, 5.4% for AGIs $25k-50k, 7.7% for AGIs $50k-75k, 9.9% for AGIs $75k-100k, 14.0% for AGIs over 100k)
Earned income credit: $1,849 (reported on 18.1% of returns)
Here:
$1,849
State:
$1,763
Percentage of individuals using paid preparers for their 2004 taxes: 66.8%
Here:
67%
State:
66%
(% for various income ranges: 57.7% for AGIs below $10k, 69.0% for AGIs $10k-25k, 70.5% for AGIs $25k-50k, 67.0% for AGIs $50k-75k, 67.4% for AGIs $75k-100k, 64.6% for AGIs over 100k)
Likely homosexual households (counted as self-reported same-sex unmarried-partner households)
Lesbian couples: 0.1% of all households
Gay men: 0.0% of all households
Household received Food Stamps/SNAP in the past 12 months: 1,065 Household did not receive Food Stamps/SNAP in the past 12 months: 5,852
Women who had a birth in the past 12 months: 322 (259 now married, 62 unmarried) Women who did not have a birth in the past 12 months: 5,151 (2,073 now married, 3,076 unmarried)
Housing units in zip code 93560 with a mortgage: 3,552 (238 second mortgage, 11 home equity loan, 131 both second mortgage and home equity loan) Median monthly owner costs for units with a mortgage: $1,778 Median monthly owner costs for units without a mortgage: $615
Residents with income below the poverty level in 2022:
This zip code:
14.5%
Whole state:
12.2%
Residents with income below 50% of the poverty level in 2022:
This zip code:
7.3%
Whole state:
6.2%
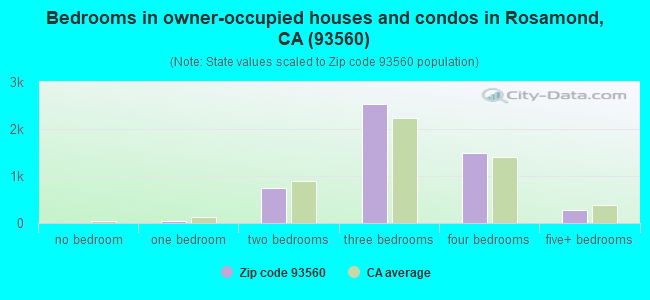
Median number of rooms in houses and condos:
Here:
6.0
State:
6.0
Median number of rooms in apartments:
Here:
4.7
State:
3.9
Notable locations in this zip code not listed on our city pages
3,769 married couples with children.
1,621 single-parent households (195 men, 1,426 women).
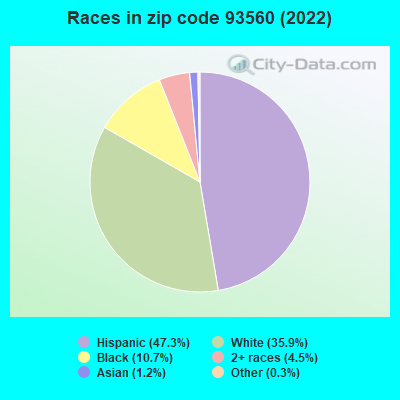
66.1% of residents of 93560 zip code speak English at home.
31.0% of residents speak Spanish at home (65% very well, 14% well, 12% not well, 8% not at all).
1.1% of residents speak other Indo-European language at home (97% very well, 3% well).
1.0% of residents speak Asian or Pacific Island language at home (61% very well, 36% well, 3% not well).
0.3% of residents speak other language at home (100% very well).
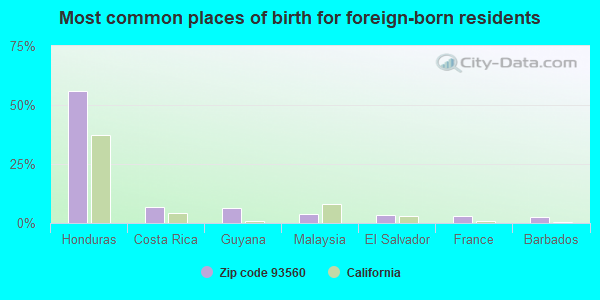
Foreign born population: 2,155 (10.2%) (52.8% of them are naturalized citizens)
This zip code:
10.2%
Whole state:
26.7%
56%Honduras
7%Costa Rica
6%Guyana
4%Malaysia
3%El Salvador
3%France
2%Barbados
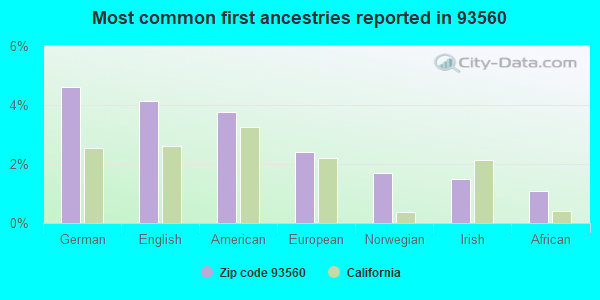
5%German
4%English
4%American
2%European
2%Norwegian
1%Irish
1%African
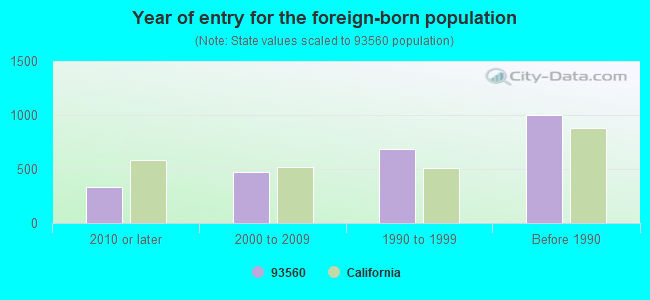
Year of entry for the foreign-born population
3302010 or later
4752000 to 2009
6861990 to 1999
1,002Before 1990
Facilities with environmental interests located in this zip code:
HAMILTON ELEMENTARY (2925 ROSAMOND BLVD. in ROSAMOND, CA)
(National Center for Education Statistics) - STATE ID-6061212 Organizations: SOUTHERN KERN UNIFIED (SCHOOL DISTRICT)
LINCOLN (ABRAHAM) ALTERNATIVE (3056 GLENDOWER in ROSAMOND, CA)
(National Center for Education Statistics) - STATE ID-1530377 Organizations: SOUTHERN KERN UNIFIED (SCHOOL DISTRICT)
CHEMICAL MILLING INTERNATIONAL CORPORATION (1400 ORANGE ST. in ROSAMOND, CA)
Large Quantity Generators, more that 1000 kg of hazardous waste/month (Resource Conservation and Recovery Act (tracking hazardous waste)) TRI REPORTER (Tracking of toxic chemicals releasing facilities) Business SIC classification: AIRCRAFT PARTS AND AUXILIARY EQUIPMENT Business NAICS classification: OTHER COMMERCIAL AND SERVICE INDUSTRY MACHINERY MANUFACTURING.
FRANKS CLEANERS (2650 DIAMOND in ROSAMOND, CA)
Small Quantity Generators, between 100 kg and 1000 kg of hazardous waste/month (Resource Conservation and Recovery Act (tracking hazardous waste))
JOHN ALEXANDER RESEARCH (1753 SIERRA HWY in ROSAMOND, CA)
Small Quantity Generators, between 100 kg and 1000 kg of hazardous waste/month (Resource Conservation and Recovery Act (tracking hazardous waste))
CHEVRON STATION 91093 (2072 ROSAMOND BLVD in ROSAMOND, CA)
Small Quantity Generators, between 100 kg and 1000 kg of hazardous waste/month (Resource Conservation and Recovery Act (tracking hazardous waste)) - notification Organizations: CHEVRON PRODUCTS CO (CONTACT/OWNER)
Alternative names: CHEVRON STATION 9 1093
NORTHROP GRUMMAN TEJON (6242 LITTLE OAK CANYON RD in ROSAMOND, CA)
Small Quantity Generators, between 100 kg and 1000 kg of hazardous waste/month (Resource Conservation and Recovery Act (tracking hazardous waste)) - notification Organizations: NORTHROP GRUMMAN CORP (CONTACT/OWNER)
3103 W 50TH STREET (3103 W 50TH ST in ROSAMOND, CA)
SUPERFUND (Superfund database)
GREAT LAKES CARBON (SIERRA HIGHWAY in ROSAMOND, CA)
CRITERIA AND HAZARDOUS AIR POLLUTANT INVENTORY (Inventory of air pollution sources)
Housing units lacking complete plumbing facilities: 4.4% Housing units lacking complete kitchen facilities: 3.2%
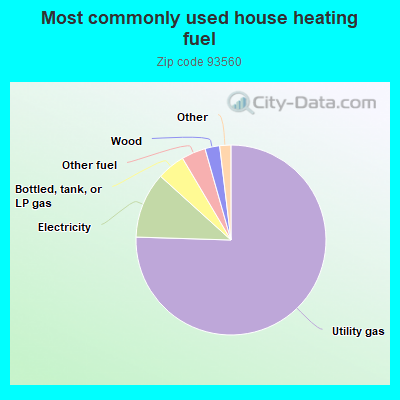
75.5%Utility gas
11.2%Electricity
4.8%Bottled, tank, or LP gas
4.1%Other fuel
2.5%Wood
0.9%Fuel oil, kerosene, etc.
0.6%No fuel used
Population in 1990: 9,898. Population change in the 1990s: +5,028 (+50.8%).
Place of birth for U.S.-born residents:
This state: 15,072
Northeast: 557
Midwest: 924
South: 1,072
West: 918
50% of the 93560 zip code residents lived in the same house 5 years ago. Out of people who lived in different houses, 48% lived in this county. Out of people who lived in different counties, 50% lived in California.
92% of the 93560 zip code residents lived in the same house 1 year ago. Out of people who lived in different houses, 31% moved from this county. Out of people who lived in different houses, 54% moved from different county within same state. Out of people who lived in different houses, 15% moved from different state. Out of people who lived in different houses, 3% moved from abroad.
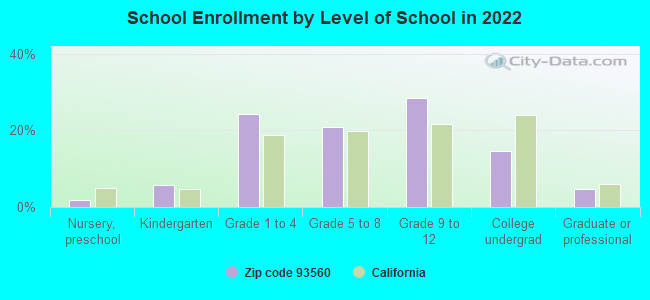
Private vs. public school enrollment:
Students in private schools in grades 1 to 8 (elementary and middle school): 294
Here:
10.2%
California:
10.5%
Students in private schools in grades 9 to 12 (high school): 101
Here:
5.6%
California:
8.5%
Students in private undergraduate colleges: 135
Here:
14.5%
California:
15.9%
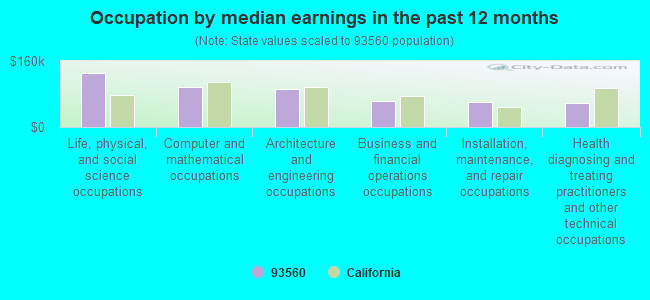
Occupation by median earnings in the past 12 months ($)
130,587Life, physical, and social science occupations
96,768Computer and mathematical occupations
92,963Architecture and engineering occupations
62,617Business and financial operations occupations
59,764Installation, maintenance, and repair occupations
58,589Health diagnosing and treating practitioners and other technical occupations
Companies with federal contracts located in this zip code (ROSAMOND, CA):
W E RESEARCH, LLC (2867 SIERRA HWY; small business) : $2,508,916 in 9 contractsfrom 2000 to 2005
Contracts for Physical Sciences -- Management and Support (R&D), Defense Missile and Space Systems -- Management and Support (R&D), Defense Missile and Space Systems -- Applied Research and Exploratory Development (R&D), ADP Components by Air Force Signed by year:2000: $471,000; 2001: $713,559; 2002: $371,769; 2003: $199,543; 2004: $738,099; 2005: $14,946; 2006: $0.
Biggest contracts:
$738,099 with Air Force for Physical Sciences -- Management and Support (R&D). Signed on 2004-06-29. Completion date: 2006-06-30.
$375,000 with Air Force for Defense Missile and Space Systems -- Management and Support (R&D). Signed on 2001-08-30. Completion date: 2003-12-01.
$375,000, same as above.Signed on 2000-09-29. Completion date: 2002-12-30.
$371,769, same as above.Signed on 2002-06-27. Completion date: 2003-12-01.
MOLINA ENGINEERING, LTD (1431 W ROSAMOND BVD STE; small business) : $307,341 in 7 contractsfrom 2002 to 2003
Contracts for Maintenance, Repair or Alteration of Real Property -- Miscellaneous Buildings, Maintenance, Repair or Alteration of Real Property -- Troop Housing Facilities by U.S. Army Corps of Engineers - civil program financing only, Army Signed by year:2000: $0; 2001: $0; 2002: $190,863; 2003: $116,478; 2004: $0; 2005: $0; 2006: $0.
Biggest contracts:
$181,500 with U.S. Army Corps of Engineers - civil program financing only for Maintenance, Repair or Alteration of Real Property -- Miscellaneous Buildings. Signed on 2002-08-08. Completion date: 2002-10-25.
$116,478 with Army for Maintenance, Repair or Alteration of Real Property -- Miscellaneous Buildings. Signed on 2003-03-20. Completion date: 2001-02-02.
$23,670 with U.S. Army Corps of Engineers - civil program financing only for Maintenance, Repair or Alteration of Real Property -- Miscellaneous Buildings. Signed on 2002-09-30. Completion date: 2001-03-02.
$16,612, same as above.Signed on 2002-04-03. Completion date: 2001-02-02.
GEORGE H LOWE JR (3464 TOPGUN STREET; small business) : $135,360 in 4 contractsfrom 1999 to 2002
$34,560 with Air Force for Educational Services. Signed on 2002-10-01. Completion date: 2003-09-30.
$34,560, same as above.Signed on 2001-11-20. Completion date: 2001-11-20.
$33,600, same as above.Signed on 1999-10-26. Completion date: 2000-09-30.
$32,640, same as above.Signed on 2000-11-22. Completion date: 2001-09-30.
KARL'S HARDWARE INC (2700 DIAMOND ST; small business) : $106,337 in 2 contractsfrom 2004 to 2006
$99,700 with Department of Veterans Affairs for Maintenance, Repair or Alteration of Real Property -- Office Buildings. Signed on 2004-09-13. Completion date: 2004-12-11.
$6,637 with Air Force for Lumber and Related Basic Wood Materials. Signed on 2006-06-06. Completion date: 2006-06-12.
BIG IRON CONSTRUCTION & LANDSC (1943-B SIERRA HWY; small business)
$70,555 with Air Force for Tile, Brick, and Block. Signed on 2005-09-16. Completion date: 2005-10-17.
TOMCAT FITNESS (3502 TANGLEWOOD AVENUE; small business)
$35,284 with Air Force for Other Professional Services. Signed on 2000-11-22. Completion date: 2001-09-30.
VIKING GIS (1348 BRADFORD AVE; small business) : $16,680 in 2 contractsfrom 2000 to 2004
$26,880 with Navy for Other Special Studies and Analyses. Signed on 2000-09-25. Completion date: 2001-12-31.
-$10,200, same as above.Signed on 2004-05-18. Completion date: 2001-12-31.
J P AVIATION (3721 KNOX AVE; small business) : $2,798 in 3 contractsfrom 2004 to 2005
$3,015 with Air Force for Other Education and Training Services. Taking place in CO. Signed on 2005-05-13. Completion date: 2005-05-29.
$2,798 with Air Force for Training/Curriculum Development. Signed on 2004-10-21. Completion date: 2004-11-05.
-$3,015 with Air Force for Other Education and Training Services. Taking place in CO. Signed on 2005-06-28. Completion date: 2005-05-29.
Top industries in this zip code by the number of employees in 2005:
2005 - 2018 National Fire Incident Reporting System (NFIRS) incidents
Based on the data from the years 2005 - 2018 the average number of fire incidents per year is 65. The highest number of reported fires - 127 took place in 2005, and the least - 1 in 2010. The data has a decreasing trend.
When looking into fire subcategories, the most incidents belonged to: Outside Fires (53.9%), and Structure Fires (30.5%).
Fire incident types reported to NFIRS in Zip Code 93560

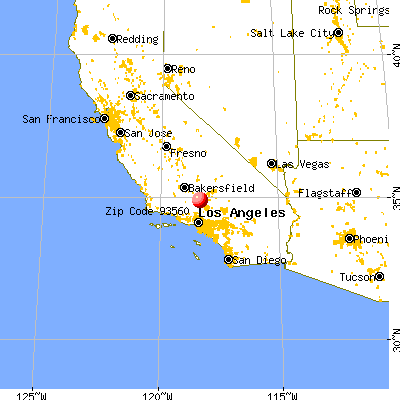


 Nearest zip codes: 93536, 93534, 93501, 93532, 93551, 93561.


 Based on the data from the years 2005 - 2018 the average number of fire incidents per year is 65. The highest number of reported fires - 127 took place in 2005, and the least - 1 in 2010. The data has a decreasing trend.
 When looking into fire subcategories, the most incidents belonged to: Outside Fires (53.9%), and Structure Fires (30.5%).