Estimated zip code population in 2022: 12,649 Zip code population in 2010: 13,162 Zip code population in 2000: 13,099
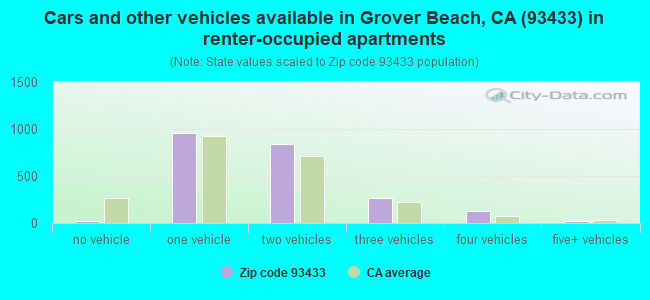
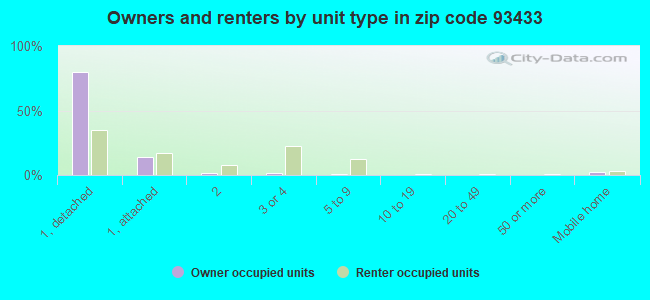
Houses and condos: 6,034 Renter-occupied apartments: 2,237
% of renters here:
43%
State:
44%
March 2022 cost of living index in zip code 93433: 107.0 (more than average, U.S. average is 100)
Land area: 2.2 sq. mi. Water area: 0.0 sq. mi.
Population density: 5,846 people per square mile
(average).
OSM Map
General Map
Google Map
MSN Map
OSM Map
General Map
Google Map
MSN Map
OSM Map
General Map
Google Map
MSN Map
OSM Map
General Map
Google Map
MSN Map
Please wait while loading the map...
Real estate property taxes paid for housing units in 2022:
This zip code:
0.6% ($3,931)
California:
0.7% ($4,831)
Median real estate property taxes paid for housing units with mortgages in 2022: $4,304 (0.6%) Median real estate property taxes paid for housing units with no mortgage in 2022: $3,730 (0.6%)
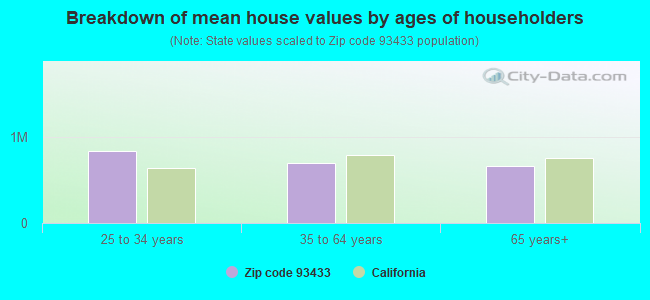
Estimated median house/condo value in 2022: $694,292
93433:
$694,292
California:
$715,900
According to our research of California and other state lists, there were 21 registered sex offenders living in 93433 zip code as of May 05, 2024. The ratio of all residents to sex offenders in zip code 93433 is 651 to 1. The ratio of registered sex offenders to all residents in this zip code is near the state average.
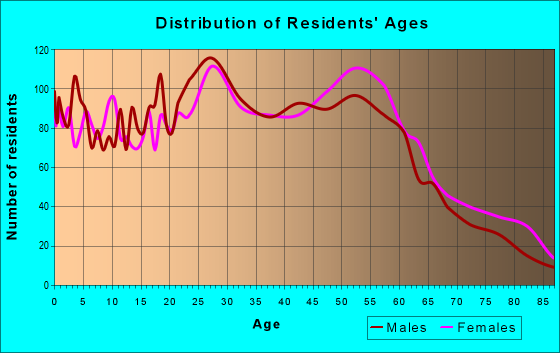
Median resident age:
This zip code:
40.9 years
California median age:
37.9 years
Average household size:
This zip code:
2.4 people
California:
2.8 people
Averages for the 2020 tax year for zip code 93433, filed in 2021:
Average Adjusted Gross Income (AGI) in 2020: $65,577 (Individual Income Tax Returns)
Here:
$65,577
State:
$95,910
Salary/wage: $55,932 (reported on 79.4% of returns)
Here:
$55,932
State:
$77,331
(% of AGI for various income ranges: 1330.6% for AGIs below $25k, 4063.6% for AGIs $25k-50k, 7438.6% for AGIs $50k-75k, 11113.4% for AGIs $75k-100k, 20231.8% for AGIs $100k-200k, 61292.9% for AGIs over 200k)
Taxable interest for individuals: $1,078 (reported on 34.0% of returns)
This zip code:
$1,078
California:
$2,294
(% of AGI for various income ranges: 17.5% for AGIs below $25k, 27.4% for AGIs $25k-50k, 45.2% for AGIs $50k-75k, 94.3% for AGIs $75k-100k, 136.2% for AGIs $100k-200k, 820.0% for AGIs over 200k)
Ordinary dividends: $3,891 (reported on 16.9% of returns)
Here:
$3,891
State:
$10,949
(% of AGI for various income ranges: 37.0% for AGIs below $25k, 43.9% for AGIs $25k-50k, 64.1% for AGIs $50k-75k, 190.9% for AGIs $75k-100k, 299.6% for AGIs $100k-200k, 1151.4% for AGIs over 200k)
Net capital gain/loss in AGI: +$10,804 (reported on 17.4% of returns)
Here:
+$10,804
State:
+$49,306
(% of AGI for various income ranges: 8.8% for AGIs below $25k, 44.5% for AGIs $25k-50k, 49.8% for AGIs $50k-75k, 240.3% for AGIs $75k-100k, 709.1% for AGIs $100k-200k, 9661.4% for AGIs over 200k)
Profit/loss from business: +$15,719 (reported on 15.6% of returns)
Here:
+$15,719
State:
+$15,671
(% of AGI for various income ranges: 96.0% for AGIs below $25k, 214.7% for AGIs $25k-50k, 431.4% for AGIs $50k-75k, 457.4% for AGIs $75k-100k, 1074.0% for AGIs $100k-200k, 4137.1% for AGIs over 200k)
Taxable individual retirement arrangement distribution: $22,098 (reported on 8.1% of returns)
93433:
$22,098
California:
$23,505
(% of AGI for various income ranges: 49.5% for AGIs below $25k, 104.1% for AGIs $25k-50k, 143.4% for AGIs $50k-75k, 388.9% for AGIs $75k-100k, 797.6% for AGIs $100k-200k, 5111.4% for AGIs over 200k)
Self-employed (Keogh) retirement plans: $13,533 (reported on 0.5% of returns)
93433:
$13,533
California:
$30,163
(% of AGI for various income ranges: 70.0% for AGIs $50k-75k)
Total itemized deductions: $29,563 (reported on 13.9% of returns)
Here:
$29,563
State:
$39,517
(% of AGI for various income ranges: 132.9% for AGIs below $25k, 210.2% for AGIs $25k-50k, 561.7% for AGIs $50k-75k, 1170.3% for AGIs $75k-100k, 2012.9% for AGIs $100k-200k, 7475.7% for AGIs over 200k)
Charity contributions: $5,291 (reported on 11.1% of returns)
Here:
$5,291
State:
$12,598
(% of AGI for various income ranges: 5.0% for AGIs below $25k, 25.7% for AGIs $25k-50k, 54.3% for AGIs $50k-75k, 145.4% for AGIs $75k-100k, 312.0% for AGIs $100k-200k, 1552.9% for AGIs over 200k)
Taxes paid: $8,026 (reported on 13.9% of returns)
93433:
$8,026
State:
$8,807
(% of AGI for various income ranges: 20.7% for AGIs below $25k, 45.5% for AGIs $25k-50k, 151.2% for AGIs $50k-75k, 363.1% for AGIs $75k-100k, 636.7% for AGIs $100k-200k, 1658.6% for AGIs over 200k)
Earned income credit: $1,764 (reported on 11.6% of returns)
Here:
$1,764
State:
$2,074
(% of AGI for various income ranges: 67.0% for AGIs below $25k, 47.7% for AGIs $25k-50k)
Percentage of individuals using paid preparers for their 2020 taxes: 91.8%
Here:
92%
State:
92%
(% for various income ranges: 91.5% for AGIs below $25k, 91.0% for AGIs $25k-50k, 91.4% for AGIs $50k-75k, 92.2% for AGIs $75k-100k, 92.6% for AGIs $100k-200k, 95.8% for AGIs over 200k)
Averages for the 2012 tax year for zip code 93433, filed in 2013:
Average Adjusted Gross Income (AGI) in 2012: $48,016 (Individual Income Tax Returns)
Here:
$48,016
State:
$72,726
Salary/wage: $42,363 (reported on 83.7% of returns)
Here:
$42,363
State:
$59,079
(% of AGI for various income ranges: 77.4% for AGIs below $25k, 81.0% for AGIs $25k-50k, 75.7% for AGIs $50k-75k, 74.1% for AGIs $75k-100k, 77.0% for AGIs $100k-200k, 45.5% for AGIs over 200k)
Taxable interest for individuals: $1,259 (reported on 32.3% of returns)
This zip code:
$1,259
California:
$2,146
(% of AGI for various income ranges: 0.9% for AGIs below $25k, 0.7% for AGIs $25k-50k, 0.9% for AGIs $50k-75k, 0.8% for AGIs $75k-100k, 0.5% for AGIs $100k-200k, 1.7% for AGIs over 200k)
Ordinary dividends: $3,139 (reported on 14.5% of returns)
Here:
$3,139
State:
$9,308
(% of AGI for various income ranges: 1.6% for AGIs below $25k, 0.9% for AGIs $25k-50k, 0.9% for AGIs $50k-75k, 1.0% for AGIs $75k-100k, 0.9% for AGIs $100k-200k, 0.7% for AGIs over 200k)
Net capital gain/loss in AGI: +$3,513 (reported on 12.6% of returns)
Here:
+$3,513
State:
+$30,460
(% of AGI for various income ranges: 0.6% for AGIs $50k-75k, 0.6% for AGIs $75k-100k, 1.1% for AGIs $100k-200k, 4.7% for AGIs over 200k)
Profit/loss from business: +$13,187 (reported on 15.2% of returns)
Here:
+$13,187
State:
+$17,064
(% of AGI for various income ranges: 8.4% for AGIs below $25k, 5.0% for AGIs $25k-50k, 3.2% for AGIs $50k-75k, 3.4% for AGIs $75k-100k, 4.5% for AGIs $100k-200k)
Taxable individual retirement arrangement distribution: $12,087 (reported on 8.3% of returns)
93433:
$12,087
California:
$19,557
(% of AGI for various income ranges: 1.9% for AGIs below $25k, 1.8% for AGIs $25k-50k, 2.4% for AGIs $50k-75k, 2.3% for AGIs $75k-100k, 2.9% for AGIs $100k-200k)
Self-employment retirement plans: $16,400 (reported on 0.4% of returns)
93433:
$16,400
California:
$24,530
Total itemized deductions: $23,151 (26% of AGI, reported on 30.5% of returns)
Here:
$23,151
State:
$34,004
Here:
25.7% of AGI
State:
22.7% of AGI
(% of AGI for various income ranges: 9.8% for AGIs below $25k, 9.6% for AGIs $25k-50k, 15.5% for AGIs $50k-75k, 18.1% for AGIs $75k-100k, 18.3% for AGIs $100k-200k, 15.1% for AGIs over 200k)
Charity contributions: $2,672 (reported on 24.5% of returns)
Here:
$2,672
State:
$4,659
(% of AGI for various income ranges: 0.5% for AGIs below $25k, 0.9% for AGIs $25k-50k, 1.5% for AGIs $50k-75k, 1.8% for AGIs $75k-100k, 1.9% for AGIs $100k-200k, 1.0% for AGIs over 200k)
Taxes paid: $7,524 (reported on 30.3% of returns)
93433:
$7,524
State:
$14,448
(% of AGI for various income ranges: 1.8% for AGIs below $25k, 2.3% for AGIs $25k-50k, 3.7% for AGIs $50k-75k, 5.5% for AGIs $75k-100k, 6.8% for AGIs $100k-200k, 8.3% for AGIs over 200k)
Earned income credit: $1,897 (reported on 18.3% of returns)
Here:
$1,897
State:
$2,286
(% of AGI for various income ranges: 4.8% for AGIs below $25k, 0.9% for AGIs $25k-50k)
Percentage of individuals using paid preparers for their 2012 taxes: 52.8%
Here:
53%
State:
64%
(% for various income ranges: 48.2% for AGIs below $25k, 51.0% for AGIs $25k-50k, 57.7% for AGIs $50k-75k, 57.8% for AGIs $75k-100k, 63.5% for AGIs $100k-200k, 75.0% for AGIs over 200k)
Averages for the 2004 tax year for zip code 93433, filed in 2005:
Average Adjusted Gross Income (AGI) in 2004: $39,083 (Individual Income Tax Returns)
Here:
$39,083
State:
$58,600
Salary/wage: $36,338 (reported on 82.2% of returns)
Here:
$36,338
State:
$49,455
(% of AGI for various income ranges: 140.2% for AGIs below $10k, 76.8% for AGIs $10k-25k, 80.6% for AGIs $25k-50k, 78.4% for AGIs $50k-75k, 82.5% for AGIs $75k-100k, 63.8% for AGIs over 100k)
Taxable interest for individuals: $1,393 (reported on 43.1% of returns)
This zip code:
$1,393
California:
$2,365
(% of AGI for various income ranges: 5.6% for AGIs below $10k, 2.8% for AGIs $10k-25k, 1.4% for AGIs $25k-50k, 1.4% for AGIs $50k-75k, 0.7% for AGIs $75k-100k, 1.4% for AGIs over 100k)
Taxable dividends: $1,863 (reported on 20.0% of returns)
Here:
$1,863
State:
$4,746
(% of AGI for various income ranges: 4.0% for AGIs below $10k, 1.5% for AGIs $10k-25k, 0.8% for AGIs $25k-50k, 0.9% for AGIs $50k-75k, 0.9% for AGIs $75k-100k, 0.7% for AGIs over 100k)
Net capital gain/loss: +$10,200 (reported on 16.5% of returns)
Here:
+$10,200
State:
+$23,418
(% of AGI for various income ranges: -1.0% for AGIs below $10k, 0.1% for AGIs $10k-25k, 0.5% for AGIs $25k-50k, 1.4% for AGIs $50k-75k, 2.2% for AGIs $75k-100k, 13.5% for AGIs over 100k)
Profit/loss from business: +$12,442 (reported on 17.7% of returns)
Here:
+$12,442
State:
+$16,826
(% of AGI for various income ranges: 7.7% for AGIs below $10k, 8.1% for AGIs $10k-25k, 6.0% for AGIs $25k-50k, 3.4% for AGIs $50k-75k, 4.7% for AGIs $75k-100k, 6.5% for AGIs over 100k)
IRA payment deduction: $2,915 (reported on 2.8% of returns)
93433:
$2,915
California:
$3,192
(% of AGI for various income ranges: 0.2% for AGIs $10k-25k, 0.3% for AGIs $25k-50k, 0.2% for AGIs $50k-75k, 0.2% for AGIs $75k-100k, 0.2% for AGIs over 100k)
Self-employed pension: $8,727 (reported on 0.9% of returns)
Here:
$8,727
California:
$17,688
(% of AGI for various income ranges: 0.1% for AGIs $10k-25k, 0.2% for AGIs $50k-75k, 0.5% for AGIs over 100k)
Total itemized deductions: $20,372 (30% of AGI, reported on 33.6% of returns)
Here:
$20,372
State:
$28,113
Here:
29.6% of AGI
State:
25.3% of AGI
(% of AGI for various income ranges: 33.0% for AGIs below $10k, 12.9% for AGIs $10k-25k, 14.3% for AGIs $25k-50k, 19.3% for AGIs $50k-75k, 21.4% for AGIs $75k-100k, 18.1% for AGIs over 100k)
Charity contributions deductions: $2,405 (3% of AGI, reported on 28.7% of returns)
Here:
$2,405
State:
$3,923
Here:
3.4% of AGI
State:
3.3% of AGI
(% of AGI for various income ranges: 1.3% for AGIs below $10k, 1.0% for AGIs $10k-25k, 1.4% for AGIs $25k-50k, 1.7% for AGIs $50k-75k, 2.4% for AGIs $75k-100k, 2.2% for AGIs over 100k)
Total tax: $5,034 (reported on 75.8% of returns)
93433:
$5,034
State:
$10,761
(% of AGI for various income ranges: 5.0% for AGIs below $10k, 4.6% for AGIs $10k-25k, 6.9% for AGIs $25k-50k, 8.9% for AGIs $50k-75k, 10.2% for AGIs $75k-100k, 15.5% for AGIs over 100k)
Earned income credit: $1,554 (reported on 15.9% of returns)
Here:
$1,554
State:
$1,763
Percentage of individuals using paid preparers for their 2004 taxes: 60.5%
Here:
60%
State:
66%
(% for various income ranges: 51.7% for AGIs below $10k, 59.4% for AGIs $10k-25k, 60.1% for AGIs $25k-50k, 69.9% for AGIs $50k-75k, 63.1% for AGIs $75k-100k, 69.3% for AGIs over 100k)
Likely homosexual households (counted as self-reported same-sex unmarried-partner households)
Lesbian couples: 0.5% of all households
Gay men: 0.3% of all households
Household received Food Stamps/SNAP in the past 12 months: 465 Household did not receive Food Stamps/SNAP in the past 12 months: 4,722
Women who had a birth in the past 12 months: 131 (130 now married, 0 unmarried) Women who did not have a birth in the past 12 months: 2,565 (877 now married, 1,692 unmarried)
Housing units in zip code 93433 with a mortgage: 1,968 (60 second mortgage, 63 both second mortgage and home equity loan) Houses without a mortgage: 26
Median monthly owner costs for units with a mortgage: $2,163 Median monthly owner costs for units without a mortgage: $599
Residents with income below the poverty level in 2022:
This zip code:
10.7%
Whole state:
12.2%
Residents with income below 50% of the poverty level in 2022:
This zip code:
5.2%
Whole state:
6.2%
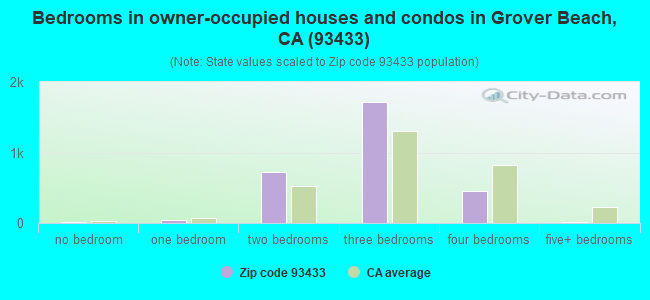
Median number of rooms in houses and condos:
Here:
5.5
State:
6.0
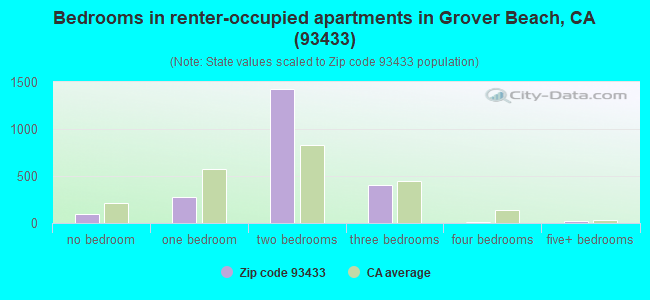
Median number of rooms in apartments:
Here:
4.1
State:
3.9
Notable locations in this zip code not listed on our city pages
Notable locations in zip code 93433: Pismo State Beach Golf Course (A), Le Sage Riviera Golf Course (B), Grover Beach City Hall (C), Grover Beach Chamber of Commerce (D), Grover Beach Fire Department (E). Display/hide their locations on the map
Churches in zip code 93433 include: Bethel Baptist Church (A), Central Coast Baptist Church (B), Church of Christ (C), Grover Beach Assembly of God Church (D), Kingdom Hall of Jehovahs Witnesses (E), Landmark Missionary Baptist Church (F), Mount Zion Baptist Church (G), Peace Lutheran Church (H), Pentecostal Church of God (I). Display/hide their locations on the map
Parks in zip code 93433 include: Grover City Park (1), Grover Heights Park (2), Mentone Drainage Basin Park (3), Ramona Gardens Park (4), Sixteenth Street Park (5). Display/hide their locations on the map
In group quarters: 53 (-1 institutionalized population)
Size of family households: 1,391 2-persons, 1,002 3-persons, 508 4-persons, 232 5-persons, 141 6-persons, 37 7-or-more-persons
Size of nonfamily households: 1,553 1-person, 384 2-persons
1,352 married couples with children.
885 single-parent households (400 men, 485 women).
74.4% of residents of 93433 zip code speak English at home.
22.1% of residents speak Spanish at home (53% very well, 22% well, 14% not well, 11% not at all).
1.2% of residents speak other Indo-European language at home (91% very well, 9% well).
1.8% of residents speak Asian or Pacific Island language at home (51% very well, 28% well, 21% not well).
0.3% of residents speak other language at home (100% very well).
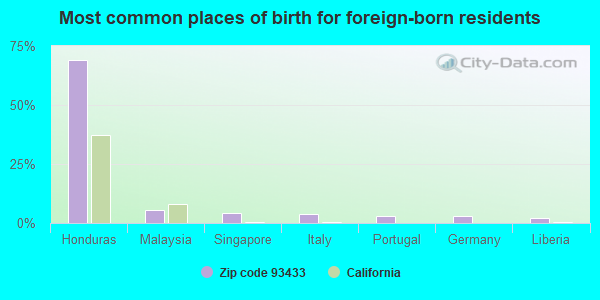
Foreign born population: 1,319 (10.4%) (54.9% of them are naturalized citizens)
This zip code:
10.4%
Whole state:
26.7%
69%Honduras
6%Malaysia
4%Singapore
4%Italy
3%Portugal
3%Germany
2%Liberia
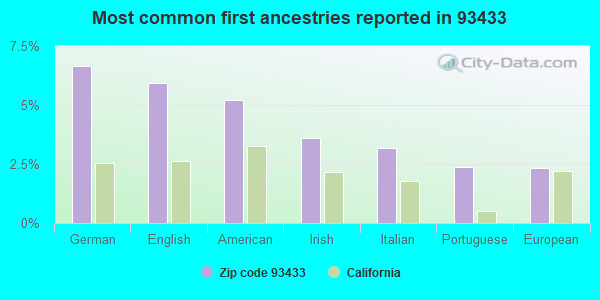
7%German
6%English
5%American
4%Irish
3%Italian
2%Portuguese
2%European
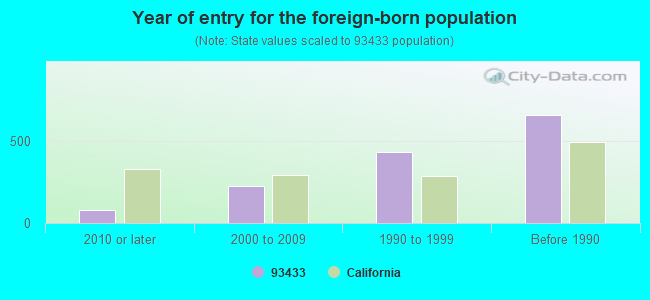
Year of entry for the foreign-born population
802010 or later
2232000 to 2009
4311990 to 1999
655Before 1990
Facilities with environmental interests located in this zip code:
GROVER CITY CITY OF (1150 FARROLL in GROVER BEACH, CA)
STATE MASTER (California - Hazardous Waste Tracking) - HAZARDOU WASTE PROGRAM Small Quantity Generators, between 100 kg and 1000 kg of hazardous waste/month (Resource Conservation and Recovery Act (tracking hazardous waste)) - notification Organizations: CITY OF GROVER CITY (CONTACT/OWNER)
Alternative names: CITY OF GROVER BEACH
JAMES CROOKS TRUCKING INC (1050 GRIFFIN UNIT E in GROVER BEACH, CA)
STATE MASTER (California - Hazardous Waste Tracking) - HAZARDOU WASTE PROGRAM TRANSPORTER (Resource Conservation and Recovery Act (tracking hazardous waste)) - notification Organizations: JAMES R CROOKS (CONTACT/OPERATOR)
CHEVRON STATION NO 98425 (1284 GRAND AVE in GROVER BEACH, CA)
STATE MASTER (California - Hazardous Waste Tracking) - HAZARDOU WASTE PROGRAM CRITERIA AND HAZARDOUS AIR POLLUTANT INVENTORY (Inventory of air pollution sources) Small Quantity Generators, between 100 kg and 1000 kg of hazardous waste/month (Resource Conservation and Recovery Act (tracking hazardous waste)) - notification Business SIC classification: GASOLINE SERVICE STATIONS Organizations: CHEVRON PRODUCTS CO (CONTACT/OWNER)
CENTRAL COAST CUSTOM (702 GRAND AVE in GROVER BEACH, CA)
STATE MASTER (California - Hazardous Waste Tracking) - HAZARDOU WASTE PROGRAM Small Quantity Generators, between 100 kg and 1000 kg of hazardous waste/month (Resource Conservation and Recovery Act (tracking hazardous waste)) - notification Organizations: GARY COOPER (CONTACT/OWNER)
GROVER BEACH ELEMENTARY (365 S. 10TH ST. in GROVER BEACH, CA)
(National Center for Education Statistics) - STATE ID-6043038 Organizations: LUCIA MAR UNIFIED (SCHOOL DISTRICT)
GROVER HEIGHTS ELEMENTARY (770 N. 8TH & RICHIE ROAD in GROVER CITY, CA)
(National Center for Education Statistics) - STATE ID-6043046 Organizations: LUCIA MAR UNIFIED (SCHOOL DISTRICT)
NORTH OCEANO ELEMENTARY (2101 THE PIKE in GROVER CITY, CA)
(National Center for Education Statistics) - STATE ID-6043079 Organizations: LUCIA MAR UNIFIED (SCHOOL DISTRICT)
CALIFORNIA FINE WIRE CO (338 SOUTH 4TH STREET in GROVER BEACH, CA)
CRITERIA AND HAZARDOUS AIR POLLUTANT INVENTORY (Inventory of air pollution sources) Small Quantity Generators, between 100 kg and 1000 kg of hazardous waste/month (Resource Conservation and Recovery Act (tracking hazardous waste)) TRI REPORTER (Tracking of toxic chemicals releasing facilities) Business SIC classification: DRAWING AND INSULATING OF NONFERROUS WIRE Alternative names: CALIFORNIA FINE WIRE CO.
ALUMATEC, INCORPORATED (338 S 4TH ST in GROVER BEACH, CA)
Small Quantity Generators, between 100 kg and 1000 kg of hazardous waste/month (Resource Conservation and Recovery Act (tracking hazardous waste))
GROVER BEACH 76 (684 GRAND AVENUE in GROVER BEACH, CA)
CRITERIA AND HAZARDOUS AIR POLLUTANT INVENTORY (Inventory of air pollution sources) Business SIC classification: GASOLINE SERVICE STATIONS
KENT'S AUTO BODY (165 N. 6TH STREET in GROVER BEACH, CA)
CRITERIA AND HAZARDOUS AIR POLLUTANT INVENTORY (Inventory of air pollution sources) Business SIC classification: TOP, BODY, AND UPHOLSTERY REPAIR SHOPS AND PAINT SHOPS
KNOWLTON BROTHERS, INC. (920 HUBER ST in GROVER BEACH, CA)
CRITERIA AND HAZARDOUS AIR POLLUTANT INVENTORY (Inventory of air pollution sources) Business SIC classification: WOOD HOUSEHOLD FURNITURE, EXCEPT UPHOLSTERED Alternative names: KNOWLTON BROTHERS FINE FURNIT
Housing units lacking complete plumbing facilities: 0.4% Housing units lacking complete kitchen facilities: 0.7%
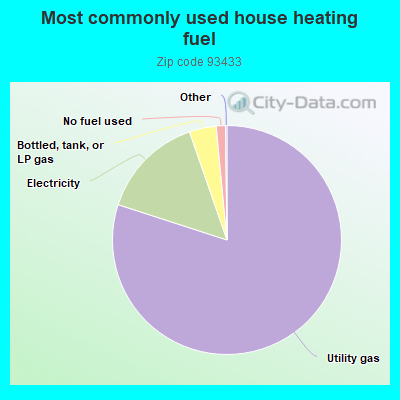
80.0%Utility gas
14.7%Electricity
3.8%Bottled, tank, or LP gas
1.3%No fuel used
Population in 1990: 11,790. Population change in the 1990s: +1,309 (+11.1%).
Place of birth for U.S.-born residents:
This state: 9,183
Northeast: 260
Midwest: 760
South: 459
West: 520
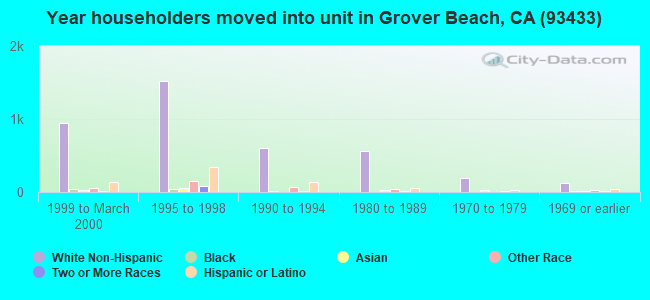
40% of the 93433 zip code residents lived in the same house 5 years ago. Out of people who lived in different houses, 59% lived in this county. Out of people who lived in different counties, 50% lived in California.
90% of the 93433 zip code residents lived in the same house 1 year ago. Out of people who lived in different houses, 51% moved from this county. Out of people who lived in different houses, 36% moved from different county within same state. Out of people who lived in different houses, 11% moved from different state. Out of people who lived in different houses, 1% moved from abroad.
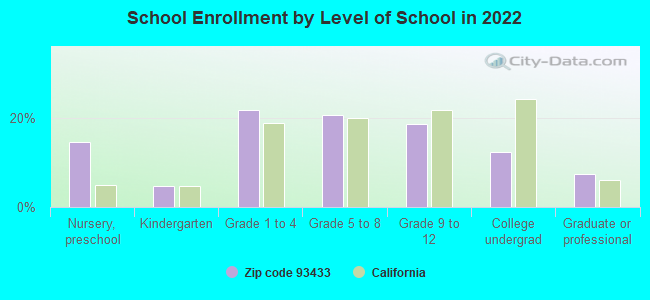
Private vs. public school enrollment:
Students in private schools in grades 1 to 8 (elementary and middle school): 22
Here:
1.9%
California:
10.5%
Students in private schools in grades 9 to 12 (high school): 8
Here:
1.5%
California:
8.5%
Students in private undergraduate colleges: 157
Here:
44.2%
California:
15.9%
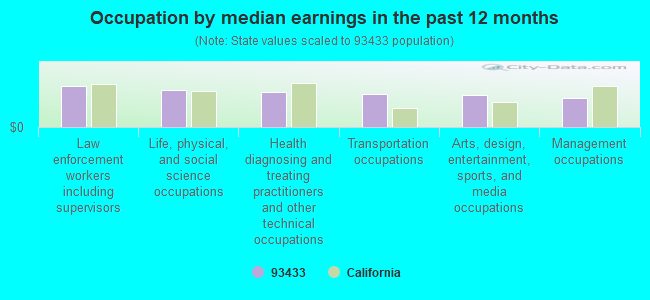
Occupation by median earnings in the past 12 months ($)
102,139Law enforcement workers including supervisors
93,998Life, physical, and social science occupations
88,320Health diagnosing and treating practitioners and other technical occupations
81,839Transportation occupations
81,436Arts, design, entertainment, sports, and media occupations
73,586Management occupations
Companies with federal contracts located in this zip code (GROVER BEACH, CA):
LEON CONSTRUCTION,INC. (1198 FARROLL ROAD, SUITE D; small business) : $88,541,052 in 698 contractsfrom 2000 to 2006
Contracts for Maintenance, Repair or Alteration of Real Property -- Troop Housing Facilities, Maintenance, Repair or Alteration of Real Property -- Miscellaneous Buildings, Maintenance, Repair or Alteration of Real Property -- Other Administrative Facilities and Service Buildings, Maintenance, Repair or Alteration of Real Property -- Other Utilities, and moreby Air Force, Army, Navy, ENERGY, Department of, and others Signed by year:2000: $7,346,051; 2001: $15,744,974; 2002: $10,851,332; 2003: $24,985,605; 2004: $13,876,374; 2005: $14,591,716; 2006: $1,145,000.
Biggest contracts:
$2,998,041 with Air Force for Maintenance, Repair or Alteration of Real Property -- Troop Housing Facilities. Signed on 2004-09-07. Completion date: 2005-09-07.
$2,985,450 with Air Force for Maintenance, Repair or Alteration of Real Property -- Miscellaneous Buildings. Signed on 2003-09-24. Completion date: 2004-09-29.
$2,953,021 with Air Force for Maintenance, Repair or Alteration of Real Property -- Other Administrative Facilities and Service Buildings. Signed on 2003-06-04. Completion date: 2003-07-07.
$2,608,741 with Army for Maintenance, Repair or Alteration of Real Property -- Other Utilities. Signed on 2001-12-19. Completion date: 2002-12-18.
DIVERSE PEST MANAGEMENT, INC (945 HUBER STREET; small business) : $506,716 in 9 contractsfrom 2002 to 2005
Contracts for Insect and Rodent Control Services, Landscaping/Groundskeeping Services by Air Force, Army Signed by year:2000: $0; 2001: $0; 2002: $84,075; 2003: $123,710; 2004: $135,516; 2005: $163,415; 2006: $0.
Biggest contracts:
$205,933 with Air Force for Insect and Rodent Control Services. Signed on 2004-10-01. Completion date: 2005-09-30.
$135,815, same as above.Signed on 2005-10-01. Completion date: 2006-09-30.
$115,910, same as above.Signed on 2003-10-01. Completion date: 2006-09-30.
$84,075, same as above.Signed on 2002-10-29. Completion date: 2003-09-30.
MAC-AIR (1198 FARROLL RD STE 3; small business) : $152,439 in 26 contractsfrom 2004 to 2006
Contracts for Valves, Powered, Hose, Pipe, Tube, Lubrication, and Railing Fittings, Motors, Electrical, Hardware, Commercial, and moreby Defense Logistics Agency, Navy, Air Force, Army, and others Signed by year:2000: $0; 2001: $0; 2002: $0; 2003: $0; 2004: $27,152; 2005: $78,926; 2006: $46,361.
Biggest contracts:
$19,000 with Defense Logistics Agency for Valves, Powered. Signed on 2005-10-24. Completion date: 2005-11-23.
$18,068 with Defense Logistics Agency for Hose, Pipe, Tube, Lubrication, and Railing Fittings. Signed on 2006-01-19. Completion date: 2006-02-18.
$15,200 with Defense Logistics Agency for Motors, Electrical. Signed on 2004-10-05. Completion date: 2004-11-14.
$12,500 with Navy for Valves, Powered. Taking place in NY. Signed on 2005-06-21. Completion date: 2005-07-21.
NEAL GROSSEN (760 CORONADO CT; small business) : $97,600 in 8 contractsfrom 2003 to 2006
Contracts for Electrical and Electronic Properties Measuring and Testing Instruments, ADP Software, , Maintenance, Repair and Rebuilding of Equipment -- Instruments and Laboratory Equipment, and moreby Army, Air Force, ENERGY, Department of Signed by year:2000: $0; 2001: $0; 2002: $0; 2003: $6,500; 2004: $6,500; 2005: $62,600; 2006: $22,000.
Biggest contracts:
$22,800 with Army for Electrical and Electronic Properties Measuring and Testing Instruments. Signed on 2005-09-29. Completion date: 2006-03-06.
$22,000 with Air Force for ADP Software. Signed on 2006-05-09. Completion date: 2006-06-15.
$18,400 with Army for Electrical and Electronic Properties Measuring and Testing Instruments. Signed on 2005-09-12. Completion date: 2006-03-06.
$14,900 with ENERGY, Department of for . Signed on 2005-03-14. Completion date: 2005-09-23.
CFW RESEARCH & DEVELOPMENT COM (371B MANHATTAN AVE; small business) 50 employees, $0 revenue. Veteran Owned Business: $24,102 in 3 contractsfrom 2004 to 2006
$18,809 with Navy for Cartridge and Propellant Actuated Devices and Components. Signed on 2006-02-08. Completion date: 2011-02-08.
$4,793 with Navy for Hose, Pipe, Tube, Lubrication, and Railing Fittings. Signed on 2004-10-01. Completion date: 2005-03-03.
$500 with Navy for Cartridge and Propellant Actuated Devices and Components. Signed on 2006-03-01. Completion date: 2011-03-01.
BEST FLAGS INC (1101 HIGHLAND WAY , SUITE; small business) : $9,598 in 2 contractsin 2005
$7,008 with Air Force for Flags and Pennants. Signed on 2005-09-19. Completion date: 2005-09-30.
$2,590 with Navy for Flags and Pennants. Taking place in HI. Signed on 2005-08-22. Completion date: 2005-08-26.
Top industries in this zip code by the number of employees in 2005:
Health Care and Social Assistance: Residential Mental Retardation Facilities (250-499 employees: 1 establishment)
2004 - 2018 National Fire Incident Reporting System (NFIRS) incidents
According to the data from the years 2004 - 2018 the average number of fires per year is 21. The highest number of reported fires - 85 took place in 2006, and the least - 0 in 2013. The data has a constant trend.
When looking into fire subcategories, the most incidents belonged to: Structure Fires (41.1%), and Outside Fires (26.5%).
Fire incident types reported to NFIRS in Zip Code 93433


 Nearest zip codes: 93449, 93445, 93401, 93424, 93444, 93420.
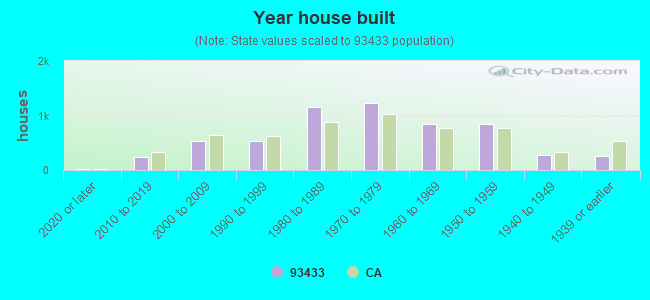


 According to the data from the years 2004 - 2018 the average number of fires per year is 21. The highest number of reported fires - 85 took place in 2006, and the least - 0 in 2013. The data has a constant trend.
 When looking into fire subcategories, the most incidents belonged to: Structure Fires (41.1%), and Outside Fires (26.5%).