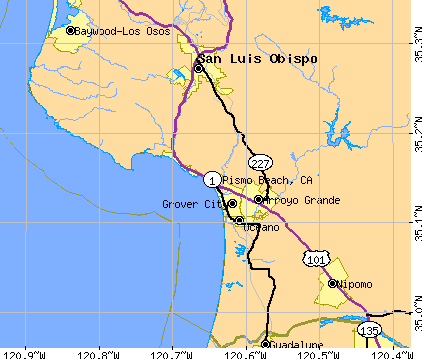
Pismo Beach, California
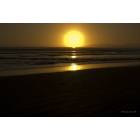
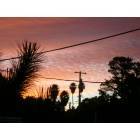
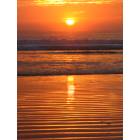
Pismo Beach: Pismo Beach Sunset
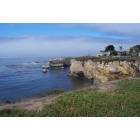
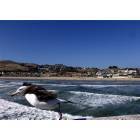
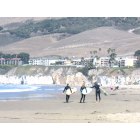
Pismo Beach: Beautiful views
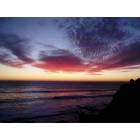
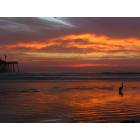
Pismo Beach: Pismo Beach cliffs Sunset
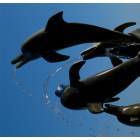
Pismo Beach: dolphin sculpure
Pismo Beach: Pismo Beach Pier
Pismo Beach: sun rise from our home in Pismo Beach
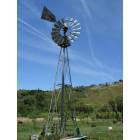
Pismo Beach: Windmill at the Price house in Pismo
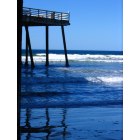
Pismo Beach: Pier North Side Pismo Beach Ca
Pismo Beach: Pismo Beach Sunset 2008
Pismo Beach: Pismo Beach Board Meeting
Pismo Beach: Pismo Beach Sunset 2008
- see
24
more - add
your
Submit your own pictures of this city and show them to the world
- OSM Map
- General Map
- Google Map
- MSN Map
Population change since 2000: -5.9%
 |
| Males: 4,072 | |
| Females: 3,972 |
| Median resident age: | 55.6 years |
| California median age: | 37.9 years |
Zip codes: 93449.
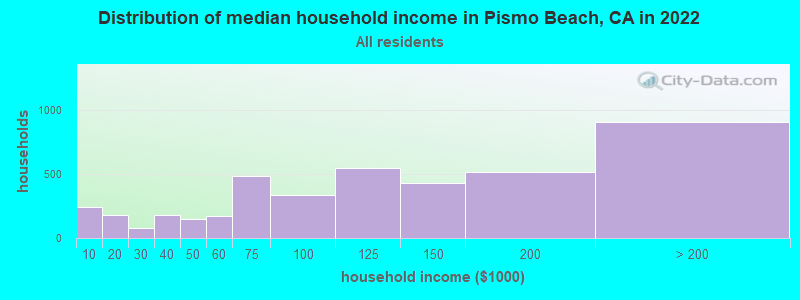
| Pismo Beach: | $109,266 |
| CA: | $91,551 |
Estimated per capita income in 2022: $79,615 (it was $30,835 in 2000)
Pismo Beach city income, earnings, and wages data
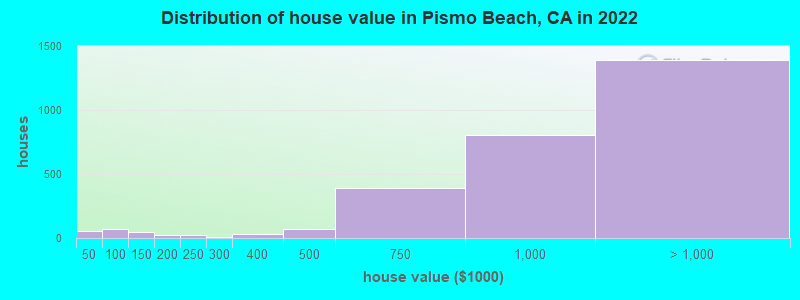
Estimated median house or condo value in 2022: over $1,000,000 (it was $262,600 in 2000)
| Pismo Beach: | over $1,000,000 |
| CA: | $715,900 |
Mean prices in 2022: all housing units: $895,490; detached houses: $974,282; townhouses or other attached units: $627,105; in 2-unit structures: $719,918; in 3-to-4-unit structures: $546,505; in 5-or-more-unit structures: $432,833; mobile homes: $416,411; occupied boats, rvs, vans, etc.: $73,149
Median gross rent in 2022: $2,256.
(5.0% for White Non-Hispanic residents, 1.4% for Black residents, 14.2% for Hispanic or Latino residents, 100.0% for Native Hawaiian and other Pacific Islander residents, 39.4% for other race residents, 5.7% for two or more races residents)
Detailed information about poverty and poor residents in Pismo Beach, CA


Compare current foreclosures near Pismo Beach, CA:
| Photo | Address | Area | Beds / Baths | Price | Details |
|---|---|---|---|---|---|

|
#1
Price St # 203
Pismo Beach, CA 93449
|
- sq. feet
|
- baths - beds |
show details | |

|
#2
La Tijera Ct
Oceano, CA 93445
|
1,161 sq. feet
|
1 baths 3 beds |
show details | |

|
#3
Jupiter Dr
Nipomo, CA 93444
|
2,427 sq. feet
|
2 baths 3 beds |
show details | |

|
#4
Ibis Cir
Guadalupe, CA 93434
|
1,532 sq. feet
|
2 baths 3 beds |
show details | |

|
#5
Viola Ct
Nipomo, CA 93444
|
1,782 sq. feet
|
2 baths 3 beds |
show details | |

|
#6
K St
Santa Margarita, CA 93453
|
1,040 sq. feet
|
2 baths 3 beds |
show details | |

|
#7
Quail Ct
Arroyo Grande, CA 93420
|
1,961 sq. feet
|
2 baths 2 beds |
show details | |

|
#8
Mentone Ave
Grover Beach, CA 93433
|
616 sq. feet
|
1 baths 2 beds |
show details | |

|
#9
La Serenata Way
Nipomo, CA 93444
|
2,331 sq. feet
|
3 baths 3 beds |
show details | |

|
#10
La Serenata Way
Nipomo, CA 93444
|
2,331 sq. feet
|
3 baths 3 beds |
show details |
| Photo | Address | Area | Beds / Baths | Price | Details |
|---|---|---|---|---|---|

|
#11
Kent St
Nipomo, CA 93444
|
1,160 sq. feet
|
2 baths 3 beds |
show details | |

|
#12
E Branch St
Nipomo, CA 93444
|
1,887 sq. feet
|
2 baths 4 beds |
show details | |

|
#13
E Branch St
Nipomo, CA 93444
|
1,120 sq. feet
|
2 baths 3 beds |
show details | |

|
#14
January St
Nipomo, CA 93444
|
1,803 sq. feet
|
2 baths 3 beds |
show details | |

|
#15
Oconnor Way
San Luis Obispo, CA 93405
|
2,503 sq. feet
|
2 baths 3 beds |
show details | |

|
#16
Pomeroy Rd
Arroyo Grande, CA 93420
|
1,607 sq. feet
|
3 baths 5 beds |
show details | |

|
#17
Johnson Ave
San Luis Obispo, CA 93401
|
708 sq. feet
|
1 baths 2 beds |
show details | |

|
#18
Funston Ave
San Luis Obispo, CA 93401
|
478 sq. feet
|
2 baths 2 beds |
show details | |

|
#19
Southland St
Nipomo, CA 93444
|
934 sq. feet
|
1 baths 2 beds |
show details | |

|
#20
Los Osos Valley Rd Apt 20
San Luis Obispo, CA 93405
|
1,158 sq. feet
|
1 baths 2 beds |
show details |
| Photo | Address | Area | Beds / Baths | Price | Details |
|---|---|---|---|---|---|

|
#21
N 12th St
Grover Beach, CA 93433
|
520 sq. feet
|
2 baths 1 beds |
show details | |

|
#22
Valley Oaks
Arroyo Grande, CA 93420
|
3,722 sq. feet
|
3 baths 4 beds |
show details | |

|
#23
Highland Dr
Los Osos, CA 93402
|
3,406 sq. feet
|
3 baths 4 beds |
show details | |

|
#24
Quarterhorse Way
Arroyo Grande, CA 93420
|
3,172 sq. feet
|
2 baths 3 beds |
show details | |

|
#25
W Williams St
Santa Maria, CA 93458
|
1,316 sq. feet
|
2 baths 3 beds |
show details | |

|
#26
Brighton Ave
Grover Beach, CA 93433
|
1,805 sq. feet
|
2 baths 3 beds |
show details | |

|
#27
Hillcrest Dr
Arroyo Grande, CA 93420
|
1,097 sq. feet
|
2 baths 2 beds |
show details | |

|
#28
12th St
Los Osos, CA 93402
|
1,170 sq. feet
|
2 baths 3 beds |
show details | |

|
#29
Fair Oaks Ave
Arroyo Grande, CA 93420
|
1,427 sq. feet
|
2 baths 3 beds |
show details | |

|
#30
Farroll Ave
Arroyo Grande, CA 93420
|
1,553 sq. feet
|
2 baths 3 beds |
show details |
| Photo | Address | Area | Beds / Baths | Price | Details |
|---|---|---|---|---|---|

|
#31
9th St
Los Osos, CA 93402
|
1,120 sq. feet
|
2 baths 3 beds |
show details | |

|
#32
Viola Ct
Nipomo, CA 93444
|
1,782 sq. feet
|
2 baths 3 beds |
show details | |

|
#33
Corbett Canyon Rd
Arroyo Grande, CA 93420
|
2,362 sq. feet
|
2 baths 2 beds |
show details | |

|
#34
Juleston Dr
Santa Maria, CA 93458
|
- sq. feet
|
2 baths 3 beds |
show details | |

|
#35
W Creston St
Santa Maria, CA 93458
|
- sq. feet
|
2 baths 3 beds |
show details | |

|
#36
Hanover Way
Santa Maria, CA 93458
|
- sq. feet
|
2 baths 3 beds |
show details | |

|
#37
Juleston Dr
Santa Maria, CA 93458
|
- sq. feet
|
2 baths 4 beds |
show details | |

|
#38
Arriba Way
Santa Maria, CA 93458
|
- sq. feet
|
2 baths 3 beds |
show details | |

|
#39
Carlin Dr
Guadalupe, CA 93434
|
- sq. feet
|
2 baths 5 beds |
show details | |

|
#40
Mary Dr
Santa Maria, CA 93458
|
- sq. feet
|
2 baths 3 beds |
show details |
| Photo | Address | Area | Beds / Baths | Price | Details |
|---|---|---|---|---|---|

|
#41
N 2nd St
Grover Beach, CA 93433
|
- sq. feet
|
- baths - beds |
show details | |

|
#42
Murray Ave Apt 40
San Luis Obispo, CA 93405
|
- sq. feet
|
- baths - beds |
show details | |

|
#43
Brighton Ave Apt 35
Grover Beach, CA 93433
|
- sq. feet
|
- baths - beds |
show details | |

|
#44
S 14th St
Grover Beach, CA 93433
|
- sq. feet
|
- baths - beds |
show details | |

|
#45
E Grand Ave # 102
Arroyo Grande, CA 93420
|
- sq. feet
|
- baths - beds |
show details | |

|
#46
Noyes Rd
Arroyo Grande, CA 93420
|
- sq. feet
|
- baths - beds |
show details | |

|
#47
Purported From Said Tax Sheet:, 301 Highland Dr
Los Osos, CA 93402
|
- sq. feet
|
- baths - beds |
show details | |

|
#48
Ocean View Ave, Apt 2
Oceano, CA 93445
|
- sq. feet
|
- baths - beds |
show details | |

|
#49
Cienaga St Apt C
Oceano, CA 93445
|
- sq. feet
|
- baths - beds |
show details | |

|
Check over 1 million property listings on Foreclosure.com!
|
browse all offers | |||


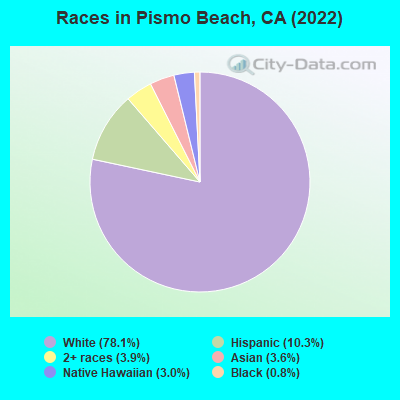
- 6,29178.1%White alone
- 82910.3%Hispanic
- 3143.9%Two or more races
- 2943.6%Asian alone
- 2403.0%Native Hawaiian and Other
Pacific Islander alone - 680.8%Black alone
- 70.09%American Indian alone
According to our research of California and other state lists, there were 6 registered sex offenders living in Pismo Beach, California as of April 23, 2024.
The ratio of all residents to sex offenders in Pismo Beach is 1,351 to 1.
The ratio of registered sex offenders to all residents in this city is lower than the state average.
Type |
2009 |
2010 |
2011 |
2012 |
2013 |
2014 |
2015 |
2016 |
2017 |
2018 |
2019 |
2020 |
2022 |
|---|---|---|---|---|---|---|---|---|---|---|---|---|---|
| Murders (per 100,000) | 0 (0.0) | 0 (0.0) | 0 (0.0) | 0 (0.0) | 0 (0.0) | 0 (0.0) | 0 (0.0) | 0 (0.0) | 0 (0.0) | 0 (0.0) | 0 (0.0) | 0 (0.0) | 0 (0.0) |
| Rapes (per 100,000) | 2 (23.3) | 3 (39.2) | 2 (25.8) | 7 (89.8) | 5 (63.9) | 2 (25.3) | 5 (62.5) | 4 (48.4) | 3 (36.2) | 3 (36.0) | 0 (0.0) | 4 (48.6) | 3 (37.4) |
| Robberies (per 100,000) | 5 (58.3) | 5 (65.3) | 5 (64.6) | 7 (89.8) | 3 (38.3) | 8 (101.1) | 5 (62.5) | 6 (72.6) | 4 (48.2) | 3 (36.0) | 6 (72.4) | 6 (72.9) | 8 (99.8) |
| Assaults (per 100,000) | 8 (93.3) | 16 (209.0) | 24 (309.9) | 22 (282.1) | 14 (178.9) | 16 (202.3) | 10 (125.0) | 2 (24.2) | 35 (422.1) | 24 (288.4) | 23 (277.6) | 46 (559.2) | 84 (1,048) |
| Burglaries (per 100,000) | 75 (874.8) | 75 (979.8) | 84 (1,085) | 79 (1,013) | 146 (1,866) | 162 (2,048) | 142 (1,775) | 80 (968.1) | 88 (1,061) | 129 (1,550) | 89 (1,074) | 37 (449.8) | 31 (386.8) |
| Thefts (per 100,000) | 306 (3,569) | 267 (3,488) | 205 (2,647) | 214 (2,744) | 159 (2,032) | 212 (2,680) | 361 (4,514) | 410 (4,961) | 283 (3,413) | 295 (3,544) | 236 (2,849) | 251 (3,051) | 245 (3,057) |
| Auto thefts (per 100,000) | 11 (128.3) | 5 (65.3) | 26 (335.7) | 12 (153.9) | 12 (153.4) | 13 (164.3) | 24 (300.1) | 23 (278.3) | 22 (265.3) | 15 (180.2) | 16 (193.1) | 14 (170.2) | 17 (212.1) |
| Arson (per 100,000) | 0 (0.0) | 0 (0.0) | 0 (0.0) | 3 (38.5) | 0 (0.0) | 2 (25.3) | 2 (25.0) | 0 (0.0) | 1 (12.1) | 1 (12.0) | 1 (12.1) | 2 (24.3) | 1 (12.5) |
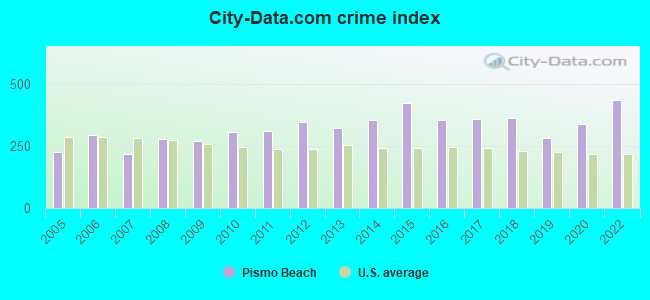
| City-Data.com crime index | 269.1 | 306.1 | 310.7 | 348.2 | 322.6 | 354.7 | 422.6 | 353.8 | 359.9 | 362.0 | 281.8 | 339.8 | 435.8 |
The City-Data.com crime index weighs serious crimes and violent crimes more heavily. Higher means more crime, U.S. average is 246.1. It adjusts for the number of visitors and daily workers commuting into cities.
Crime rate in Pismo Beach detailed stats: murders, rapes, robberies, assaults, burglaries, thefts, arson
Full-time law enforcement employees in 2021, including police officers: 31 (21 officers - 18 male; 3 female).
| Officers per 1,000 residents here: | 2.63 |
| California average: | 2.30 |
 Recent articles from our blog. Our writers, many of them Ph.D. graduates or candidates, create easy-to-read articles on a wide variety of topics.

 | Do we underestimate and downplay how Great Sacramento weather really is? (4521 replies) |
| 1 week roadtrip help (80 replies) |
| Summer Trip 2024-And Questions (17 replies) |
| Santa Barbara, Santa Maria or San Luis Obispo? (204 replies) |
| The nation’s hottest housing market? Surprise — it’s Fresno (76 replies) |
| Santa Barbara vs other Central California Beach Towns (18 replies) |
Latest news from Pismo Beach, CA collected exclusively by city-data.com from local newspapers, TV, and radio stations
Ancestries: German (11.6%), English (7.9%), Irish (7.7%), Portuguese (6.4%), American (5.5%), French (4.0%).
Current Local Time: PST time zone
Elevation: 33 feet
Land area: 3.61 square miles.
Population density: 2,226 people per square mile (low).
606 residents are foreign born (3.0% Asia, 2.2% Latin America, 1.9% Europe).
| This city: | 7.5% |
| California: | 26.5% |
Median real estate property taxes paid for housing units with mortgages in 2022: $6,923 (0.7%)
Median real estate property taxes paid for housing units with no mortgage in 2022: $5,632 (0.6%)
Nearest city with pop. 50,000+: Santa Maria, CA  (18.3 miles , pop. 77,423).
Nearest city with pop. 200,000+: Bakersfield, CA (92.4 miles , pop. 247,057).
Nearest city with pop. 1,000,000+: Los Angeles, CA (148.7 miles , pop. 3,694,820).
Nearest cities:
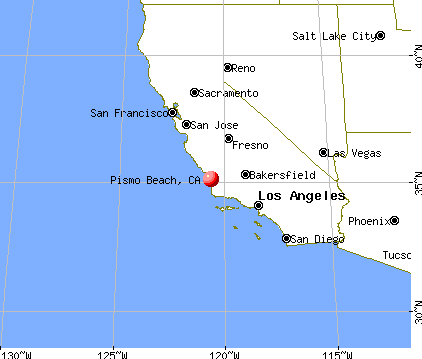
), ), ), )Latitude: 35.15 N, Longitude: 120.65 W
Daytime population change due to commuting: +1,497 (+18.6%)
Workers who live and work in this city: 1,158 (29.8%)
Area code: 805
Pismo Beach, California accommodation & food services, waste management - Economy and Business Data
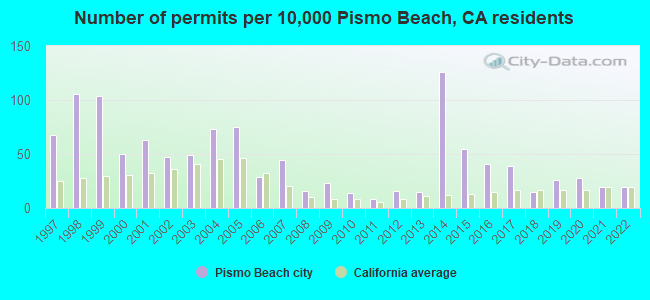
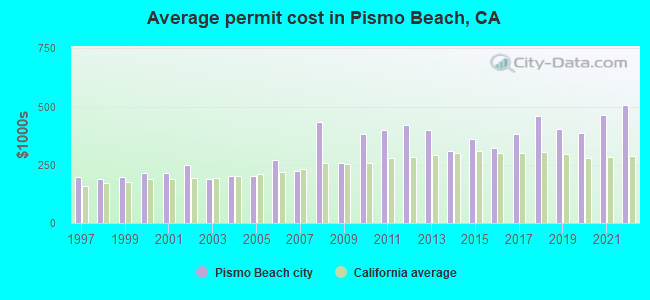
Single-family new house construction building permits:
- 2022: 16 buildings, average cost: $507,500
- 2021: 16 buildings, average cost: $463,100
- 2020: 24 buildings, average cost: $386,000
- 2019: 22 buildings, average cost: $403,300
- 2018: 13 buildings, average cost: $461,300
- 2017: 33 buildings, average cost: $382,200
- 2016: 35 buildings, average cost: $321,600
- 2015: 47 buildings, average cost: $362,100
- 2014: 108 buildings, average cost: $311,100
- 2013: 13 buildings, average cost: $397,600
- 2012: 14 buildings, average cost: $422,200
- 2011: 7 buildings, average cost: $399,400
- 2010: 12 buildings, average cost: $383,500
- 2009: 20 buildings, average cost: $256,200
- 2008: 14 buildings, average cost: $433,000
- 2007: 38 buildings, average cost: $224,800
- 2006: 25 buildings, average cost: $270,500
- 2005: 64 buildings, average cost: $203,200
- 2004: 62 buildings, average cost: $203,200
- 2003: 42 buildings, average cost: $191,300
- 2002: 40 buildings, average cost: $247,600
- 2001: 54 buildings, average cost: $215,600
- 2000: 43 buildings, average cost: $214,300
- 1999: 89 buildings, average cost: $198,300
- 1998: 91 buildings, average cost: $188,700
- 1997: 58 buildings, average cost: $197,600
| Here: | 3.6% |
| California: | 5.1% |
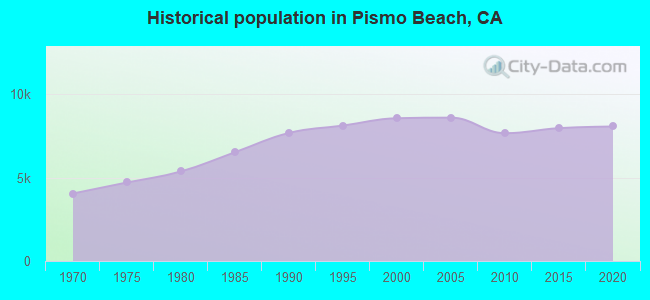
Population change in the 1990s: +778 (+10.0%).
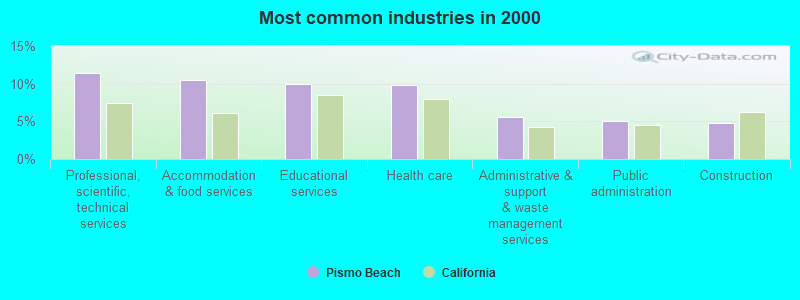
- Professional, scientific, technical services (11.4%)
- Accommodation & food services (10.5%)
- Educational services (9.9%)
- Health care (9.8%)
- Administrative & support & waste management services (5.5%)
- Public administration (5.0%)
- Construction (4.7%)
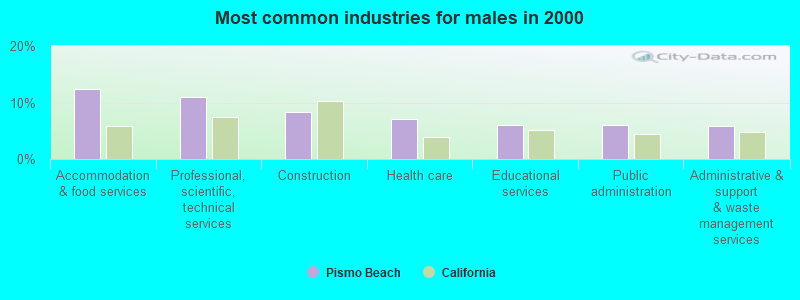
- Accommodation & food services (12.4%)
- Professional, scientific, technical services (10.9%)
- Construction (8.3%)
- Health care (7.1%)
- Educational services (6.1%)
- Public administration (6.0%)
- Administrative & support & waste management services (5.8%)
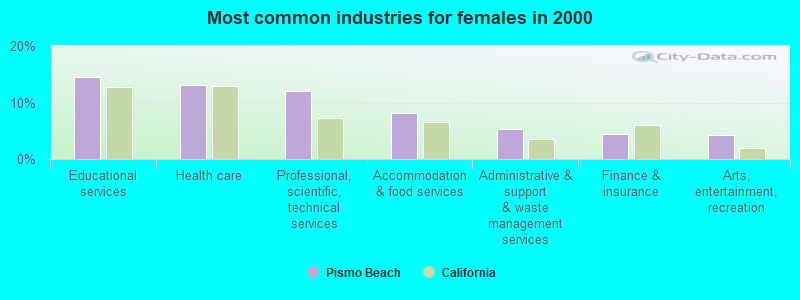
- Educational services (14.5%)
- Health care (13.0%)
- Professional, scientific, technical services (12.1%)
- Accommodation & food services (8.2%)
- Administrative & support & waste management services (5.2%)
- Finance & insurance (4.5%)
- Arts, entertainment, recreation (4.2%)
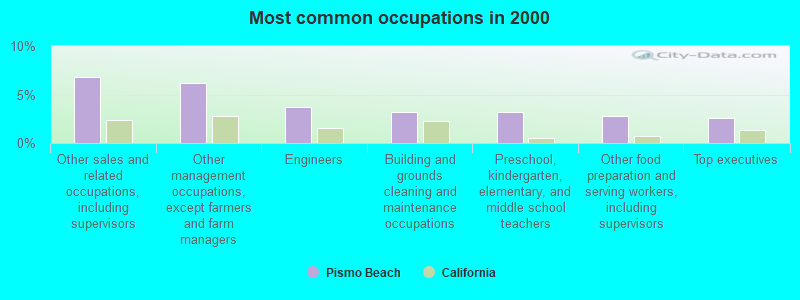
- Other sales and related occupations, including supervisors (6.8%)
- Other management occupations, except farmers and farm managers (6.2%)
- Engineers (3.7%)
- Building and grounds cleaning and maintenance occupations (3.2%)
- Preschool, kindergarten, elementary, and middle school teachers (3.2%)
- Other food preparation and serving workers, including supervisors (2.8%)
- Top executives (2.5%)
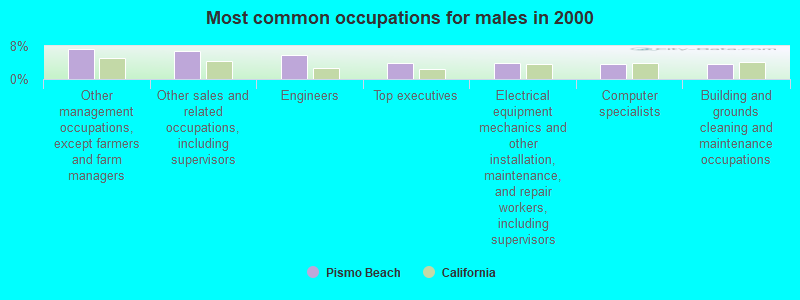
- Other management occupations, except farmers and farm managers (7.2%)
- Other sales and related occupations, including supervisors (6.8%)
- Engineers (5.9%)
- Top executives (3.9%)
- Electrical equipment mechanics and other installation, maintenance, and repair workers, including supervisors (3.9%)
- Computer specialists (3.6%)
- Building and grounds cleaning and maintenance occupations (3.5%)
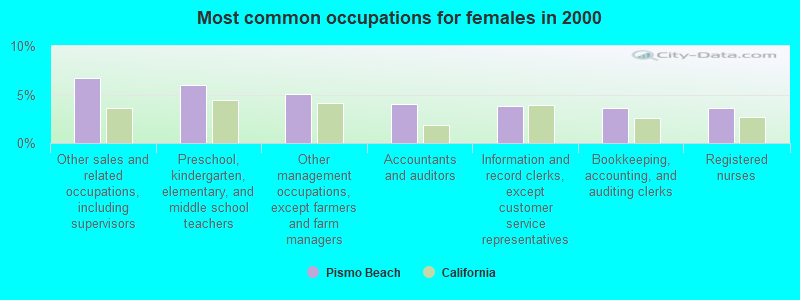
- Other sales and related occupations, including supervisors (6.7%)
- Preschool, kindergarten, elementary, and middle school teachers (6.0%)
- Other management occupations, except farmers and farm managers (5.0%)
- Accountants and auditors (4.0%)
- Information and record clerks, except customer service representatives (3.8%)
- Bookkeeping, accounting, and auditing clerks (3.6%)
- Registered nurses (3.6%)
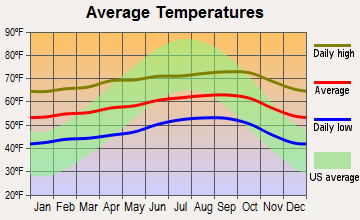
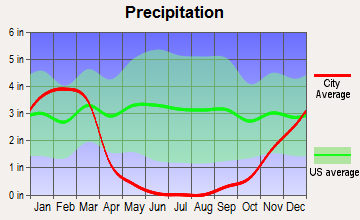
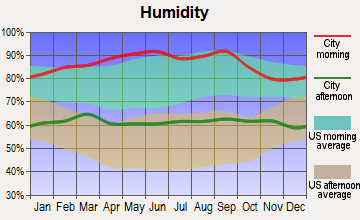
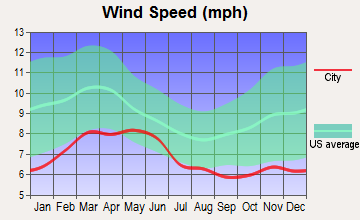
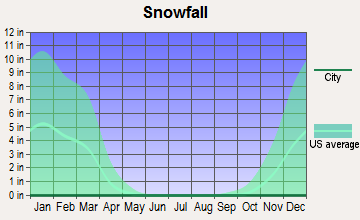
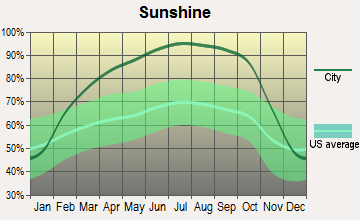
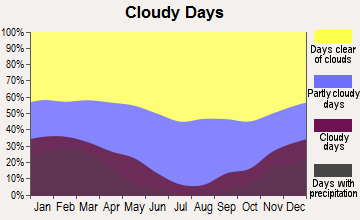
Average climate in Pismo Beach, California
Based on data reported by over 4,000 weather stations
|
|


(lower is better)
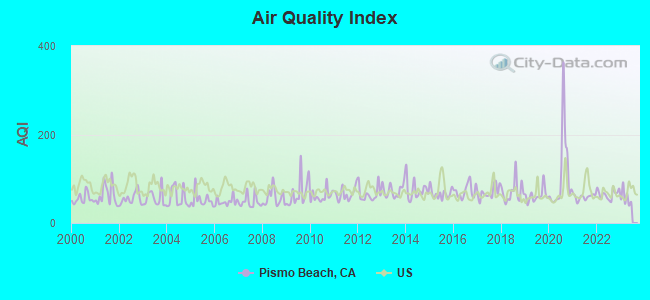
Air Quality Index (AQI) level in 2022 was 65.2. This is about average.
| City: | 65.2 |
| U.S.: | 72.6 |
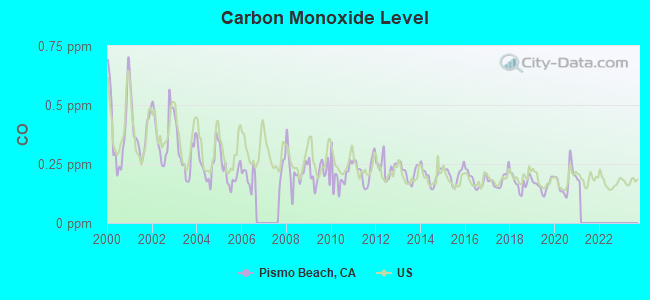
Carbon Monoxide (CO) [ppm] level in 2020 was 0.180. This is better than average. Closest monitor was 7.6 miles away from the city center.
| City: | 0.180 |
| U.S.: | 0.251 |
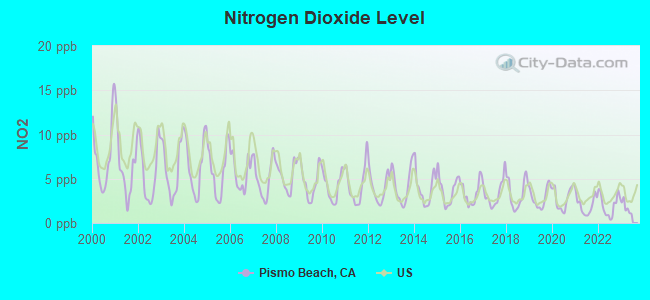
Nitrogen Dioxide (NO2) [ppb] level in 2022 was 2.03. This is significantly better than average. Closest monitor was 1.0 miles away from the city center.
| City: | 2.03 |
| U.S.: | 5.11 |
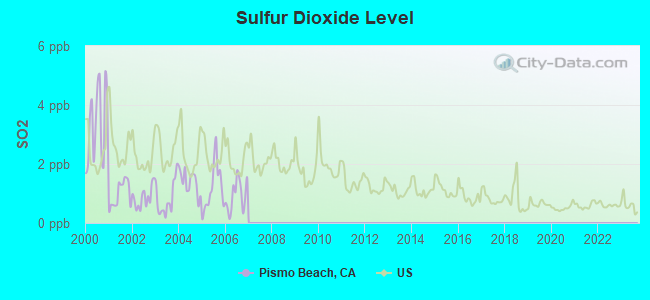
Sulfur Dioxide (SO2) [ppb] level in 2006 was 0.937. This is significantly better than average. Closest monitor was 1.0 miles away from the city center.
| City: | 0.937 |
| U.S.: | 1.515 |
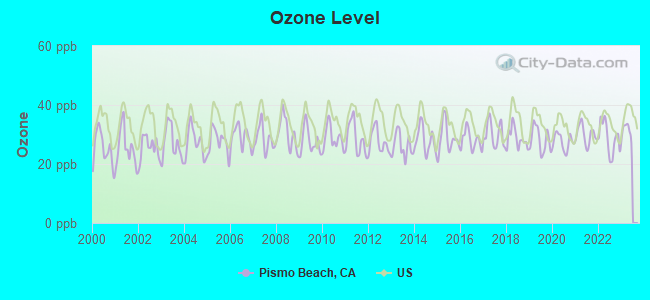
Ozone [ppb] level in 2022 was 28.8. This is about average. Closest monitor was 1.9 miles away from the city center.
| City: | 28.8 |
| U.S.: | 33.3 |
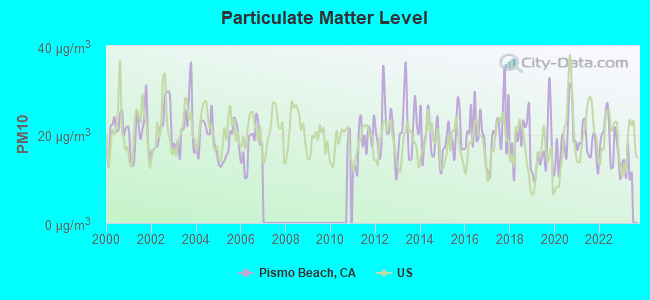
Particulate Matter (PM10) [µg/m3] level in 2022 was 18.4. This is about average. Closest monitor was 7.6 miles away from the city center.
| City: | 18.4 |
| U.S.: | 19.2 |
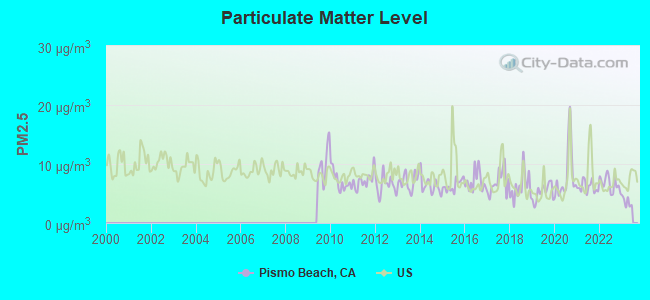
Particulate Matter (PM2.5) [µg/m3] level in 2022 was 6.64. This is better than average. Closest monitor was 7.6 miles away from the city center.
| City: | 6.64 |
| U.S.: | 8.11 |
Earthquake activity:
Pismo Beach-area historical earthquake activity is significantly above California state average. It is 6708% greater than the overall U.S. average.On 11/4/1927 at 13:51:53, a magnitude 7.5 (7.5 UK, Class: Major, Intensity: VIII - XII) earthquake occurred 27.0 miles away from Pismo Beach center
On 7/21/1952 at 11:52:14, a magnitude 7.7 (7.7 UK) earthquake occurred 93.9 miles away from the city center, causing $50,000,000 total damage
On 4/18/1906 at 13:12:21, a magnitude 7.9 (7.9 UK) earthquake occurred 236.6 miles away from Pismo Beach center, causing $524,000,000 total damage
On 6/28/1992 at 11:57:34, a magnitude 7.6 (6.2 MB, 7.6 MS, 7.3 MW, Depth: 0.7 mi) earthquake occurred 243.4 miles away from Pismo Beach center, causing 3 deaths (1 shaking deaths, 2 other deaths) and 400 injuries, causing $100,000,000 total damage and $40,000,000 insured losses
On 10/18/1989 at 00:04:15, a magnitude 7.1 (6.5 MB, 7.1 MS, 6.9 MW, 7.0 ML) earthquake occurred 149.5 miles away from Pismo Beach center, causing 62 deaths (62 shaking deaths) and 3757 injuries, causing $1,305,032,704 total damage
On 12/22/2003 at 19:15:56, a magnitude 6.6 (6.1 MB, 6.4 MS, 6.6 MW, 6.4 MW, Class: Strong, Intensity: VII - IX) earthquake occurred 40.4 miles away from the city center, causing 2 deaths (2 shaking deaths) and 40 injuries, causing $200,000,000 total damage
Magnitude types: body-wave magnitude (MB), local magnitude (ML), surface-wave magnitude (MS), moment magnitude (MW)
Natural disasters:
The number of natural disasters in San Luis Obispo County (20) is greater than the US average (15).Major Disasters (Presidential) Declared: 14
Emergencies Declared: 2
Causes of natural disasters: Floods: 14, Storms: 7, Winter Storms: 7, Mudslides: 5, Landslides: 3, Drought: 1, Earthquake: 1, Fire: 1, Freeze: 1, Hurricane: 1, Tornado: 1, Other: 1 (Note: some incidents may be assigned to more than one category).
Hospitals and medical centers in Pismo Beach:
Other hospitals and medical centers near Pismo Beach:
- BRIGHTON AVENUE HOME (Hospital, about 3 miles away; GROVER BEACH, CA)
- ARROYO GRANDE CARE CENTER (Nursing Home, about 4 miles away; ARROYO GRANDE, CA)
- TAYLOR COMMUNITY HOME (Hospital, about 4 miles away; ARROYO GRANDE, CA)
- MARIAN REGIONAL MEDICAL CENTER, ARROYO GRANDE Acute Care Hospitals (about 5 miles away; ARROYO GRANDE, CA)
- PIKE, THE (Hospital, about 5 miles away; ARROYO GRANDE, CA)
- CHUPARROSA STREET HOME (Hospital, about 7 miles away; SAN LUIS OBISPO, CA)
- CENTRAL COAST HOME HEALTH INC (Home Health Center, about 8 miles away; SAN LUIS OBISPO, CA)
Amtrak stations near Pismo Beach:
- 3 miles: GROVER BEACH (180 GRAND AVE.) . Services: fully wheelchair accessible, enclosed waiting area, public payphones, free short-term parking, free long-term parking, call for car rental service, call for taxi service.
- 9 miles: SAN LUIS OBISPO (RAILROAD AVE & SANTA ROSA ST.) . Services: ticket office, fully wheelchair accessible, enclosed waiting area, public restrooms, public payphones, vending machines, free short-term parking, free long-term parking, call for car rental service, call for taxi service, public transit connection.
- 10 miles: SAN LUIS OBISPO-CAL POLY (SAN LUIS OBISPO, GRAND AVE.) - Bus Station . Services: fully wheelchair accessible, public payphones, full-service food facilities, call for car rental service, call for taxi service.
Operable nuclear power plants near Pismo Beach:
- 6 miles: Diablo Canyon 1 and 2 in Avila Beach, CA.
Colleges/universities with over 2000 students nearest to Pismo Beach:
- California Polytechnic State University-San Luis Obispo (about 11 miles; San Luis Obispo, CA; Full-time enrollment: 17,345)
- Cuesta College (about 14 miles; San Luis Obispo, CA; FT enrollment: 6,518)
- Allan Hancock College (about 20 miles; Santa Maria, CA; FT enrollment: 6,639)
- Taft College (about 68 miles; Taft, CA; FT enrollment: 2,121)
- University of California-Santa Barbara (about 69 miles; Santa Barbara, CA; FT enrollment: 22,806)
- Santa Barbara City College (about 75 miles; Santa Barbara, CA; FT enrollment: 12,568)
- California State University-Bakersfield (about 89 miles; Bakersfield, CA; FT enrollment: 7,564)
Public elementary/middle schools in Pismo Beach:
- JUDKINS MIDDLE (Students: 482, Location: 680 WADSWORTH ST., Grades: 7-8)
- SHELL BEACH ELEMENTARY (Students: 300, Location: 2100 SHELL BEACH RD., Grades: KG-6)
User-submitted facts and corrections:
- Pismo Beach has some beaches. added by jewels
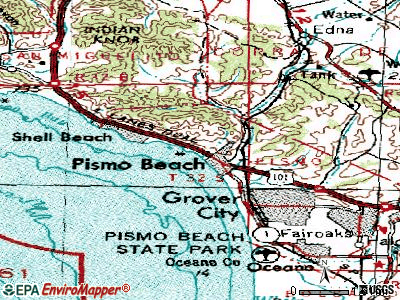
Points of interest:
Notable locations in Pismo Beach: North Beach Campground (A), Pismo Dunes Travel Trailer Park (B), Pismo Coast Village Recreational Vehicle Resort (C), Holiday Recreational Vehicle Park (D), Shell Beach Branch San Luis Obispo City-County Library (E), Pismo Beach City Hall (F), Pismo Beach Chamber of Commerce (G), Old Days Museum (H), California Department of Forestry and Fire Protection Station 63 Shell Beach (I), California Department of Forestry and Fire Protection Station 64 Pismo Beach (J). Display/hide their locations on the map
Shopping Centers: Pismo Coast Shopping Plaza Shopping Center (1), Pismo Beach Outlet Shopping Center (2), Oak Park Heights Shopping Center (3). Display/hide their locations on the map
Churches in Pismo Beach include: Centro Evangelistico (A), Community Presbyterian Church (B), First Church of Christ Scientist (C), Saint Pauls Catholic Church (D), Shell Beach United Methodist Church (E), Trinity Free Holiness Church (F), Word of Life Church (G). Display/hide their locations on the map
Swamps: Pismo Lake (A). Display/hide its location on the map
Creek: Pismo Creek (A). Display/hide its location on the map
Parks in Pismo Beach include: Margo Dodd Park (1), Ocean Park (2), Palisades Park (3), Pismo Beach City Park (4), Pismo Lake Ecological Reserve (5), Spyglass Park (6). Display/hide their locations on the map
Tourist attraction: Beachwest Boardwalk (Amusement & Theme Parks; 175 Pomeroy Avenue) (1). Display/hide its approximate location on the map
Hotels: Beachwalker Inn & Suites (490 Dolliver Street) (1), Best Western Shelter Cove Lodg (2651 Price Street) (2), Beachfront Vacation Houses (Po Box 27) (3), Beach House Inn & Suites (198 Main Street) (4), Abfab Short Term Rentals (Po Box 27) (5), Beachcomber Inn (541 Cypress Street) (6), Best Western Shore Cliff Lodge (2555 Price Street) (7), Blue Seal Inn (230 Dolliver Street) (8). Display/hide their approximate locations on the map
| This city: | 2.0 people |
| California: | 2.9 people |
| This city: | 54.2% |
| Whole state: | 68.7% |
| This city: | 7.1% |
| Whole state: | 7.2% |
Likely homosexual households (counted as self-reported same-sex unmarried-partner households)
- Lesbian couples: 0.6% of all households
- Gay men: 0.4% of all households
People in group quarters in Pismo Beach in 2000:
- 20 people in other noninstitutional group quarters
- 4 people in homes for the mentally retarded
- 3 people in religious group quarters
Banks with branches in Pismo Beach (2011 data):
- Rabobank, National Association: Pismo Beach Branch at 801 Price Street, branch established on 1986/03/03; Oak Park Branch at 865 Oak Park Boulevard, branch established on 1988/05/09. Info updated 2011/01/27: Bank assets: $11,745.0 mil, Deposits: $8,446.0 mil, headquarters in Roseville, CA, positive income, Agricultural Specialization, 124 total offices, Holding Company: Cooperatieve Centrale Raiffeisen-Boerenleenbank B.A., "rabobank Nederland
- Pacific Western Bank: Pismo Beach Branch at 831 Oak Park Blvd., branch established on 1988/06/30. Info updated 2011/03/14: Bank assets: $5,513.1 mil, Deposits: $4,614.5 mil, headquarters in Los Angeles, CA, positive income, Commercial Lending Specialization, 78 total offices, Holding Company: Capgen Capital Group Ii Lp
- Bank of America, National Association: Pismo Beach Branch at 1401 Dolliver Street, branch established on 1934/12/24. Info updated 2009/11/18: Bank assets: $1,451,969.3 mil, Deposits: $1,077,176.8 mil, headquarters in Charlotte, NC, positive income, 5782 total offices, Holding Company: Bank Of America Corporation
For population 15 years and over in Pismo Beach:
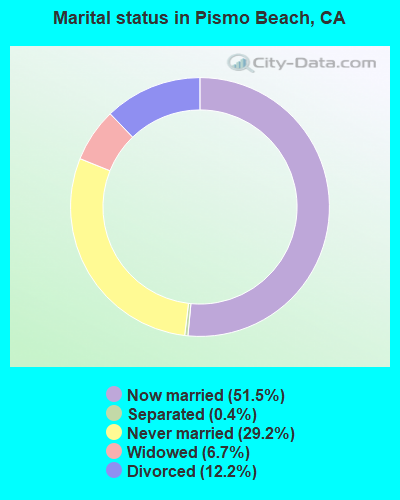
- Never married: 29.2%
- Now married: 51.5%
- Separated: 0.4%
- Widowed: 6.7%
- Divorced: 12.2%
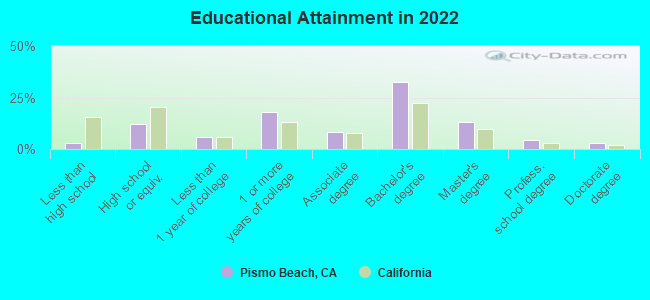
For population 25 years and over in Pismo Beach:
- High school or higher: 96.7%
- Bachelor's degree or higher: 49.0%
- Graduate or professional degree: 19.7%
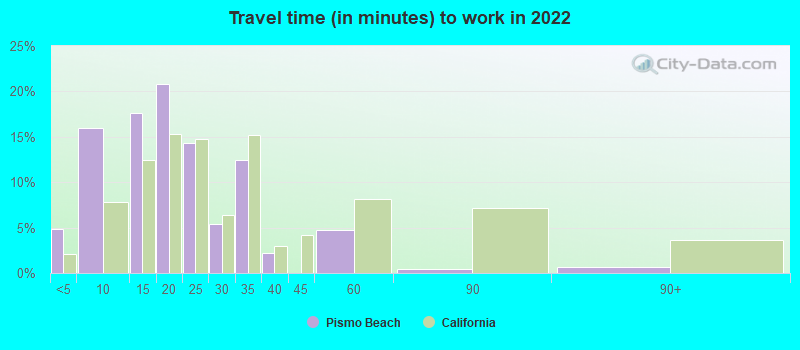
- Unemployed: 5.1%
- Mean travel time to work (commute): 15.5 minutes
| Here: | 8.8 |
| California average: | 15.5 |
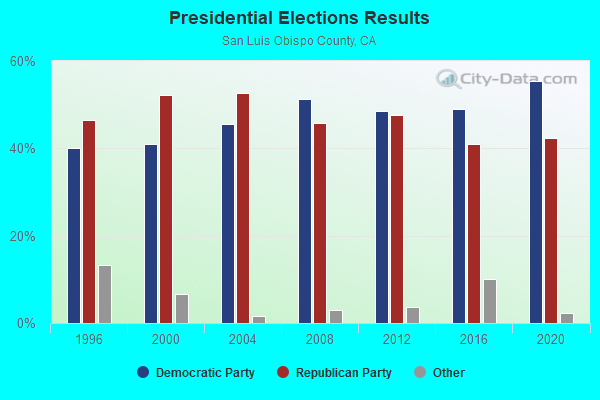
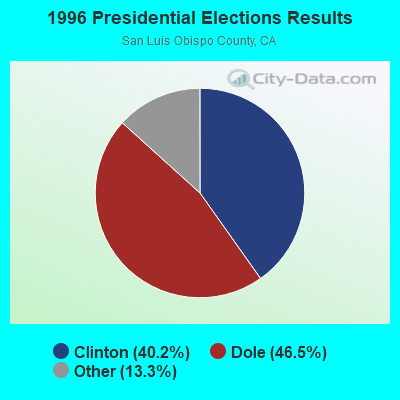
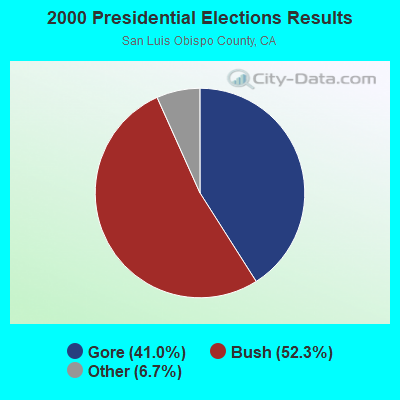
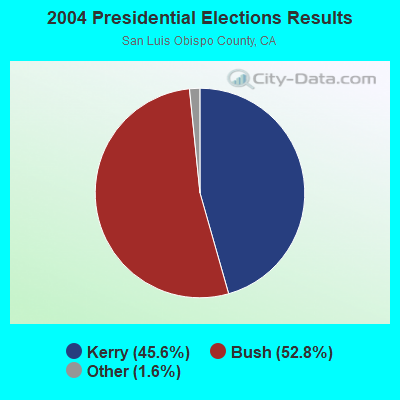
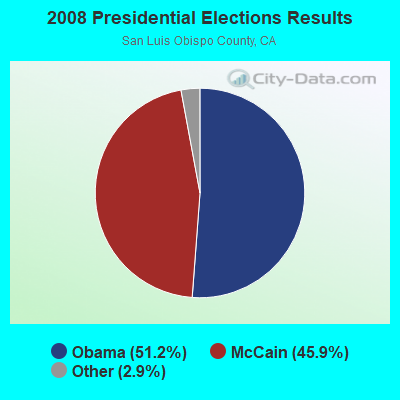
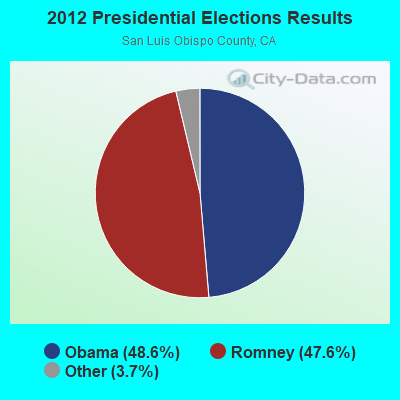
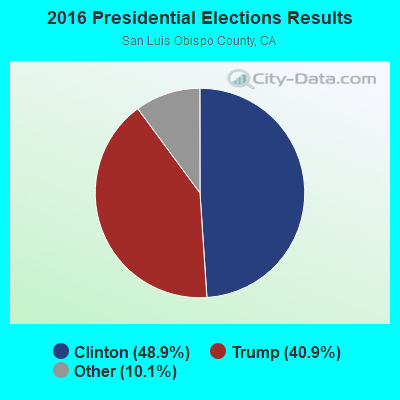
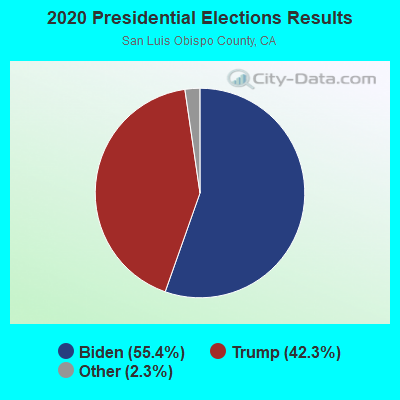
Graphs represent county-level data. Detailed 2008 Election Results
Religion statistics for Pismo Beach, CA (based on San Luis Obispo County data)
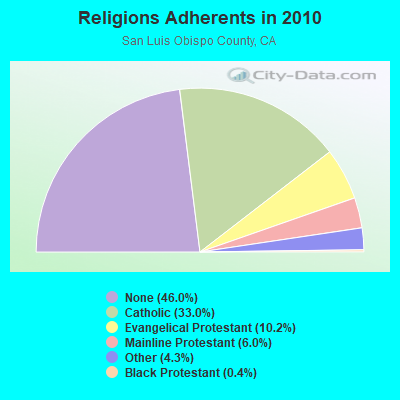
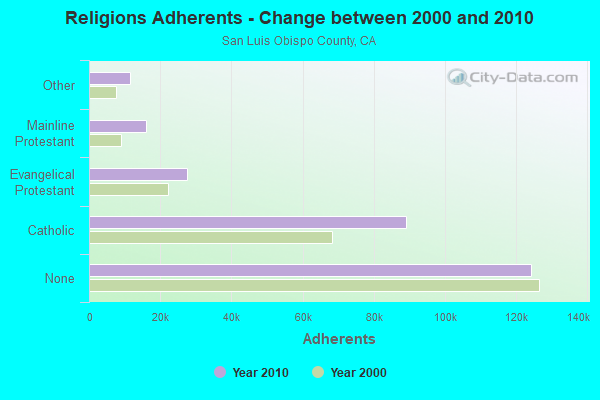
| Religion | Adherents | Congregations |
|---|---|---|
| Catholic | 89,075 | 17 |
| Evangelical Protestant | 27,483 | 138 |
| Mainline Protestant | 16,099 | 56 |
| Other | 11,530 | 47 |
| Black Protestant | 1,078 | 3 |
| Orthodox | 205 | 2 |
| None | 124,167 | - |
Food Environment Statistics:
| San Luis Obispo County: | 2.29 / 10,000 pop. |
| State: | 2.14 / 10,000 pop. |
| This county: | 0.04 / 10,000 pop. |
| State: | 0.04 / 10,000 pop. |
| This county: | 0.69 / 10,000 pop. |
| State: | 0.62 / 10,000 pop. |
| Here: | 2.22 / 10,000 pop. |
| State: | 1.49 / 10,000 pop. |
| Here: | 11.00 / 10,000 pop. |
| State: | 7.42 / 10,000 pop. |
| This county: | 6.1% |
| California: | 7.3% |
| San Luis Obispo County: | 21.5% |
| State: | 21.3% |
| This county: | 14.5% |
| State: | 17.9% |
Health and Nutrition:
| Here: | 53.5% |
| California: | 49.4% |
| Here: | 51.1% |
| State: | 48.0% |
| This city: | 28.4 |
| California: | 28.1 |
| Pismo Beach: | 18.6% |
| California: | 20.2% |
| Pismo Beach: | 10.0% |
| California: | 11.2% |
| Here: | 6.9 |
| California: | 6.8 |
| Here: | 35.0% |
| State: | 31.5% |
| Pismo Beach: | 58.3% |
| California: | 56.4% |
| Pismo Beach: | 77.3% |
| State: | 80.9% |
More about Health and Nutrition of Pismo Beach, CA Residents
| Local government employment and payroll (March 2022) | |||||
| Function | Full-time employees | Monthly full-time payroll | Average yearly full-time wage | Part-time employees | Monthly part-time payroll |
|---|---|---|---|---|---|
| Police Protection - Officers | 22 | $229,544 | $125,206 | 0 | $0 |
| Other and Unallocable | 13 | $109,821 | $101,373 | 16 | $12,343 |
| Police - Other | 12 | $89,994 | $89,994 | 1 | $1,650 |
| Other Government Administration | 10 | $121,808 | $146,170 | 2 | $695 |
| Streets and Highways | 9 | $73,070 | $97,427 | 1 | $1,653 |
| Parks and Recreation | 9 | $48,149 | $64,199 | 7 | $16,229 |
| Financial Administration | 8 | $60,469 | $90,704 | 1 | $143 |
| Water Supply | 5 | $28,558 | $68,539 | 0 | $0 |
| Sewerage | 5 | $34,677 | $83,225 | 0 | $0 |
| Totals for Government | 93 | $796,090 | $102,721 | 28 | $32,713 |
Pismo Beach government finances - Expenditure in 2017 (per resident):
- Construction - Protective Inspection and Regulation - Other: $2,089,000 ($259.70)
Water Utilities: $501,000 ($62.28)
Housing and Community Development: $176,000 ($21.88)
- Current Operations - Police Protection: $5,550,000 ($689.96)
Central Staff Services: $5,437,000 ($675.91)
Water Utilities: $4,664,000 ($579.81)
Parks and Recreation: $3,095,000 ($384.76)
Sewerage: $2,592,000 ($322.23)
Local Fire Protection: $2,376,000 ($295.38)
Protective Inspection and Regulation - Other: $1,338,000 ($166.34)
Regular Highways: $899,000 ($111.76)
Parking Facilities: $399,000 ($49.60)
General - Other: $68,000 ($8.45)
Sea and Inland Port Facilities: $62,000 ($7.71)
Transit Utilities: $11,000 ($1.37)
- General - Interest on Debt: $542,000 ($67.38)
- Other Capital Outlay - Police Protection: $66,000 ($8.20)
Sewerage: $9,000 ($1.12)
Pismo Beach government finances - Revenue in 2017 (per resident):
- Charges - Other: $7,327,000 ($910.87)
Sewerage: $4,397,000 ($546.62)
Parking Facilities: $724,000 ($90.00)
Parks and Recreation: $266,000 ($33.07)
Sea and Inland Port Facilities: $35,000 ($4.35)
- Federal Intergovernmental - Other: $220,000 ($27.35)
- Local Intergovernmental - Other: $45,000 ($5.59)
Transit Utilities: $15,000 ($1.86)
- Miscellaneous - General Revenue - Other: $2,653,000 ($329.81)
Special Assessments: $474,000 ($58.93)
Interest Earnings: $344,000 ($42.76)
Rents: $133,000 ($16.53)
Fines and Forfeits: $62,000 ($7.71)
- Revenue - Water Utilities: $4,718,000 ($586.52)
- State Intergovernmental - Other: $773,000 ($96.10)
Highways: $187,000 ($23.25)
General Local Government Support: $28,000 ($3.48)
- Tax - Other Selective Sales: $9,331,000 ($1160.00)
Property: $5,055,000 ($628.42)
General Sales and Gross Receipts: $3,004,000 ($373.45)
Other: $1,493,000 ($185.60)
Other License: $1,096,000 ($136.25)
Public Utilities Sales: $605,000 ($75.21)
Occupation and Business License - Other: $218,000 ($27.10)
Documentary and Stock Transfer: $127,000 ($15.79)
Pismo Beach government finances - Debt in 2017 (per resident):
- Long Term Debt - Outstanding Unspecified Public Purpose: $22,771,000 ($2830.81)
Beginning Outstanding - Unspecified Public Purpose: $22,132,000 ($2751.37)
Issue, Unspecified Public Purpose: $7,685,000 ($955.37)
Retired Unspecified Public Purpose: $7,045,000 ($875.81)
Pismo Beach government finances - Cash and Securities in 2017 (per resident):
- Bond Funds - Cash and Securities: $3,456,000 ($429.64)
- Other Funds - Cash and Securities: $51,473,000 ($6398.93)
- Sinking Funds - Cash and Securities: $108,000 ($13.43)
6.17% of this county's 2020 resident taxpayers moved to other counties in 2021 ($68,140 average adjusted gross income)
| Here: | 6.17% |
| California average: | 6.14% |
0.02% of residents moved to foreign countries ($212 average AGI)
San Luis Obispo County: 0.02% California average: 0.02%
Top counties to which taxpayers relocated from this county between 2020 and 2021:
| to Santa Barbara County, CA | |
| to Los Angeles County, CA | |
| to San Diego County, CA |
| Businesses in Pismo Beach, CA | ||||
| Name | Count | Name | Count | |
|---|---|---|---|---|
| 7-Eleven | 1 | Levi Strauss & Co. | 1 | |
| Aeropostale | 1 | McDonald's | 1 | |
| Best Western | 2 | Motel 6 | 1 | |
| CVS | 1 | New Balance | 1 | |
| Dennys | 1 | Nike | 1 | |
| DressBarn | 1 | Pac Sun | 1 | |
| Dressbarn | 1 | Quality | 1 | |
| Famous Footwear | 1 | Rite Aid | 1 | |
| FedEx | 3 | Rue21 | 1 | |
| GNC | 1 | SAS Shoes | 1 | |
| Gymboree | 1 | Starbucks | 1 | |
| H&R Block | 1 | Subway | 2 | |
| IZOD | 1 | Taco Bell | 1 | |
| Jones New York | 2 | UPS | 3 | |
| Journeys | 1 | Vans | 4 | |
| Lane Bryant | 1 | |||
Strongest AM radio stations in Pismo Beach:
- KXTK (1280 AM; 10 kW; ARROYO GRANDE, CA; Owner: PAMPLIN BROADCASTING, INC.)
- KGDP (660 AM; 50 kW; ORCUTT, CA; Owner: RADIO REPRESENTATIVES, INC.)
- KLFF (890 AM; 5 kW; ARROYO GRANDE, CA; Owner: JERRY J. COLLINS)
- KJDJ (1030 AM; 2 kW; SAN LUIS OBISPO, CA; Owner: PADRE SERRA COMMUNICATIONS, INC)
- KYNS (1340 AM; 1 kW; SAN LUIS OBISPO, CA; Owner: MAPLETON COMMUNICATIONS, LLC)
- KUHL (1440 AM; 5 kW; SANTA MARIA, CA; Owner: MAPLETON COMMUNICATIONS, LLC)
- KKJL (1400 AM; 1 kW; SAN LUIS OBISPO, CA; Owner: SAN LUIS OBISPO BROADCASTING, INC)
- KVEC (920 AM; 1 kW; SAN LUIS OBISPO, CA; Owner: CLEVELAND RADIO LICENSES, LLC)
- KERI (1180 AM; 50 kW; WASCO-GREENACRES, CA; Owner: KWSO, INC.)
- KMJ (580 AM; 50 kW; FRESNO, CA; Owner: INFINITY RADIO OPERATIONS INC.)
- KWRU (940 AM; 50 kW; FRESNO, CA)
- KSPN (710 AM; 50 kW; LOS ANGELES, CA; Owner: KABC-AM RADIO, INC.)
- KSMA (1240 AM; 1 kW; SANTA MARIA, CA; Owner: CLEAR CHANNEL BROADCASTING LICENSES, INC.)
Strongest FM radio stations in Pismo Beach:
- KXTZ (95.3 FM; PISMO BEACH, CA; Owner: MAPLETON COMMUNICATIONS, LLC)
- K244DE (96.7 FM; ARROYO GRANDE, ETC., CA; Owner: CALVARY CHAPEL OF TWIN FALLS, INC.)
- KURQ (107.3 FM; GROVER BEACH, CA; Owner: CLEAR CHANNEL BROADCASTING LICENSES, INC.)
- KSTT-FM (101.3 FM; LOS OSOS-BAYWOOD PAR, CA; Owner: CLEAR CHANNEL BROADCASTING LICENSES, INC.)
- KSLY-FM (96.1 FM; SAN LUIS OBISPO, CA; Owner: CLEAR CHANNEL BROADCASTING LICENSES, INC.)
- KKAL (99.7 FM; MORRO BAY, CA; Owner: SALISBURY BROADCASTING CORP.)
- KZOZ (93.3 FM; SAN LUIS OBISPO, CA; Owner: AMERICAN GENERAL MEDIA-TEXAS, INC.)
- KWSR (92.5 FM; PASO ROBLES, CA; Owner: LAGNIAPPE BROADCASTING, INC)
- KKJG (98.1 FM; SAN LUIS OBISPO, CA; Owner: AGM SAN LUIS OBISPO, L.P.)
- KWWV (106.1 FM; SANTA MARGARITA, CA; Owner: SALISBURY RADIO LLC)
- K209CE (89.7 FM; SAN LUIS OBISPO, CA; Owner: FAMILY STATIONS, INC.)
- KLRM (97.1 FM; SAN LUIS OBISPO, CA; Owner: GTM SAN LUIS OBISPO)
- KIQO (104.5 FM; ATASCADERO, CA; Owner: AMERICAN GENERAL MEDIA OF TEXAS, INC)
- KCBX (90.1 FM; SAN LUIS OBISPO, CA; Owner: KCBX, INC.)
- KLVH (88.5 FM; SAN LUIS OBISPO, CA; Owner: EDUCATIONAL MEDIA FOUNDATION)
- K213CO (90.5 FM; SAN LUIS OBISPO, CA; Owner: PENSACOLA CHRISTIAN COLLEGE, INC.)
- KIDI-FM (105.5 FM; GUADALUPE, CA; Owner: EMERALD WAVE MEDIA)
- KLMM (94.1 FM; MORRO BAY, CA; Owner: LAZER BROADCASTING CORPORATION)
- KXFM (99.1 FM; SANTA MARIA, CA; Owner: CLEAR CHANNEL BROADCASTING LICENSES, INC.)
- KRAZ (105.9 FM; SANTA YNEZ, CA; Owner: KNIGHT BROADCASTING, INC.)
TV broadcast stations around Pismo Beach:
- KAGP-LP (Channel 8; ARROYO GRANDE, CA; Owner: GARY M. COCOLA FAMILY TRUST, GARY M. COCOLA TRUSTEE)
- KSSY-LP (Channel 66; ARROYO GRANDE, CA; Owner: CHERIE ERWIN)
- KSBY (Channel 6; SAN LUIS OBISPO, CA; Owner: NVG-SANTA BARBARA II, LLC)
- KPXA-LP (Channel 42; SAN LUIS OBISPO, CA; Owner: CAMINO REAL COMMUNICATIONS LLC)
- K28FK (Channel 28; SAN LUIS OBISPO, CA; Owner: ENTRAVISION HOLDINGS, LLC)
- KCCE-LP (Channel 50; SAN LUIS OBISPO, CA; Owner: ANET COMMUNICATIONS, INC.)
- KFUL-LP (Channel 44; SAN LUIS OBISPO, CA; Owner: KJLA, LLC)
- National Bridge Inventory (NBI) Statistics
- 26Number of bridges
- 262ft / 79.7mTotal length
- 575,100Total average daily traffic
- 52,899Total average daily truck traffic
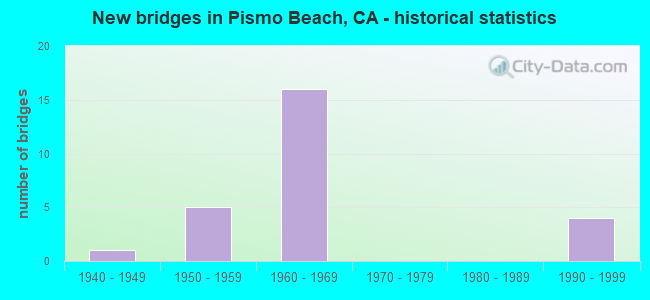
- New bridges - historical statistics
- 11940-1949
- 51950-1959
- 161960-1969
- 41990-1999
FCC Registered Cell Phone Towers:
1 (See the full list of FCC Registered Cell Phone Towers in Pismo Beach)FCC Registered Antenna Towers:
12 (See the full list of FCC Registered Antenna Towers)FCC Registered Broadcast Land Mobile Towers:
9 (See the full list of FCC Registered Broadcast Land Mobile Towers in Pismo Beach, CA)FCC Registered Microwave Towers:
6- VN0191-OAK PARK, 921 Oak Park Blvd (Lat: 35.136583 Lon: -120.605917), Type: Pole, Structure height: 9.1 m, Overall height: 9.4 m, Call Sign: WQJI767,
Assigned Frequencies: 17905.0 MHz, Grant Date: 09/23/2008, Expiration Date: 09/23/2018, Cancellation Date: 09/14/2016, Certifier: Don Houghton, Registrant: At&t Mobility LLC, 1120 20th Street, Nw - Suite 1000, Washington, DC 20036, Phone: (202) 457-2055, Fax: (202) 457-3073, Email:
- Pismo Beach, Lat: 35.148333 Lon: -120.648056, Call Sign: WQNJ446,
Assigned Frequencies: 1440.00 MHz, 1455.00 MHz, 1470.00 MHz, 1485.00 MHz, 1500.00 MHz, 1515.00 MHz, Grant Date: 03/02/2011, Expiration Date: 03/06/2011, Cancellation Date: 05/07/2011, Certifier: Argyle Nelson, Registrant: Aerial Video Systems, 712 South Main Street, Burbank, CA 91506, Phone: (818) 954-8842, Fax: (818) 954-9122, Email:
- AVILA BEACH, Avila Beach (Lat: 35.179472 Lon: -120.712917), Type: Pole, Structure height: 6.1 m, Call Sign: WQOM962,
Assigned Frequencies: 11545.0 MHz, 11585.0 MHz, 11545.0 MHz, 11585.0 MHz, 11545.0 MHz, 11585.0 MHz, 11545.0 MHz, 11585.0 MHz, 11545.0 MHz, 11585.0 MHz... (+11 more), Grant Date: 11/22/2011, Expiration Date: 11/22/2021, Cancellation Date: 09/15/2021, Certifier: Gregory M Romano, Registrant: Verizon, 1300 I St Nw - Suite 500 East, Washington, DC 20005, Phone: (202) 515-2453, Email:
- PISMO BEACH, 680 Wadsworth Street (Lat: 35.142972 Lon: -120.637778), Type: Pole, Structure height: 5.5 m, Call Sign: WQOM963,
Assigned Frequencies: 11055.0 MHz, 11095.0 MHz, 11055.0 MHz, 11095.0 MHz, 11055.0 MHz, 11095.0 MHz, 11055.0 MHz, 11095.0 MHz, 11055.0 MHz, 11095.0 MHz... (+11 more), Grant Date: 11/22/2011, Expiration Date: 11/22/2021, Cancellation Date: 09/15/2021, Certifier: Gregory M Romano, Registrant: Verizon, 1300 I St Nw - Suite 500 East, Washington, DC 20005, Phone: (202) 515-2453, Email:
- SLG22, 1261 Longview Avenue (Lat: 35.156639 Lon: -120.637194), Type: Gtower, Structure height: 61 m, Overall height: 62.5 m, Call Sign: WQOS517,
Assigned Frequencies: 11505.0 MHz, 11665.0 MHz, Grant Date: 12/14/2021, Expiration Date: 01/17/2032, Certifier: Michael P Goggin, Registrant: At&t Services, Inc., 208 S Akard St, 20f, Dallas, TX 75202, Phone: (855) 699-7073, Email:
- T17, Hillside (Lat: 35.162056 Lon: -120.654778), Type: Ltower, Structure height: 9 m, Overall height: 10 m, Call Sign: WRBN733,
Assigned Frequencies: 11565.0 MHz, 11565.0 MHz, 11565.0 MHz, 11565.0 MHz, 11565.0 MHz, 11565.0 MHz, 11075.0 MHz, 11075.0 MHz, 11075.0 MHz, 11075.0 MHz... (+18 more), Grant Date: 05/09/2018, Expiration Date: 05/09/2028, Certifier: Thomas J Kosta, Registrant: Micronet Communications, Inc., 812 Lexington Dr, Plano, TX 75075, Phone: (972) 422-7200, Email:
FCC Registered Amateur Radio Licenses:
66 (See the full list of FCC Registered Amateur Radio Licenses in Pismo Beach)FAA Registered Aircraft:
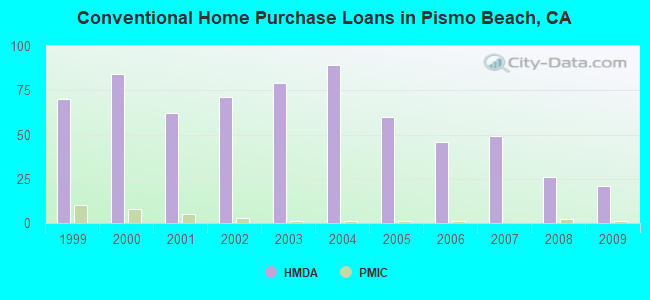
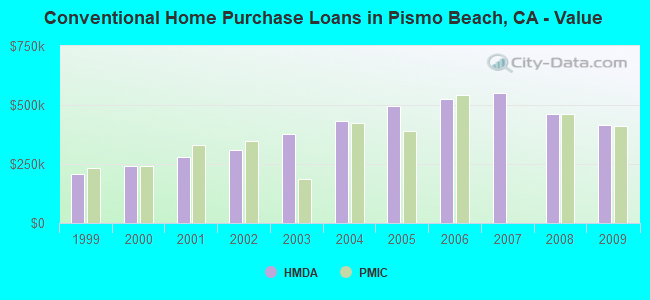
17 (See the full list of FAA Registered Aircraft in Pismo Beach)| Home Mortgage Disclosure Act Aggregated Statistics For Year 2009 (Based on 1 partial tract) | ||||||||||||
| A) FHA, FSA/RHS & VA Home Purchase Loans | B) Conventional Home Purchase Loans | C) Refinancings | D) Home Improvement Loans | F) Non-occupant Loans on < 5 Family Dwellings (A B C & D) | G) Loans On Manufactured Home Dwelling (A B C & D) | |||||||
|---|---|---|---|---|---|---|---|---|---|---|---|---|
| Number | Average Value | Number | Average Value | Number | Average Value | Number | Average Value | Number | Average Value | Number | Average Value | |
| LOANS ORIGINATED | 1 | $310,080 | 21 | $413,491 | 114 | $348,117 | 4 | $301,032 | 41 | $379,007 | 1 | $159,140 |
| APPLICATIONS APPROVED, NOT ACCEPTED | 0 | $0 | 3 | $395,000 | 10 | $372,679 | 0 | $0 | 4 | $412,020 | 1 | $63,860 |
| APPLICATIONS DENIED | 0 | $0 | 4 | $462,478 | 29 | $474,826 | 1 | $127,720 | 14 | $444,804 | 0 | $0 |
| APPLICATIONS WITHDRAWN | 1 | $282,080 | 4 | $464,782 | 31 | $396,030 | 0 | $0 | 8 | $330,274 | 0 | $0 |
| FILES CLOSED FOR INCOMPLETENESS | 0 | $0 | 1 | $469,560 | 4 | $435,412 | 0 | $0 | 1 | $690,510 | 0 | $0 |
Detailed HMDA statistics for the following Tracts: 0117.00
| Private Mortgage Insurance Companies Aggregated Statistics For Year 2009 (Based on 1 partial tract) | ||||
| A) Conventional Home Purchase Loans | B) Refinancings | |||
|---|---|---|---|---|
| Number | Average Value | Number | Average Value | |
| LOANS ORIGINATED | 1 | $411,850 | 0 | $0 |
| APPLICATIONS APPROVED, NOT ACCEPTED | 0 | $0 | 1 | $328,180 |
| APPLICATIONS DENIED | 0 | $0 | 0 | $0 |
| APPLICATIONS WITHDRAWN | 0 | $0 | 0 | $0 |
| FILES CLOSED FOR INCOMPLETENESS | 0 | $0 | 0 | $0 |
Detailed PMIC statistics for the following Tracts: 0117.00
2004 - 2018 National Fire Incident Reporting System (NFIRS) incidents
- Fire incident types reported to NFIRS in Pismo Beach, CA
- 4637.1%Outside Fires
- 4435.5%Structure Fires
- 1915.3%Mobile Property/Vehicle Fires
- 1512.1%Other
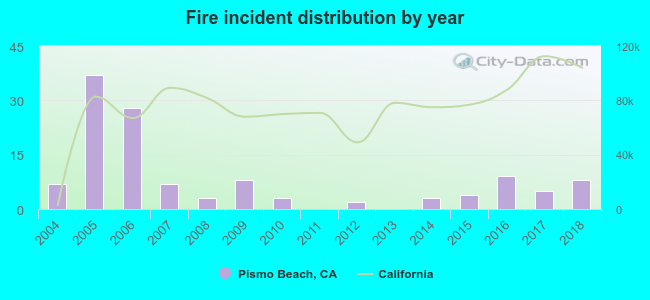 Based on the data from the years 2004 - 2018 the average number of fires per year is 8. The highest number of fire incidents - 37 took place in 2005, and the least - 0 in 2011. The data has a growing trend.
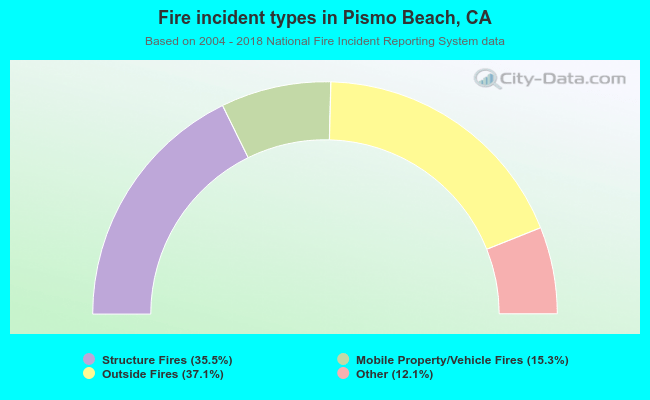 When looking into fire subcategories, the most reports belonged to: Outside Fires (37.1%), and Structure Fires (35.5%).
Fire-safe hotels and motels in Pismo Beach, California:
- Sandcastle Inn, 100 Stimson Ave, Pismo Beach, California 93449 , Phone: (805) 773-2422, Fax: (805) 773-0924
- Oxford Suites, 651 Five Cities Dr, Pismo Beach, California 93449 , Phone: (800) 982-7848
- Kon Tiki Inn, 1621 Price St, Pismo Beach, California 93449 , Phone: (805) 773-4833, Fax: (805) 773-6541
- Motel 6, #270, 860 4TH St, Pismo Beach, California 93449 , Phone: (805) 773-2665, Fax: (805) 773-0723
- Pismo Lighthouse Suites, 2411 Price St, Pismo Beach, California 93449 , Phone: (805) 245-2411, Fax: (805) 773-2411
- Best Western Shore Cliff Lodge, 2555 Price St, Pismo Beach, California 93449 , Phone: (805) 773-4671, Fax: (805) 773-2341
- Mission Inn Of Pismo Beach, 601 James Way, Pismo Beach, California 93449 , Phone: (805) 773-6020, Fax: (805) 773-6021
- Quality Inn Pismo Beach, 230 Five Cities Dr, Pismo Beach, California 93449 , Phone: (805) 773-1841, Fax: (805) 773-1944
- 6 other hotels and motels
| Most common first names in Pismo Beach, CA among deceased individuals | ||
| Name | Count | Lived (average) |
|---|---|---|
| John | 74 | 75.8 years |
| Mary | 68 | 83.4 years |
| William | 65 | 76.4 years |
| Robert | 62 | 72.1 years |
| James | 45 | 71.2 years |
| George | 41 | 77.4 years |
| Helen | 31 | 82.5 years |
| Frank | 30 | 79.5 years |
| Margaret | 30 | 81.4 years |
| Ruth | 29 | 80.0 years |
| Most common last names in Pismo Beach, CA among deceased individuals | ||
| Last name | Count | Lived (average) |
|---|---|---|
| Smith | 25 | 77.1 years |
| Johnson | 21 | 76.1 years |
| Jones | 17 | 78.0 years |
| Miller | 15 | 74.8 years |
| Wilson | 14 | 74.8 years |
| Brown | 14 | 81.5 years |
| Martin | 13 | 74.0 years |
| Anderson | 13 | 80.3 years |
| Clark | 12 | 75.6 years |
| Davis | 11 | 77.5 years |
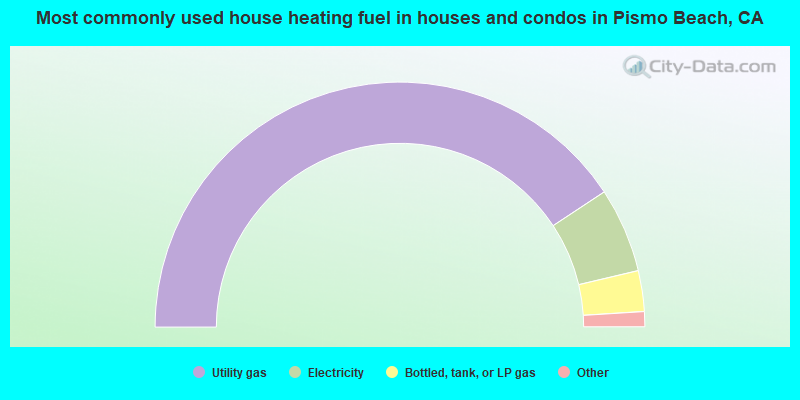
- 81.4%Utility gas
- 11.2%Electricity
- 5.4%Bottled, tank, or LP gas
- 1.7%No fuel used
- 0.3%Wood
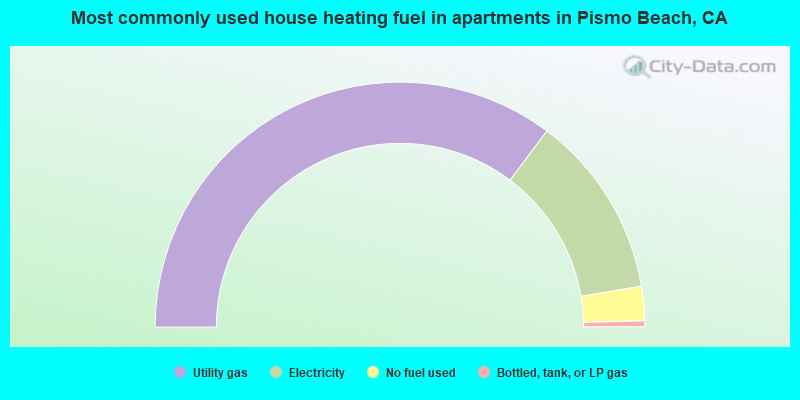
- 70.5%Utility gas
- 24.2%Electricity
- 4.5%No fuel used
- 0.8%Bottled, tank, or LP gas
Pismo Beach compared to California state average:
- Unemployed percentage significantly below state average.
- Black race population percentage significantly below state average.
- Hispanic race population percentage significantly below state average.
- Median age significantly above state average.
- Foreign-born population percentage significantly below state average.
- Length of stay since moving in above state average.
- Percentage of population with a bachelor's degree or higher above state average.
Pismo Beach on our top lists:
- #91 on the list of "Top 100 cities with highest ratio of median house value to median household income (pop. 5,000+)"
- #77 (93449) on the list of "Top 101 zip codes with the most hotels or motels in 2005"
- #4 on the list of "Top 101 counties with the lowest Sulfur Oxides Annual air pollution readings in 2012 (µg/m3)"
- #39 on the list of "Top 101 counties with highest percentage of residents voting for 3rd party candidates in the 2012 Presidential Election (pop. 50,000+)"
- #50 on the list of "Top 101 counties with the lowest number of births per 1000 residents 2007-2013"
- #60 on the list of "Top 101 counties with the lowest Particulate Matter (PM2.5) Annual air pollution readings in 2012 (µg/m3)"
- #74 on the list of "Top 101 counties with the largest increase in the number of births per 1000 residents 2000-2006 to 2007-2013 (pop 50,000+)"

|
|
Total of 45 patent applications in 2008-2024.