Estimated zip code population in 2022: 54,479
Zip code population in 2010: 50,320
Zip code population in 2000: 46,197
Houses and condos: 15,602
Renter-occupied apartments: 5,046
% of renters here:
33%State:
44%
March 2022 cost of living index in zip code 92557: 82.0
(low, U.S. average is 100)
Land area: 18.8
sq. mi.
Water area: 0.1
sq. mi.
Population density: 2,897 people per square mile (average).
OSM Map
General Map
Google Map
MSN Map
OSM Map
General Map
Google Map
MSN Map
OSM Map
General Map
Google Map
MSN Map
OSM Map
General Map
Google Map
MSN Map
Please wait while loading the map...
Real estate property taxes paid for housing units in 2022:
This zip code:
0.6% ($3,069)California:
0.7% ($4,831)
Median real estate property taxes paid for housing units with mortgages in 2022: $3,198 (0.7%)
Median real estate property taxes paid for housing units with no mortgage in 2022: $2,762 (0.6%)
Profiles of local businesses
Business Search - 14 Million verified businesses
Males: 27,331 Females: 27,148
For population 25 years and over in 92557:
High school or higher: 83.7%Bachelor's degree or higher: 19.7%Graduate or professional degree: 6.4%Unemployed: 5.8%Mean travel time to work (commute): 32.5 minutes
For population 15 years and over in 92557:
Never married: 41.4%Now married: 44.3%Separated: 2.6%Widowed: 3.4%Divorced: 8.3%
Zip code 92557 compared to state average:
Median house value below state average. Black race population percentage significantly above state average. Median age below state average. Length of stay since moving in above state average. House age below state average. Percentage of population with a bachelor's degree or higher below state average. 29,341 53.9% Hispanic or Latino 10,506 19.3% White 9,022 16.6% Black 2,953 5.4% Asian 1,837 3.4% Two or more races 435 0.8% Some other race 229 0.4% Native Hawaiian and Other 154 0.3% American Indian
Data:
Median household income ($)
Median household income (% change since 2000)
Household income diversity
Ratio of average income to average house value (%)
Ratio of average income to average rent
Median household income ($) - White
Median household income ($) - Black or African American
Median household income ($) - Asian
Median household income ($) - Hispanic or Latino
Median household income ($) - American Indian and Alaska Native
Median household income ($) - Multirace
Median household income ($) - Other Race
Median household income for houses/condos with a mortgage ($)
Median household income for apartments without a mortgage ($)
Races - White alone (%)
Races - White alone (% change since 2000)
Races - Black alone (%)
Races - Black alone (% change since 2000)
Races - American Indian alone (%)
Races - American Indian alone (% change since 2000)
Races - Asian alone (%)
Races - Asian alone (% change since 2000)
Races - Hispanic (%)
Races - Hispanic (% change since 2000)
Races - Native Hawaiian and Other Pacific Islander alone (%)
Races - Native Hawaiian and Other Pacific Islander alone (% change since 2000)
Races - Two or more races (%)
Races - Two or more races (% change since 2000)
Races - Other race alone (%)
Races - Other race alone (% change since 2000)
Racial diversity
Unemployment (%)
Unemployment (% change since 2000)
Unemployment (%) - White
Unemployment (%) - Black or African American
Unemployment (%) - Asian
Unemployment (%) - Hispanic or Latino
Unemployment (%) - American Indian and Alaska Native
Unemployment (%) - Multirace
Unemployment (%) - Other Race
Population density (people per square mile)
Population - Males (%)
Population - Females (%)
Population - Males (%) - White
Population - Males (%) - Black or African American
Population - Males (%) - Asian
Population - Males (%) - Hispanic or Latino
Population - Males (%) - American Indian and Alaska Native
Population - Males (%) - Multirace
Population - Males (%) - Other Race
Population - Females (%) - White
Population - Females (%) - Black or African American
Population - Females (%) - Asian
Population - Females (%) - Hispanic or Latino
Population - Females (%) - American Indian and Alaska Native
Population - Females (%) - Multirace
Population - Females (%) - Other Race
Coronavirus confirmed cases (May 09, 2024)
Deaths caused by coronavirus (May 09, 2024)
Coronavirus confirmed cases (per 100k population) (May 09, 2024)
Deaths caused by coronavirus (per 100k population) (May 09, 2024)
Daily increase in number of cases (May 09, 2024)
Weekly increase in number of cases (May 09, 2024)
Cases doubled (in days) (May 09, 2024)
Hospitalized patients (Apr 18, 2022)
Negative test results (Apr 18, 2022)
Total test results (Apr 18, 2022)
COVID Vaccine doses distributed (per 100k population) (Sep 19, 2023)
COVID Vaccine doses administered (per 100k population) (Sep 19, 2023)
COVID Vaccine doses distributed (Sep 19, 2023)
COVID Vaccine doses administered (Sep 19, 2023)
Likely homosexual households (%)
Likely homosexual households (% change since 2000)
Likely homosexual households - Lesbian couples (%)
Likely homosexual households - Lesbian couples (% change since 2000)
Likely homosexual households - Gay men (%)
Likely homosexual households - Gay men (% change since 2000)
Cost of living index
Median gross rent ($)
Median contract rent ($)
Median monthly housing costs ($)
Median house or condo value ($)
Median house or condo value ($ change since 2000)
Mean house or condo value by units in structure - 1, detached ($)
Mean house or condo value by units in structure - 1, attached ($)
Mean house or condo value by units in structure - 2 ($)
Mean house or condo value by units in structure by units in structure - 3 or 4 ($)
Mean house or condo value by units in structure - 5 or more ($)
Mean house or condo value by units in structure - Boat, RV, van, etc. ($)
Mean house or condo value by units in structure - Mobile home ($)
Median house or condo value ($) - White
Median house or condo value ($) - Black or African American
Median house or condo value ($) - Asian
Median house or condo value ($) - Hispanic or Latino
Median house or condo value ($) - American Indian and Alaska Native
Median house or condo value ($) - Multirace
Median house or condo value ($) - Other Race
Median resident age
Resident age diversity
Median resident age - Males
Median resident age - Females
Median resident age - White
Median resident age - Black or African American
Median resident age - Asian
Median resident age - Hispanic or Latino
Median resident age - American Indian and Alaska Native
Median resident age - Multirace
Median resident age - Other Race
Median resident age - Males - White
Median resident age - Males - Black or African American
Median resident age - Males - Asian
Median resident age - Males - Hispanic or Latino
Median resident age - Males - American Indian and Alaska Native
Median resident age - Males - Multirace
Median resident age - Males - Other Race
Median resident age - Females - White
Median resident age - Females - Black or African American
Median resident age - Females - Asian
Median resident age - Females - Hispanic or Latino
Median resident age - Females - American Indian and Alaska Native
Median resident age - Females - Multirace
Median resident age - Females - Other Race
Commute - mean travel time to work (minutes)
Travel time to work - Less than 5 minutes (%)
Travel time to work - Less than 5 minutes (% change since 2000)
Travel time to work - 5 to 9 minutes (%)
Travel time to work - 5 to 9 minutes (% change since 2000)
Travel time to work - 10 to 19 minutes (%)
Travel time to work - 10 to 19 minutes (% change since 2000)
Travel time to work - 20 to 29 minutes (%)
Travel time to work - 20 to 29 minutes (% change since 2000)
Travel time to work - 30 to 39 minutes (%)
Travel time to work - 30 to 39 minutes (% change since 2000)
Travel time to work - 40 to 59 minutes (%)
Travel time to work - 40 to 59 minutes (% change since 2000)
Travel time to work - 60 to 89 minutes (%)
Travel time to work - 60 to 89 minutes (% change since 2000)
Travel time to work - 90 or more minutes (%)
Travel time to work - 90 or more minutes (% change since 2000)
Marital status - Never married (%)
Marital status - Now married (%)
Marital status - Separated (%)
Marital status - Widowed (%)
Marital status - Divorced (%)
Median family income ($)
Median family income (% change since 2000)
Median non-family income ($)
Median non-family income (% change since 2000)
Median per capita income ($)
Median per capita income (% change since 2000)
Median family income ($) - White
Median family income ($) - Black or African American
Median family income ($) - Asian
Median family income ($) - Hispanic or Latino
Median family income ($) - American Indian and Alaska Native
Median family income ($) - Multirace
Median family income ($) - Other Race
Median year house/condo built
Median year apartment built
Year house built - Built 2005 or later (%)
Year house built - Built 2000 to 2004 (%)
Year house built - Built 1990 to 1999 (%)
Year house built - Built 1980 to 1989 (%)
Year house built - Built 1970 to 1979 (%)
Year house built - Built 1960 to 1969 (%)
Year house built - Built 1950 to 1959 (%)
Year house built - Built 1940 to 1949 (%)
Year house built - Built 1939 or earlier (%)
Average household size
Household density (households per square mile)
Average household size - White
Average household size - Black or African American
Average household size - Asian
Average household size - Hispanic or Latino
Average household size - American Indian and Alaska Native
Average household size - Multirace
Average household size - Other Race
Occupied housing units (%)
Vacant housing units (%)
Owner occupied housing units (%)
Renter occupied housing units (%)
Vacancy status - For rent (%)
Vacancy status - For sale only (%)
Vacancy status - Rented or sold, not occupied (%)
Vacancy status - For seasonal, recreational, or occasional use (%)
Vacancy status - For migrant workers (%)
Vacancy status - Other vacant (%)
Residents with income below the poverty level (%)
Residents with income below 50% of the poverty level (%)
Children below poverty level (%)
Poor families by family type - Married-couple family (%)
Poor families by family type - Male, no wife present (%)
Poor families by family type - Female, no husband present (%)
Poverty status for native-born residents (%)
Poverty status for foreign-born residents (%)
Poverty among high school graduates not in families (%)
Poverty among people who did not graduate high school not in families (%)
Residents with income below the poverty level (%) - White
Residents with income below the poverty level (%) - Black or African American
Residents with income below the poverty level (%) - Asian
Residents with income below the poverty level (%) - Hispanic or Latino
Residents with income below the poverty level (%) - American Indian and Alaska Native
Residents with income below the poverty level (%) - Multirace
Residents with income below the poverty level (%) - Other Race
Air pollution - Air Quality Index (AQI)
Air pollution - CO
Air pollution - NO2
Air pollution - SO2
Air pollution - Ozone
Air pollution - PM10
Air pollution - PM25
Air pollution - Pb
Crime - Murders per 100,000 population
Crime - Rapes per 100,000 population
Crime - Robberies per 100,000 population
Crime - Assaults per 100,000 population
Crime - Burglaries per 100,000 population
Crime - Thefts per 100,000 population
Crime - Auto thefts per 100,000 population
Crime - Arson per 100,000 population
Crime - City-data.com crime index
Crime - Violent crime index
Crime - Property crime index
Crime - Murders per 100,000 population (5 year average)
Crime - Rapes per 100,000 population (5 year average)
Crime - Robberies per 100,000 population (5 year average)
Crime - Assaults per 100,000 population (5 year average)
Crime - Burglaries per 100,000 population (5 year average)
Crime - Thefts per 100,000 population (5 year average)
Crime - Auto thefts per 100,000 population (5 year average)
Crime - Arson per 100,000 population (5 year average)
Crime - City-data.com crime index (5 year average)
Crime - Violent crime index (5 year average)
Crime - Property crime index (5 year average)
1996 Presidential Elections Results (%) - Democratic Party (Clinton)
1996 Presidential Elections Results (%) - Republican Party (Dole)
1996 Presidential Elections Results (%) - Other
2000 Presidential Elections Results (%) - Democratic Party (Gore)
2000 Presidential Elections Results (%) - Republican Party (Bush)
2000 Presidential Elections Results (%) - Other
2004 Presidential Elections Results (%) - Democratic Party (Kerry)
2004 Presidential Elections Results (%) - Republican Party (Bush)
2004 Presidential Elections Results (%) - Other
2008 Presidential Elections Results (%) - Democratic Party (Obama)
2008 Presidential Elections Results (%) - Republican Party (McCain)
2008 Presidential Elections Results (%) - Other
2012 Presidential Elections Results (%) - Democratic Party (Obama)
2012 Presidential Elections Results (%) - Republican Party (Romney)
2012 Presidential Elections Results (%) - Other
2016 Presidential Elections Results (%) - Democratic Party (Clinton)
2016 Presidential Elections Results (%) - Republican Party (Trump)
2016 Presidential Elections Results (%) - Other
2020 Presidential Elections Results (%) - Democratic Party (Biden)
2020 Presidential Elections Results (%) - Republican Party (Trump)
2020 Presidential Elections Results (%) - Other
Ancestries Reported - Arab (%)
Ancestries Reported - Czech (%)
Ancestries Reported - Danish (%)
Ancestries Reported - Dutch (%)
Ancestries Reported - English (%)
Ancestries Reported - French (%)
Ancestries Reported - French Canadian (%)
Ancestries Reported - German (%)
Ancestries Reported - Greek (%)
Ancestries Reported - Hungarian (%)
Ancestries Reported - Irish (%)
Ancestries Reported - Italian (%)
Ancestries Reported - Lithuanian (%)
Ancestries Reported - Norwegian (%)
Ancestries Reported - Polish (%)
Ancestries Reported - Portuguese (%)
Ancestries Reported - Russian (%)
Ancestries Reported - Scotch-Irish (%)
Ancestries Reported - Scottish (%)
Ancestries Reported - Slovak (%)
Ancestries Reported - Subsaharan African (%)
Ancestries Reported - Swedish (%)
Ancestries Reported - Swiss (%)
Ancestries Reported - Ukrainian (%)
Ancestries Reported - United States (%)
Ancestries Reported - Welsh (%)
Ancestries Reported - West Indian (%)
Ancestries Reported - Other (%)
Educational Attainment - No schooling completed (%)
Educational Attainment - Less than high school (%)
Educational Attainment - High school or equivalent (%)
Educational Attainment - Less than 1 year of college (%)
Educational Attainment - 1 or more years of college (%)
Educational Attainment - Associate degree (%)
Educational Attainment - Bachelor's degree (%)
Educational Attainment - Master's degree (%)
Educational Attainment - Professional school degree (%)
Educational Attainment - Doctorate degree (%)
School Enrollment - Nursery, preschool (%)
School Enrollment - Kindergarten (%)
School Enrollment - Grade 1 to 4 (%)
School Enrollment - Grade 5 to 8 (%)
School Enrollment - Grade 9 to 12 (%)
School Enrollment - College undergrad (%)
School Enrollment - Graduate or professional (%)
School Enrollment - Not enrolled in school (%)
School enrollment - Public schools (%)
School enrollment - Private schools (%)
School enrollment - Not enrolled (%)
Median number of rooms in houses and condos
Median number of rooms in apartments
Housing units lacking complete plumbing facilities (%)
Housing units lacking complete kitchen facilities (%)
Density of houses
Urban houses (%)
Rural houses (%)
Households with people 60 years and over (%)
Households with people 65 years and over (%)
Households with people 75 years and over (%)
Households with one or more nonrelatives (%)
Households with no nonrelatives (%)
Population in households (%)
Family households (%)
Nonfamily households (%)
Population in families (%)
Family households with own children (%)
Median number of bedrooms in owner occupied houses
Mean number of bedrooms in owner occupied houses
Median number of bedrooms in renter occupied houses
Mean number of bedrooms in renter occupied houses
Median number of vehichles in owner occupied houses
Mean number of vehichles in owner occupied houses
Median number of vehichles in renter occupied houses
Mean number of vehichles in renter occupied houses
Mortgage status - with mortgage (%)
Mortgage status - with second mortgage (%)
Mortgage status - with home equity loan (%)
Mortgage status - with both second mortgage and home equity loan (%)
Mortgage status - without a mortgage (%)
Average family size
Average family size - White
Average family size - Black or African American
Average family size - Asian
Average family size - Hispanic or Latino
Average family size - American Indian and Alaska Native
Average family size - Multirace
Average family size - Other Race
Geographical mobility - Same house 1 year ago (%)
Geographical mobility - Moved within same county (%)
Geographical mobility - Moved from different county within same state (%)
Geographical mobility - Moved from different state (%)
Geographical mobility - Moved from abroad (%)
Place of birth - Born in state of residence (%)
Place of birth - Born in other state (%)
Place of birth - Native, outside of US (%)
Place of birth - Foreign born (%)
Housing units in structures - 1, detached (%)
Housing units in structures - 1, attached (%)
Housing units in structures - 2 (%)
Housing units in structures - 3 or 4 (%)
Housing units in structures - 5 to 9 (%)
Housing units in structures - 10 to 19 (%)
Housing units in structures - 20 to 49 (%)
Housing units in structures - 50 or more (%)
Housing units in structures - Mobile home (%)
Housing units in structures - Boat, RV, van, etc. (%)
House/condo owner moved in on average (years ago)
Renter moved in on average (years ago)
Year householder moved into unit - Moved in 1999 to March 2000 (%)
Year householder moved into unit - Moved in 1995 to 1998 (%)
Year householder moved into unit - Moved in 1990 to 1994 (%)
Year householder moved into unit - Moved in 1980 to 1989 (%)
Year householder moved into unit - Moved in 1970 to 1979 (%)
Year householder moved into unit - Moved in 1969 or earlier (%)
Means of transportation to work - Drove car alone (%)
Means of transportation to work - Carpooled (%)
Means of transportation to work - Public transportation (%)
Means of transportation to work - Bus or trolley bus (%)
Means of transportation to work - Streetcar or trolley car (%)
Means of transportation to work - Subway or elevated (%)
Means of transportation to work - Railroad (%)
Means of transportation to work - Ferryboat (%)
Means of transportation to work - Taxicab (%)
Means of transportation to work - Motorcycle (%)
Means of transportation to work - Bicycle (%)
Means of transportation to work - Walked (%)
Means of transportation to work - Other means (%)
Working at home (%)
Industry diversity
Most Common Industries - Agriculture, forestry, fishing and hunting, and mining (%)
Most Common Industries - Agriculture, forestry, fishing and hunting (%)
Most Common Industries - Mining, quarrying, and oil and gas extraction (%)
Most Common Industries - Construction (%)
Most Common Industries - Manufacturing (%)
Most Common Industries - Wholesale trade (%)
Most Common Industries - Retail trade (%)
Most Common Industries - Transportation and warehousing, and utilities (%)
Most Common Industries - Transportation and warehousing (%)
Most Common Industries - Utilities (%)
Most Common Industries - Information (%)
Most Common Industries - Finance and insurance, and real estate and rental and leasing (%)
Most Common Industries - Finance and insurance (%)
Most Common Industries - Real estate and rental and leasing (%)
Most Common Industries - Professional, scientific, and management, and administrative and waste management services (%)
Most Common Industries - Professional, scientific, and technical services (%)
Most Common Industries - Management of companies and enterprises (%)
Most Common Industries - Administrative and support and waste management services (%)
Most Common Industries - Educational services, and health care and social assistance (%)
Most Common Industries - Educational services (%)
Most Common Industries - Health care and social assistance (%)
Most Common Industries - Arts, entertainment, and recreation, and accommodation and food services (%)
Most Common Industries - Arts, entertainment, and recreation (%)
Most Common Industries - Accommodation and food services (%)
Most Common Industries - Other services, except public administration (%)
Most Common Industries - Public administration (%)
Occupation diversity
Most Common Occupations - Management, business, science, and arts occupations (%)
Most Common Occupations - Management, business, and financial occupations (%)
Most Common Occupations - Management occupations (%)
Most Common Occupations - Business and financial operations occupations (%)
Most Common Occupations - Computer, engineering, and science occupations (%)
Most Common Occupations - Computer and mathematical occupations (%)
Most Common Occupations - Architecture and engineering occupations (%)
Most Common Occupations - Life, physical, and social science occupations (%)
Most Common Occupations - Education, legal, community service, arts, and media occupations (%)
Most Common Occupations - Community and social service occupations (%)
Most Common Occupations - Legal occupations (%)
Most Common Occupations - Education, training, and library occupations (%)
Most Common Occupations - Arts, design, entertainment, sports, and media occupations (%)
Most Common Occupations - Healthcare practitioners and technical occupations (%)
Most Common Occupations - Health diagnosing and treating practitioners and other technical occupations (%)
Most Common Occupations - Health technologists and technicians (%)
Most Common Occupations - Service occupations (%)
Most Common Occupations - Healthcare support occupations (%)
Most Common Occupations - Protective service occupations (%)
Most Common Occupations - Fire fighting and prevention, and other protective service workers including supervisors (%)
Most Common Occupations - Law enforcement workers including supervisors (%)
Most Common Occupations - Food preparation and serving related occupations (%)
Most Common Occupations - Building and grounds cleaning and maintenance occupations (%)
Most Common Occupations - Personal care and service occupations (%)
Most Common Occupations - Sales and office occupations (%)
Most Common Occupations - Sales and related occupations (%)
Most Common Occupations - Office and administrative support occupations (%)
Most Common Occupations - Natural resources, construction, and maintenance occupations (%)
Most Common Occupations - Farming, fishing, and forestry occupations (%)
Most Common Occupations - Construction and extraction occupations (%)
Most Common Occupations - Installation, maintenance, and repair occupations (%)
Most Common Occupations - Production, transportation, and material moving occupations (%)
Most Common Occupations - Production occupations (%)
Most Common Occupations - Transportation occupations (%)
Most Common Occupations - Material moving occupations (%)
People in Group quarters - Institutionalized population (%)
People in Group quarters - Correctional institutions (%)
People in Group quarters - Federal prisons and detention centers (%)
People in Group quarters - Halfway houses (%)
People in Group quarters - Local jails and other confinement facilities (including police lockups) (%)
People in Group quarters - Military disciplinary barracks (%)
People in Group quarters - State prisons (%)
People in Group quarters - Other types of correctional institutions (%)
People in Group quarters - Nursing homes (%)
People in Group quarters - Hospitals/wards, hospices, and schools for the handicapped (%)
People in Group quarters - Hospitals/wards and hospices for chronically ill (%)
People in Group quarters - Hospices or homes for chronically ill (%)
People in Group quarters - Military hospitals or wards for chronically ill (%)
People in Group quarters - Other hospitals or wards for chronically ill (%)
People in Group quarters - Hospitals or wards for drug/alcohol abuse (%)
People in Group quarters - Mental (Psychiatric) hospitals or wards (%)
People in Group quarters - Schools, hospitals, or wards for the mentally retarded (%)
People in Group quarters - Schools, hospitals, or wards for the physically handicapped (%)
People in Group quarters - Institutions for the deaf (%)
People in Group quarters - Institutions for the blind (%)
People in Group quarters - Orthopedic wards and institutions for the physically handicapped (%)
People in Group quarters - Wards in general hospitals for patients who have no usual home elsewhere (%)
People in Group quarters - Wards in military hospitals for patients who have no usual home elsewhere (%)
People in Group quarters - Juvenile institutions (%)
People in Group quarters - Long-term care (%)
People in Group quarters - Homes for abused, dependent, and neglected children (%)
People in Group quarters - Residential treatment centers for emotionally disturbed children (%)
People in Group quarters - Training schools for juvenile delinquents (%)
People in Group quarters - Short-term care, detention or diagnostic centers for delinquent children (%)
People in Group quarters - Type of juvenile institution unknown (%)
People in Group quarters - Noninstitutionalized population (%)
People in Group quarters - College dormitories (includes college quarters off campus) (%)
People in Group quarters - Military quarters (%)
People in Group quarters - On base (%)
People in Group quarters - Barracks, unaccompanied personnel housing (UPH), (Enlisted/Officer), ;and similar group living quarters for military personnel (%)
People in Group quarters - Transient quarters for temporary residents (%)
People in Group quarters - Military ships (%)
People in Group quarters - Group homes (%)
People in Group quarters - Homes or halfway houses for drug/alcohol abuse (%)
People in Group quarters - Homes for the mentally ill (%)
People in Group quarters - Homes for the mentally retarded (%)
People in Group quarters - Homes for the physically handicapped (%)
People in Group quarters - Other group homes (%)
People in Group quarters - Religious group quarters (%)
People in Group quarters - Dormitories (%)
People in Group quarters - Agriculture workers' dormitories on farms (%)
People in Group quarters - Job Corps and vocational training facilities (%)
People in Group quarters - Other workers' dormitories (%)
People in Group quarters - Crews of maritime vessels (%)
People in Group quarters - Other nonhousehold living situations (%)
People in Group quarters - Other noninstitutional group quarters (%)
Residents speaking English at home (%)
Residents speaking English at home - Born in the United States (%)
Residents speaking English at home - Native, born elsewhere (%)
Residents speaking English at home - Foreign born (%)
Residents speaking Spanish at home (%)
Residents speaking Spanish at home - Born in the United States (%)
Residents speaking Spanish at home - Native, born elsewhere (%)
Residents speaking Spanish at home - Foreign born (%)
Residents speaking other language at home (%)
Residents speaking other language at home - Born in the United States (%)
Residents speaking other language at home - Native, born elsewhere (%)
Residents speaking other language at home - Foreign born (%)
Class of Workers - Employee of private company (%)
Class of Workers - Self-employed in own incorporated business (%)
Class of Workers - Private not-for-profit wage and salary workers (%)
Class of Workers - Local government workers (%)
Class of Workers - State government workers (%)
Class of Workers - Federal government workers (%)
Class of Workers - Self-employed workers in own not incorporated business and Unpaid family workers (%)
House heating fuel used in houses and condos - Utility gas (%)
House heating fuel used in houses and condos - Bottled, tank, or LP gas (%)
House heating fuel used in houses and condos - Electricity (%)
House heating fuel used in houses and condos - Fuel oil, kerosene, etc. (%)
House heating fuel used in houses and condos - Coal or coke (%)
House heating fuel used in houses and condos - Wood (%)
House heating fuel used in houses and condos - Solar energy (%)
House heating fuel used in houses and condos - Other fuel (%)
House heating fuel used in houses and condos - No fuel used (%)
House heating fuel used in apartments - Utility gas (%)
House heating fuel used in apartments - Bottled, tank, or LP gas (%)
House heating fuel used in apartments - Electricity (%)
House heating fuel used in apartments - Fuel oil, kerosene, etc. (%)
House heating fuel used in apartments - Coal or coke (%)
House heating fuel used in apartments - Wood (%)
House heating fuel used in apartments - Solar energy (%)
House heating fuel used in apartments - Other fuel (%)
House heating fuel used in apartments - No fuel used (%)
Armed forces status - In Armed Forces (%)
Armed forces status - Civilian (%)
Armed forces status - Civilian - Veteran (%)
Armed forces status - Civilian - Nonveteran (%)
Fatal accidents locations in years 2005-2021
Fatal accidents locations in 2005
Fatal accidents locations in 2006
Fatal accidents locations in 2007
Fatal accidents locations in 2008
Fatal accidents locations in 2009
Fatal accidents locations in 2010
Fatal accidents locations in 2011
Fatal accidents locations in 2012
Fatal accidents locations in 2013
Fatal accidents locations in 2014
Fatal accidents locations in 2015
Fatal accidents locations in 2016
Fatal accidents locations in 2017
Fatal accidents locations in 2018
Fatal accidents locations in 2019
Fatal accidents locations in 2020
Fatal accidents locations in 2021
Alcohol use - People drinking some alcohol every month (%)
Alcohol use - People not drinking at all (%)
Alcohol use - Average days/month drinking alcohol
Alcohol use - Average drinks/week
Alcohol use - Average days/year people drink much
Audiometry - Average condition of hearing (%)
Audiometry - People that can hear a whisper from across a quiet room (%)
Audiometry - People that can hear normal voice from across a quiet room (%)
Audiometry - Ears ringing, roaring, buzzing (%)
Audiometry - Had a job exposure to loud noise (%)
Audiometry - Had off-work exposure to loud noise (%)
Blood Pressure & Cholesterol - Has high blood pressure (%)
Blood Pressure & Cholesterol - Checking blood pressure at home (%)
Blood Pressure & Cholesterol - Frequently checking blood cholesterol (%)
Blood Pressure & Cholesterol - Has high cholesterol level (%)
Consumer Behavior - Money monthly spent on food at supermarket/grocery store
Consumer Behavior - Money monthly spent on food at other stores
Consumer Behavior - Money monthly spent on eating out
Consumer Behavior - Money monthly spent on carryout/delivered foods
Consumer Behavior - Income spent on food at supermarket/grocery store (%)
Consumer Behavior - Income spent on food at other stores (%)
Consumer Behavior - Income spent on eating out (%)
Consumer Behavior - Income spent on carryout/delivered foods (%)
Current Health Status - General health condition (%)
Current Health Status - Blood donors (%)
Current Health Status - Has blood ever tested for HIV virus (%)
Current Health Status - Left-handed people (%)
Dermatology - People using sunscreen (%)
Diabetes - Diabetics (%)
Diabetes - Had a blood test for high blood sugar (%)
Diabetes - People taking insulin (%)
Diet Behavior & Nutrition - Diet health (%)
Diet Behavior & Nutrition - Milk product consumption (# of products/month)
Diet Behavior & Nutrition - Meals not home prepared (#/week)
Diet Behavior & Nutrition - Meals from fast food or pizza place (#/week)
Diet Behavior & Nutrition - Ready-to-eat foods (#/month)
Diet Behavior & Nutrition - Frozen meals/pizza (#/month)
Drug Use - People that ever used marijuana or hashish (%)
Drug Use - Ever used hard drugs (%)
Drug Use - Ever used any form of cocaine (%)
Drug Use - Ever used heroin (%)
Drug Use - Ever used methamphetamine (%)
Health Insurance - People covered by health insurance (%)
Kidney Conditions-Urology - Avg. # of times urinating at night
Medical Conditions - People with asthma (%)
Medical Conditions - People with anemia (%)
Medical Conditions - People with psoriasis (%)
Medical Conditions - People with overweight (%)
Medical Conditions - Elderly people having difficulties in thinking or remembering (%)
Medical Conditions - People who ever received blood transfusion (%)
Medical Conditions - People having trouble seeing even with glass/contacts (%)
Medical Conditions - People with arthritis (%)
Medical Conditions - People with gout (%)
Medical Conditions - People with congestive heart failure (%)
Medical Conditions - People with coronary heart disease (%)
Medical Conditions - People with angina pectoris (%)
Medical Conditions - People who ever had heart attack (%)
Medical Conditions - People who ever had stroke (%)
Medical Conditions - People with emphysema (%)
Medical Conditions - People with thyroid problem (%)
Medical Conditions - People with chronic bronchitis (%)
Medical Conditions - People with any liver condition (%)
Medical Conditions - People who ever had cancer or malignancy (%)
Mental Health - People who have little interest in doing things (%)
Mental Health - People feeling down, depressed, or hopeless (%)
Mental Health - People who have trouble sleeping or sleeping too much (%)
Mental Health - People feeling tired or having little energy (%)
Mental Health - People with poor appetite or overeating (%)
Mental Health - People feeling bad about themself (%)
Mental Health - People who have trouble concentrating on things (%)
Mental Health - People moving or speaking slowly or too fast (%)
Mental Health - People having thoughts they would be better off dead (%)
Oral Health - Average years since last visit a dentist
Oral Health - People embarrassed because of mouth (%)
Oral Health - People with gum disease (%)
Oral Health - General health of teeth and gums (%)
Oral Health - Average days a week using dental floss/device
Oral Health - Average days a week using mouthwash for dental problem
Oral Health - Average number of teeth
Pesticide Use - Households using pesticides to control insects (%)
Pesticide Use - Households using pesticides to kill weeds (%)
Physical Activity - People doing vigorous-intensity work activities (%)
Physical Activity - People doing moderate-intensity work activities (%)
Physical Activity - People walking or bicycling (%)
Physical Activity - People doing vigorous-intensity recreational activities (%)
Physical Activity - People doing moderate-intensity recreational activities (%)
Physical Activity - Average hours a day doing sedentary activities
Physical Activity - Average hours a day watching TV or videos
Physical Activity - Average hours a day using computer
Physical Functioning - People having limitations keeping them from working (%)
Physical Functioning - People limited in amount of work they can do (%)
Physical Functioning - People that need special equipment to walk (%)
Physical Functioning - People experiencing confusion/memory problems (%)
Physical Functioning - People requiring special healthcare equipment (%)
Prescription Medications - Average number of prescription medicines taking
Preventive Aspirin Use - Adults 40+ taking low-dose aspirin (%)
Reproductive Health - Vaginal deliveries (%)
Reproductive Health - Cesarean deliveries (%)
Reproductive Health - Deliveries resulted in a live birth (%)
Reproductive Health - Pregnancies resulted in a delivery (%)
Reproductive Health - Women breastfeeding newborns (%)
Reproductive Health - Women that had a hysterectomy (%)
Reproductive Health - Women that had both ovaries removed (%)
Reproductive Health - Women that have ever taken birth control pills (%)
Reproductive Health - Women taking birth control pills (%)
Reproductive Health - Women that have ever used Depo-Provera or injectables (%)
Reproductive Health - Women that have ever used female hormones (%)
Sexual Behavior - People 18+ that ever had sex (vaginal, anal, or oral) (%)
Sexual Behavior - Males 18+ that ever had vaginal sex with a woman (%)
Sexual Behavior - Males 18+ that ever performed oral sex on a woman (%)
Sexual Behavior - Males 18+ that ever had anal sex with a woman (%)
Sexual Behavior - Males 18+ that ever had any sex with a man (%)
Sexual Behavior - Females 18+ that ever had vaginal sex with a man (%)
Sexual Behavior - Females 18+ that ever performed oral sex on a man (%)
Sexual Behavior - Females 18+ that ever had anal sex with a man (%)
Sexual Behavior - Females 18+ that ever had any kind of sex with a woman (%)
Sexual Behavior - Average age people first had sex
Sexual Behavior - Average number of female sex partners in lifetime (males 18+)
Sexual Behavior - Average number of female vaginal sex partners in lifetime (males 18+)
Sexual Behavior - Average age people first performed oral sex on a woman (18+)
Sexual Behavior - Average number of woman performed oral sex on in lifetime (18+)
Sexual Behavior - Average number of male sex partners in lifetime (males 18+)
Sexual Behavior - Average number of male anal sex partners in lifetime (males 18+)
Sexual Behavior - Average age people first performed oral sex on a man (18+)
Sexual Behavior - Average number of male oral sex partners in lifetime (18+)
Sexual Behavior - People using protection when performing oral sex (%)
Sexual Behavior - Average number of times people have vaginal or anal sex a year
Sexual Behavior - People having sex without condom (%)
Sexual Behavior - Average number of male sex partners in lifetime (females 18+)
Sexual Behavior - Average number of male vaginal sex partners in lifetime (females 18+)
Sexual Behavior - Average number of female sex partners in lifetime (females 18+)
Sexual Behavior - Circumcised males 18+ (%)
Sleep Disorders - Average hours sleeping at night
Sleep Disorders - People that has trouble sleeping (%)
Smoking-Cigarette Use - People smoking cigarettes (%)
Taste & Smell - People 40+ having problems with smell (%)
Taste & Smell - People 40+ having problems with taste (%)
Taste & Smell - People 40+ that ever had wisdom teeth removed (%)
Taste & Smell - People 40+ that ever had tonsils teeth removed (%)
Taste & Smell - People 40+ that ever had a loss of consciousness because of a head injury (%)
Taste & Smell - People 40+ that ever had a broken nose or other serious injury to face or skull (%)
Taste & Smell - People 40+ that ever had two or more sinus infections (%)
Weight - Average height (inches)
Weight - Average weight (pounds)
Weight - Average BMI
Weight - People that are obese (%)
Weight - People that ever were obese (%)
Weight - People trying to lose weight (%)
Urban population: 53,831
Rural population: 647
Estimated median house/condo value in 2022: $472,996
92557:
$472,996California:
$715,900
According to our research of California and other state lists, there were 58 registered sex offenders living in 92557 zip code as of May 09, 2024 . The ratio of all residents to sex offenders in zip code 92557 is 902 to 1.The ratio of registered sex offenders to all residents in this zip code is near the state average.
Median resident age: This zip code:
33.4 yearsCalifornia median age:
37.9 years
Average household size: This zip code:
3.6 peopleCalifornia:
2.8 people
Averages for the 2020 tax year for zip code 92557, filed in 2021:
Average Adjusted Gross Income (AGI) in 2020: $50,950 (Individual Income Tax Returns) Here:
$50,950State:
$95,910
Salary/wage: $47,238 (reported on 84.8% of returns )Here:
$47,238State:
$77,331
(% of AGI for various income ranges: 1190.1% for AGIs below $25k , 3841.9% for AGIs $25k-50k , 7330.1% for AGIs $50k-75k , 10897.0% for AGIs $75k-100k , 19271.7% for AGIs $100k-200k , 68743.8% for AGIs over 200k ) Taxable interest for individuals: $380 (reported on 27.2% of returns )This zip code:
$380California:
$2,294
(% of AGI for various income ranges: 4.3% for AGIs below $25k , 7.7% for AGIs $25k-50k , 12.9% for AGIs $50k-75k , 25.5% for AGIs $75k-100k , 53.6% for AGIs $100k-200k , 425.0% for AGIs over 200k ) Ordinary dividends: $1,713 (reported on 6.1% of returns )(% of AGI for various income ranges: 2.9% for AGIs below $25k , 3.5% for AGIs $25k-50k , 12.7% for AGIs $50k-75k , 26.4% for AGIs $75k-100k , 54.8% for AGIs $100k-200k , 841.2% for AGIs over 200k ) Net capital gain/loss in AGI: +$7,517 (reported on 7.1% of returns )Here:
+$7,517State:
+$49,306
(% of AGI for various income ranges: 0.9% for AGIs below $25k , 7.0% for AGIs $25k-50k , 19.3% for AGIs $50k-75k , 54.0% for AGIs $75k-100k , 213.2% for AGIs $100k-200k , 10680.0% for AGIs over 200k ) Profit/loss from business: +$6,948 (reported on 16.6% of returns )Here:
+$6,948State:
+$15,671
(% of AGI for various income ranges: 110.2% for AGIs below $25k , 128.4% for AGIs $25k-50k , 173.1% for AGIs $50k-75k , 201.9% for AGIs $75k-100k , 328.0% for AGIs $100k-200k , 2586.2% for AGIs over 200k ) Taxable individual retirement arrangement distribution: $15,767 (reported on 3.2% of returns )92557:
$15,767California:
$23,505
(% of AGI for various income ranges: 14.2% for AGIs below $25k , 27.3% for AGIs $25k-50k , 63.4% for AGIs $50k-75k , 145.5% for AGIs $75k-100k , 349.4% for AGIs $100k-200k , 1246.2% for AGIs over 200k ) Total itemized deductions: $27,885 (reported on 12.0% of returns )Here:
$27,885State:
$39,517
(% of AGI for various income ranges: 40.8% for AGIs below $25k , 191.3% for AGIs $25k-50k , 641.8% for AGIs $50k-75k , 1141.9% for AGIs $75k-100k , 1861.6% for AGIs $100k-200k , 8945.0% for AGIs over 200k ) Charity contributions: $6,330 (reported on 9.9% of returns )(% of AGI for various income ranges: 3.0% for AGIs below $25k , 29.6% for AGIs $25k-50k , 93.0% for AGIs $50k-75k , 182.3% for AGIs $75k-100k , 405.9% for AGIs $100k-200k , 2956.2% for AGIs over 200k ) Taxes paid: $7,767 (reported on 11.9% of returns )(% of AGI for various income ranges: 9.2% for AGIs below $25k , 43.8% for AGIs $25k-50k , 182.5% for AGIs $50k-75k , 334.3% for AGIs $75k-100k , 563.8% for AGIs $100k-200k , 1917.5% for AGIs over 200k ) Earned income credit: $2,255 (reported on 20.7% of returns )(% of AGI for various income ranges: 108.4% for AGIs below $25k , 84.3% for AGIs $25k-50k , 1.9% for AGIs $50k-75k ) Percentage of individuals using paid preparers for their 2020 taxes: 93.4%(% for various income ranges: 92.6% for AGIs below $25k , 93.8% for AGIs $25k-50k , 93.9% for AGIs $50k-75k , 93.3% for AGIs $75k-100k , 93.8% for AGIs $100k-200k , 93.8% for AGIs over 200k )
Averages for the 2012 tax year for zip code 92557, filed in 2013:
Average Adjusted Gross Income (AGI) in 2012: $43,702 (Individual Income Tax Returns) Here:
$43,702State:
$72,726
Salary/wage: $40,968 (reported on 86.0% of returns )Here:
$40,968State:
$59,079
(% of AGI for various income ranges: 75.7% for AGIs below $25k , 84.1% for AGIs $25k-50k , 84.7% for AGIs $50k-75k , 81.1% for AGIs $75k-100k , 80.2% for AGIs $100k-200k , 59.6% for AGIs over 200k ) Taxable interest for individuals: $403 (reported on 27.7% of returns )This zip code:
$403California:
$2,146
(% of AGI for various income ranges: 0.3% for AGIs below $25k , 0.2% for AGIs $25k-50k , 0.2% for AGIs $50k-75k , 0.2% for AGIs $75k-100k , 0.2% for AGIs $100k-200k , 0.8% for AGIs over 200k ) Ordinary dividends: $2,861 (reported on 7.3% of returns )(% of AGI for various income ranges: 0.7% for AGIs below $25k , 0.5% for AGIs $25k-50k , 0.3% for AGIs $50k-75k , 0.5% for AGIs $75k-100k , 0.3% for AGIs $100k-200k , 1.0% for AGIs over 200k ) Net capital gain/loss in AGI: +$2,048 (reported on 5.5% of returns )Here:
+$2,048State:
+$30,460
(% of AGI for various income ranges: 0.4% for AGIs $75k-100k , 0.4% for AGIs $100k-200k , 2.9% for AGIs over 200k ) Profit/loss from business: +$8,241 (reported on 16.6% of returns )Here:
+$8,241State:
+$17,064
(% of AGI for various income ranges: 12.1% for AGIs below $25k , 3.4% for AGIs $25k-50k , 1.0% for AGIs $50k-75k , 1.5% for AGIs $75k-100k , 1.1% for AGIs $100k-200k , 3.1% for AGIs over 200k ) Taxable individual retirement arrangement distribution: $13,960 (reported on 4.2% of returns )92557:
$13,960California:
$19,557
(% of AGI for various income ranges: 1.0% for AGIs below $25k , 1.1% for AGIs $25k-50k , 1.2% for AGIs $50k-75k , 1.4% for AGIs $75k-100k , 2.1% for AGIs $100k-200k ) Self-employment retirement plans: $14,750 (reported on 0.1% of returns )92557:
$14,750California:
$24,530
Total itemized deductions: $21,846 (29% of AGI, reported on 34.9% of returns )Here:
$21,846State:
$34,004
Here:
28.9% of AGIState:
22.7% of AGI
(% of AGI for various income ranges: 7.7% for AGIs below $25k , 14.9% for AGIs $25k-50k , 19.9% for AGIs $50k-75k , 19.7% for AGIs $75k-100k , 20.5% for AGIs $100k-200k , 20.6% for AGIs over 200k ) Charity contributions: $3,157 (reported on 28.8% of returns )(% of AGI for various income ranges: 0.5% for AGIs below $25k , 1.5% for AGIs $25k-50k , 2.2% for AGIs $50k-75k , 2.5% for AGIs $75k-100k , 2.8% for AGIs $100k-200k , 3.4% for AGIs over 200k ) Taxes paid: $5,966 (reported on 34.7% of returns )92557:
$5,966State:
$14,448
(% of AGI for various income ranges: 1.4% for AGIs below $25k , 3.0% for AGIs $25k-50k , 4.9% for AGIs $50k-75k , 5.4% for AGIs $75k-100k , 6.8% for AGIs $100k-200k , 8.0% for AGIs over 200k ) Earned income credit: $2,578 (reported on 27.3% of returns )(% of AGI for various income ranges: 9.9% for AGIs below $25k , 1.7% for AGIs $25k-50k ) Percentage of individuals using paid preparers for their 2012 taxes: 63.6%(% for various income ranges: 59.8% for AGIs below $25k , 65.3% for AGIs $25k-50k , 66.2% for AGIs $50k-75k , 67.8% for AGIs $75k-100k , 68.4% for AGIs $100k-200k , 71.4% for AGIs over 200k )
Averages for the 2004 tax year for zip code 92557, filed in 2005:
Average Adjusted Gross Income (AGI) in 2004: $42,919 (Individual Income Tax Returns) Here:
$42,919State:
$58,600
Salary/wage: $41,502 (reported on 89.6% of returns )Here:
$41,502State:
$49,455
(% of AGI for various income ranges: 138.6% for AGIs below $10k , 81.6% for AGIs $10k-25k , 88.5% for AGIs $25k-50k , 87.6% for AGIs $50k-75k , 89.5% for AGIs $75k-100k , 81.3% for AGIs over 100k ) Taxable interest for individuals: $569 (reported on 38.7% of returns )This zip code:
$569California:
$2,365
(% of AGI for various income ranges: 2.3% for AGIs below $10k , 0.7% for AGIs $10k-25k , 0.4% for AGIs $25k-50k , 0.4% for AGIs $50k-75k , 0.3% for AGIs $75k-100k , 0.6% for AGIs over 100k ) Taxable dividends: $973 (reported on 10.5% of returns )(% of AGI for various income ranges: 0.8% for AGIs below $10k , 0.3% for AGIs $10k-25k , 0.2% for AGIs $25k-50k , 0.2% for AGIs $50k-75k , 0.3% for AGIs $75k-100k , 0.3% for AGIs over 100k ) Net capital gain/loss: +$9,241 (reported on 8.4% of returns )Here:
+$9,241State:
+$23,418
(% of AGI for various income ranges: -0.8% for AGIs below $10k , 0.1% for AGIs $10k-25k , 0.1% for AGIs $25k-50k , 0.3% for AGIs $50k-75k , 1.0% for AGIs $75k-100k , 6.2% for AGIs over 100k ) Profit/loss from business: +$8,609 (reported on 15.8% of returns )Here:
+$8,609State:
+$16,826
(% of AGI for various income ranges: 8.0% for AGIs below $10k , 8.1% for AGIs $10k-25k , 3.3% for AGIs $25k-50k , 2.0% for AGIs $50k-75k , 1.4% for AGIs $75k-100k , 3.3% for AGIs over 100k ) IRA payment deduction: $2,937 (reported on 1.7% of returns )92557:
$2,937California:
$3,192
(% of AGI for various income ranges: 0.1% for AGIs $10k-25k , 0.1% for AGIs $25k-50k , 0.1% for AGIs $50k-75k , 0.1% for AGIs $75k-100k , 0.1% for AGIs over 100k ) Self-employed pension: $11,710 (reported on 0.3% of returns )Here:
$11,710California:
$17,688
(% of AGI for various income ranges: 0.0% for AGIs $10k-25k , 0.0% for AGIs $50k-75k , 0.0% for AGIs $75k-100k , 0.3% for AGIs over 100k ) Total itemized deductions: $21,530 (32% of AGI, reported on 47.6% of returns )Here:
$21,530State:
$28,113
Here:
31.9% of AGIState:
25.3% of AGI
(% of AGI for various income ranges: 16.4% for AGIs below $10k , 14.0% for AGIs $10k-25k , 24.7% for AGIs $25k-50k , 27.7% for AGIs $50k-75k , 26.1% for AGIs $75k-100k , 22.0% for AGIs over 100k ) Charity contributions deductions: $2,930 (4% of AGI, reported on 42.3% of returns )Here:
4.2% of AGIState:
3.3% of AGI
(% of AGI for various income ranges: 1.0% for AGIs below $10k , 1.2% for AGIs $10k-25k , 2.5% for AGIs $25k-50k , 3.3% for AGIs $50k-75k , 3.3% for AGIs $75k-100k , 3.3% for AGIs over 100k ) Total tax: $4,833 (reported on 71.0% of returns )92557:
$4,833State:
$10,761
(% of AGI for various income ranges: 4.4% for AGIs below $10k , 3.9% for AGIs $10k-25k , 4.9% for AGIs $25k-50k , 6.5% for AGIs $50k-75k , 8.3% for AGIs $75k-100k , 13.7% for AGIs over 100k ) Earned income credit: $1,907 (reported on 18.7% of returns )Percentage of individuals using paid preparers for their 2004 taxes: 68.4%(% for various income ranges: 56.7% for AGIs below $10k , 68.9% for AGIs $10k-25k , 71.3% for AGIs $25k-50k , 71.4% for AGIs $50k-75k , 71.5% for AGIs $75k-100k , 72.0% for AGIs over 100k )
Estimated median household income in 2022: This zip code:
$89,284California:
$91,551
Nearest zip codes: 92553 ,
92324 ,
92507 ,
92354 ,
92313 ,
92518 .
Riverside Zip Code Map
Percentage of family households: This zip code:
55.2%California:
46.8%
Percentage of households with unmarried partners: This zip code:
5.9%California:
48.1%
Likely homosexual households (counted as self-reported same-sex unmarried-partner households)
Lesbian couples: 0.1% of all households Gay men: 0.1% of all households
Household received Food Stamps/SNAP in the past 12 months: 2,046Household did not receive Food Stamps/SNAP in the past 12 months: 13,104
Women who had a birth in the past 12 months: 607 (432 now married , 174 unmarried) Women who did not have a birth in the past 12 months: 12,798 (4,549 now married , 8,270 unmarried)
Housing units in zip code 92557 with a mortgage: 7,786 (482
second mortgage , 50
home equity loan , 279
both second mortgage and home equity loan )
Houses without a mortgage: 17
Median monthly owner costs for units with a mortgage: $2,060
Median monthly owner costs for units without a mortgage: $628
Residents with income below the poverty level in 2022:
This zip code:
12.0%Whole state:
12.2%
Residents with income below 50% of the poverty level in 2022:
This zip code:
6.3%Whole state:
6.2%
Median number of rooms in houses and condos: Median number of rooms in apartments: Notable locations in this zip code not listed on our city pages
Click to draw/clear zip code borders Notable locations in zip code 92557: (A) , Box Springs Lookout (B) , American Medical Response Unit 348 (C) , Riverside County Fire Department Station 48 Sunnymead Ranch (D) , Riverside County Fire Department Station 2 Sunnymead (E) . Display/hide their locations on the map
Shopping Centers: (1) , The Festival at Moreno Valley Shopping Center (2) , North Ridge Shopping Center (3) , Lakeshore Village Shopping Center (4) , Moreno Valley Shopping Center (5) . Display/hide their locations on the map
Churches in zip code 92557 include: (A) , Sunnymead Baptist Temple (B) . Display/hide their locations on the map
Reservoir: (A) . Display/hide its location on the map
Parks in zip code 92557 include: (1) , Box Springs Mountain Regional Park (2) , Hidden Springs Community Park (3) , Westbluff Park (4) . Display/hide their locations on the map
Year house built (houses)
77 2020 or later388 2010 to 20191,687 2000 to 20091,933 1990 to 19998,829 1980 to 19891,551 1970 to 1979478 1960 to 1969262 1950 to 1959115 1940 to 1949137 1939 or earlier
Zip code 92557 household income distribution in 2022 539 Less than $10,000206 $10,000 to $14,999360 $15,000 to $19,999315 $20,000 to $24,999319 $25,000 to $29,999425 $30,000 to $34,999540 $35,000 to $39,999604 $40,000 to $44,999334 $45,000 to $49,9991,051 $50,000 to $59,9991,677 $60,000 to $74,9992,007 $75,000 to $99,9992,331 $100,000 to $124,9991,280 $125,000 to $149,9991,731 $150,000 to $199,9991,386 $200,000 or moreEstimate of home value of owner-occupied houses/condos in 2022 in zip code 92557 76 Less than $10,0007 $10,000 to $14,9996 $25,000 to $29,9998 $30,000 to $34,9995 $35,000 to $39,99967 $40,000 to $49,99925 $50,000 to $59,99953 $60,000 to $69,99954 $70,000 to $79,99922 $80,000 to $89,99935 $90,000 to $99,99958 $100,000 to $124,99917 $125,000 to $149,99975 $150,000 to $174,9995 $175,000 to $199,99990 $200,000 to $249,999194 $250,000 to $299,9992,205 $300,000 to $399,9993,569 $400,000 to $499,9992,191 $500,000 to $749,999167 $750,000 to $999,99941 $1,000,000 to $1,499,9997 $1,500,000 to $1,999,999Rent paid by renters in 2022 in zip code 92557 87 $200 to $24949 $250 to $29926 $400 to $44934 $500 to $54918 $550 to $59915 $600 to $64910 $700 to $74956 $750 to $79960 $800 to $89994 $900 to $999342 $1,000 to $1,249817 $1,250 to $1,4992,352 $1,500 to $1,999731 $2,000 to $2,499189 $2,500 to $2,99948 $3,000 to $3,49964 $3,500 or more70 No cash rent
Median gross rent in 2022: $1,892.
Median price asked for vacant for-sale houses and condos in 2022: $475,005.
Estimated median house (or condo) value in 2022 for: White Non-Hispanic householders: $478,216Black or African American householders: $503,623American Indian or Alaska Native householders: $526,594Asian householders: $534,251Native Hawaiian and other Pacific Islander householders: $391,552Some other race householders: $421,136Two or more races householders: $430,881Hispanic or Latino householders: $436,450Estimated median house or condo value in 2022: $472,996
92557:
$472,996California:
$715,900
Lower value quartile - upper value quartile: $399,239 - $541,386
Mean price in 2022: Detached houses: $441,439Here:
$441,439State:
$988,808
Townhouses or other attached units: $855,952Here:
$855,952State:
$838,546
In 3-to-4-unit structures: $210,637Here:
$210,637State:
$824,253
In 5-or-more-unit structures: $370,781Here:
$370,781State:
$730,996
Mobile homes: $62,534Here:
$62,534State:
$184,506
Housing units in structures:
One, detached: 12,835One, attached: 104Two: 373 or 4: 4475 to 9: 93710 to 19: 27820 to 49: 14250 or more: 491Mobile homes: 269Boats, RVs, vans, etc.: 10Unemployment : 5.8%
Means of transportation to work in zip code 92557 76.8% 19,378 Drove a car alone10.6% 2,683 Carpooled0.6% 162 Bus or trolley bus0.0% 5 Subway or elevated0.0% 12 Taxi0.5% 117 Motorcycle0.1% 17 Bicycle0.7% 171 Walked1.6% 403 Other means7.2% 1,814 Worked at homeTravel time to work (commute) in zip code 92557 282 Less than 5 minutes852 5 to 9 minutes2,312 10 to 14 minutes3,214 15 to 19 minutes2,839 20 to 24 minutes1,238 25 to 29 minutes4,591 30 to 34 minutes862 35 to 39 minutes1,085 40 to 44 minutes2,088 45 to 59 minutes1,952 60 to 89 minutes1,476 90 or more minutes
Neighborhoods in zip code 92557: Percentage of zip code residents living and working in this county: 67.8%
Household type by relationship:
Households: 54,479
Male householders: 7,463 (1,115 living alone ), Female householders: 7,668 (983 living alone )7,550 spouses (7,500 opposite-sex spouses ), 1,084 unmarried partners , (1,067 opposite-sex unmarried partners ), 17,939 children (17,092 natural , 134 adopted , 708 stepchildren ), 3,608 grandchildren , 1,556 brothers or sisters , 1,916 parents , 117 foster children , 2,596 other relatives , 2,431 non-relatives In group quarters: 198 (-1 institutionalized population )
Size of family households: 3,260 2-persons , 2,543 3-persons , 2,506 4-persons , 1,579 5-persons , 803 6-persons , 1,415 7-or-more-persons
Size of nonfamily households: 2,094 1-person , 529 2-persons , 163 3-persons , 32 4-persons , 65 5-persons , 24 6-persons , 10 7-or-more-persons
6,239 married couples with children. single-parent households (614 men , 2,456 women ).
55.6% of residents of 92557 zip code speak English at home. of residents speak Spanish at home (68% very well, 17% well, 8% not well, 7% not at all ).of residents speak other Indo-European language at home (57% very well, 33% well, 7% not well, 3% not at all ).of residents speak Asian or Pacific Island language at home (59% very well, 29% well, 10% not well, 2% not at all ).of residents speak other language at home (75% very well, 15% well, 10% not well ).
Foreign born population: 11,816 (21.7%)
(54.4%
of them are naturalized citizens )
This zip code:
21.7%Whole state:
26.7%
60% Honduras 8% Liberia 5% Malaysia 4% Costa Rica 3% El Salvador 1% Guyana 1% Israel 3% Nigerian 2% English 2% American 1% German 1% Italian 1% Irish 1% European
Year of entry for the foreign-born population
2,333 2010 or later 1,993 2000 to 2009 2,671 1990 to 1999 5,530 Before 1990
There are
119 Medical Specialists in Zip Code 92557 .
Facilities with environmental interests located in this zip code:
HIDDEN SPRINGS ELEMENTARY (9801 HIDDEN SPRINGS DR. in MORENO VALLEY, CA)
(National Center for Education Statistics) - STATE ID-6108732 Organizations: MORENO VALLEY UNIFIED (SCHOOL DISTRICT)
HONEY HOLLOW ELEMENTARY (11765 HONEY HOLLOW ST. in MORENO VALLEY, CA)
(National Center for Education Statistics) - STATE ID-6105514 Organizations: MORENO VALLEY UNIFIED (SCHOOL DISTRICT)
MIDLAND ELEMENTARY (11440 DAVIS ST. in MORENO VALLEY, CA)
(National Center for Education Statistics) - STATE ID-6032312 Organizations: MORENO VALLEY UNIFIED (SCHOOL DISTRICT)
NORTH RIDGE ELEMENTARY (25101 KALMIA AVE. in MORENO VALLEY, CA)
(National Center for Education Statistics) - STATE ID-6109110 Organizations: MORENO VALLEY UNIFIED (SCHOOL DISTRICT)
CANYON SPRINGS HIGH (23100 COUGAR CANYON DR. in MORENO VALLEY, CA)
(National Center for Education Statistics) - STATE ID-3330396 Organizations: MORENO VALLEY UNIFIED (SCHOOL DISTRICT)
HOME DEPOT USA INC HD 0616 (12255 PIGEON PASS RD in MORENO VALLEY, CA)
Small Quantity Generators, between 100 kg and 1000 kg of hazardous waste/month (Resource Conservation and Recovery Act (tracking hazardous waste))
LAKE SHORE VILLAGE CLEANERS (23579 118 SUNNY MEAD RANCH PWY in MORENO VALLEY, CA)
Small Quantity Generators, between 100 kg and 1000 kg of hazardous waste/month (Resource Conservation and Recovery Act (tracking hazardous waste)) - notification Organizations: THOMAS LEE (CONTACT/OWNER)
EASTERN MUNICIPAL WATER DISTRI (24999 COTTONWOOD in MORENO VALLEY, CA)
CRITERIA AND HAZARDOUS AIR POLLUTANT INVENTORY (Inventory of air pollution sources) Business SIC classification: WATER SUPPLY
Housing units lacking complete plumbing facilities: 0.4%
Housing units lacking complete kitchen facilities: 1.7%
75.8% Utility gas 18.3% Electricity 2.9% Bottled, tank, or LP gas 1.2% No fuel used 0.7% Wood 0.6% Solar energy
Population in 1990: 37,853. Population change in the 1990s: +8,344 (+22.0%).
Place of birth for U.S.-born residents:
This state: 36,062Northeast: 971Midwest: 1,560South: 2,126West: 1,161
49% of the 92557 zip code residents lived in the same house 5 years ago.
Out of people who lived in different houses, 62% lived in this county.
Out of people who lived in different counties, 50% lived in California.
93% of the 92557 zip code residents lived in the same house 1 year ago.
Out of people who lived in different houses, 68% moved from this county.
Out of people who lived in different houses, 30% moved from different county within same state.
Out of people who lived in different houses, 3% moved from different state.
Out of people who lived in different houses, 1% moved from abroad.
Private vs. public school enrollment:
Students in private schools in grades 1 to 8 (elementary and middle school): 440
Here:
6.9%California:
10.5%
Students in private schools in grades 9 to 12 (high school): 269
Students in private undergraduate colleges: 523
Here:
14.8%California:
15.9%
Occupation by median earnings in the past 12 months ($)
88,010 Law enforcement workers including supervisors 83,595 Fire fighting and prevention, and other protective service workers including supervisors 80,504 Arts, design, entertainment, sports, and media occupations 72,209 Architecture and engineering occupations 66,111 Computer and mathematical occupations 64,402 Business and financial operations occupations
Companies with federal contracts located in this zip code:
PACIFICA HOSTS INC (24840 ELDER AVE in MORENO VALLEY, CA)
$30,302 with Army for Lodging - Hotel/Motel. Signed on 2003-11-21. Completion date: 2003-11-29.
LOTSA OAK, INC (12125 DAY ST BLDG U #205A in MORENO VALLEY, CA; small business)
$7,803 with Army for Office Furniture. Signed on 2004-07-22. Completion date: 2004-08-12.
DEFENSE ELECTRIC (25231 PICO VISTA WAY in MORENO VALLEY, CA; small business)
$3,770 with Air Force for Installation of Equipment -- Electrical and Electronic Equipment Components. Signed on 2005-06-20. Completion date: 2005-08-31.
Top industries in this zip code by the number of employees in 2005:
Accommodation and Food Services: Limited-Service Restaurants (50-99 employees: 1 establishment, 20-49 employees: 7 establishments, 10-19 employees: 5 establishments, 5-9 employees: 2 establishments, 1-4 employees: 4 establishments)Accommodation and Food Services: Full-Service Restaurants (50-99: 1, 20-49: 3, 5-9: 1, 1-4: 6)Health Care and Social Assistance: Residential Mental Retardation Facilities (50-99: 2, 5-9: 1, 1-4: 3)Health Care and Social Assistance: Child Day Care Services (20-49: 1, 10-19: 3, 1-4: 4)Health Care and Social Assistance: Offices of Dentists (20-49: 1, 10-19: 1, 5-9: 3, 1-4: 5)Other Services (except Public Administration): Religious Organizations (10-19: 3, 5-9: 3, 1-4: 4)Health Care and Social Assistance: Offices of Physicians (except Mental Health Specialists) (10-19: 3, 5-9: 2, 1-4: 3)
People in group quarters in 2010:
82 people in group homes intended for adults
20 people in workers' group living quarters and job corps centers
6 people in group homes for juveniles (non-correctional)
6 people in residential treatment centers for juveniles (non-correctional)
4 people in correctional residential facilities
3 people in nursing facilities/skilled-nursing facilities
People in group quarters in 2000:
154 people in other group homes
61 people in homes for the mentally retarded
57 people in other noninstitutional group quarters
14 people in homes or halfway houses for drug/alcohol abuse
Fatal accident statistics in 2014:
Fatal accident count: 1Vehicles involved in fatal accidents: 2Fatal accidents caused by drunken drivers: 0Fatalities: 1Persons involved in fatal accidents: 3Pedestrians involved in fatal accidents: 1
Fatal accident statistics in 2013:
Fatal accident count: 1Vehicles involved in fatal accidents: 1Fatal accidents caused by drunken drivers: 0Fatalities: 1Persons involved in fatal accidents: 2Pedestrians involved in fatal accidents: 0
Home Mortgage Disclosure Act Aggregated Statistics For Year 2009(Based on 12 full and 8 partial tracts) A) FHA, FSA/RHS & VA B) Conventional C) Refinancings D) Home Improvement Loans E) Loans on Dwellings For 5+ Families F) Non-occupant Loans on G) Loans On Manufactured Number Average Value Number Average Value Number Average Value Number Average Value Number Average Value Number Average Value Number Average Value
LOANS ORIGINATED 631 $158,824 315 $126,554 496 $173,803 28 $83,384 0 $0 159 $107,126 1 $365,740 APPLICATIONS APPROVED, NOT ACCEPTED 63 $159,157 47 $131,151 88 $195,469 8 $36,180 0 $0 22 $114,273 0 $0 APPLICATIONS DENIED 104 $166,556 81 $122,706 337 $202,189 23 $99,210 0 $0 63 $123,165 5 $45,166 APPLICATIONS WITHDRAWN 66 $178,592 52 $117,442 171 $203,531 11 $63,755 1 $15,688,430 35 $113,591 0 $0 FILES CLOSED FOR INCOMPLETENESS 19 $154,642 16 $122,614 50 $223,107 3 $110,387 0 $0 10 $119,856 1 $140,330
Aggregated Statistics For Year 2008(Based on 12 full and 8 partial tracts) A) FHA, FSA/RHS & VA B) Conventional C) Refinancings D) Home Improvement Loans F) Non-occupant Loans on G) Loans On Manufactured Number Average Value Number Average Value Number Average Value Number Average Value Number Average Value Number Average Value
LOANS ORIGINATED 494 $203,115 410 $167,246 428 $215,460 84 $90,846 139 $151,678 6 $88,228 APPLICATIONS APPROVED, NOT ACCEPTED 47 $215,301 113 $187,537 181 $245,460 23 $46,260 30 $188,815 4 $131,335 APPLICATIONS DENIED 95 $221,642 190 $186,007 719 $270,459 139 $81,927 89 $178,701 5 $132,358 APPLICATIONS WITHDRAWN 71 $219,592 89 $196,983 205 $253,615 15 $123,691 31 $151,883 2 $212,270 FILES CLOSED FOR INCOMPLETENESS 14 $237,664 27 $195,615 69 $271,237 9 $76,800 13 $172,605 0 $0
Aggregated Statistics For Year 2007(Based on 12 full and 8 partial tracts) A) FHA, FSA/RHS & VA B) Conventional C) Refinancings D) Home Improvement Loans E) Loans on Dwellings For 5+ Families F) Non-occupant Loans on G) Loans On Manufactured Number Average Value Number Average Value Number Average Value Number Average Value Number Average Value Number Average Value Number Average Value
LOANS ORIGINATED 17 $298,591 604 $244,831 1,935 $254,869 293 $160,445 3 $14,640,950 210 $223,106 6 $203,622 APPLICATIONS APPROVED, NOT ACCEPTED 2 $249,000 196 $242,179 579 $274,703 74 $161,447 0 $0 48 $282,128 11 $86,187 APPLICATIONS DENIED 4 $231,312 486 $276,906 1,812 $298,872 354 $157,112 0 $0 132 $301,472 10 $208,643 APPLICATIONS WITHDRAWN 10 $291,231 202 $251,365 698 $293,555 102 $219,456 1 $26,133,960 65 $268,091 2 $284,340 FILES CLOSED FOR INCOMPLETENESS 0 $0 57 $256,066 284 $308,421 19 $172,665 0 $0 14 $220,736 0 $0
Aggregated Statistics For Year 2006(Based on 12 full and 8 partial tracts) A) FHA, FSA/RHS & VA B) Conventional C) Refinancings D) Home Improvement Loans E) Loans on Dwellings For 5+ Families F) Non-occupant Loans on G) Loans On Manufactured Number Average Value Number Average Value Number Average Value Number Average Value Number Average Value Number Average Value Number Average Value
LOANS ORIGINATED 2 $390,070 1,943 $222,808 3,511 $264,480 654 $159,920 0 $0 385 $229,658 7 $95,286 APPLICATIONS APPROVED, NOT ACCEPTED 0 $0 406 $242,779 794 $270,304 112 $162,953 0 $0 112 $252,101 7 $139,276 APPLICATIONS DENIED 1 $370,000 946 $239,197 2,082 $295,804 497 $150,325 0 $0 175 $254,782 10 $194,475 APPLICATIONS WITHDRAWN 2 $404,440 478 $234,677 1,360 $287,320 185 $214,191 2 $165,355 118 $231,901 2 $78,040 FILES CLOSED FOR INCOMPLETENESS 0 $0 80 $246,110 349 $288,342 28 $235,188 0 $0 22 $258,910 0 $0
Aggregated Statistics For Year 2005(Based on 12 full and 8 partial tracts) A) FHA, FSA/RHS & VA B) Conventional C) Refinancings D) Home Improvement Loans E) Loans on Dwellings For 5+ Families F) Non-occupant Loans on G) Loans On Manufactured Number Average Value Number Average Value Number Average Value Number Average Value Number Average Value Number Average Value Number Average Value
LOANS ORIGINATED 7 $258,131 2,527 $212,048 4,580 $238,262 646 $152,482 4 $9,450,452 489 $210,492 12 $117,317 APPLICATIONS APPROVED, NOT ACCEPTED 2 $287,770 502 $209,487 722 $234,963 108 $135,676 0 $0 98 $228,031 16 $99,864 APPLICATIONS DENIED 2 $299,000 892 $211,155 1,742 $249,347 402 $124,765 1 $446,900 145 $229,627 18 $72,598 APPLICATIONS WITHDRAWN 6 $229,307 538 $212,744 1,792 $247,305 226 $161,002 0 $0 132 $232,326 7 $246,917 FILES CLOSED FOR INCOMPLETENESS 0 $0 130 $199,444 500 $246,058 41 $114,476 0 $0 23 $205,823 2 $210,765
Aggregated Statistics For Year 2004(Based on 12 full and 8 partial tracts) A) FHA, FSA/RHS & VA B) Conventional C) Refinancings D) Home Improvement Loans E) Loans on Dwellings For 5+ Families F) Non-occupant Loans on G) Loans On Manufactured Number Average Value Number Average Value Number Average Value Number Average Value Number Average Value Number Average Value Number Average Value
LOANS ORIGINATED 52 $217,942 2,430 $184,331 4,799 $192,381 571 $135,408 2 $4,554,385 455 $178,582 8 $118,398 APPLICATIONS APPROVED, NOT ACCEPTED 5 $183,356 464 $189,034 1,007 $193,325 109 $89,753 0 $0 84 $165,674 12 $151,662 APPLICATIONS DENIED 11 $172,855 662 $187,302 1,776 $197,340 423 $97,789 0 $0 143 $177,526 17 $76,060 APPLICATIONS WITHDRAWN 14 $198,470 334 $182,030 1,508 $190,338 229 $136,340 0 $0 85 $187,025 0 $0 FILES CLOSED FOR INCOMPLETENESS 4 $184,252 88 $184,440 510 $195,583 36 $134,704 0 $0 24 $153,144 0 $0
Aggregated Statistics For Year 2003(Based on 12 full and 8 partial tracts) A) FHA, FSA/RHS & VA B) Conventional C) Refinancings D) Home Improvement Loans E) Loans on Dwellings For 5+ Families F) Non-occupant Loans on Number Average Value Number Average Value Number Average Value Number Average Value Number Average Value Number Average Value
LOANS ORIGINATED 259 $168,569 1,719 $150,540 5,809 $148,720 174 $57,037 0 $0 460 $128,991 APPLICATIONS APPROVED, NOT ACCEPTED 17 $172,840 323 $156,384 976 $154,588 66 $58,639 0 $0 101 $152,009 APPLICATIONS DENIED 46 $164,258 433 $149,850 1,916 $150,557 190 $48,548 0 $0 110 $154,337 APPLICATIONS WITHDRAWN 29 $158,252 223 $144,193 1,575 $153,815 69 $63,277 0 $0 62 $127,486 FILES CLOSED FOR INCOMPLETENESS 9 $165,802 52 $139,635 375 $149,065 13 $48,961 1 $3,010,000 30 $130,101
Aggregated Statistics For Year 1999(Based on 2 partial tracts) A) FHA, FSA/RHS & VA B) Conventional C) Refinancings D) Home Improvement Loans E) Loans on Dwellings For 5+ Families F) Non-occupant Loans on Number Average Value Number Average Value Number Average Value Number Average Value Number Average Value Number Average Value
LOANS ORIGINATED 266 $114,073 214 $107,369 456 $108,085 74 $25,980 5 $105,878 60 $88,427 APPLICATIONS APPROVED, NOT ACCEPTED 16 $116,628 28 $101,379 101 $106,804 57 $26,524 1 $140,740 9 $93,467 APPLICATIONS DENIED 29 $121,020 71 $112,065 287 $90,826 106 $22,086 1 $271,330 16 $96,676 APPLICATIONS WITHDRAWN 33 $108,912 40 $118,284 181 $99,932 13 $29,871 2 $129,805 13 $115,766 FILES CLOSED FOR INCOMPLETENESS 5 $118,818 9 $90,483 63 $116,282 1 $28,850 1 $122,410 6 $98,988
Private Mortgage Insurance Companies Aggregated Statistics For Year 2009(Based on 10 full and 8 partial tracts) A) Conventional B) Refinancings C) Non-occupant Loans on Number Average Value Number Average Value Number Average Value
LOANS ORIGINATED 50 $157,429 5 $185,708 1 $106,000 APPLICATIONS APPROVED, NOT ACCEPTED 34 $193,598 7 $266,070 0 $0 APPLICATIONS DENIED 12 $197,717 1 $211,000 0 $0 APPLICATIONS WITHDRAWN 7 $170,351 1 $171,090 0 $0 FILES CLOSED FOR INCOMPLETENESS 4 $160,858 0 $0 0 $0
Aggregated Statistics For Year 2008(Based on 12 full and 8 partial tracts) A) Conventional B) Refinancings C) Non-occupant Loans on Number Average Value Number Average Value Number Average Value
LOANS ORIGINATED 184 $208,187 43 $302,281 11 $241,686 APPLICATIONS APPROVED, NOT ACCEPTED 97 $304,379 78 $337,029 4 $307,750 APPLICATIONS DENIED 24 $223,523 3 $250,333 7 $207,421 APPLICATIONS WITHDRAWN 18 $225,361 5 $311,190 1 $102,330 FILES CLOSED FOR INCOMPLETENESS 6 $226,000 1 $187,080 2 $235,000
Aggregated Statistics For Year 2007(Based on 12 full and 8 partial tracts) A) Conventional B) Refinancings C) Non-occupant Loans on Number Average Value Number Average Value Number Average Value
LOANS ORIGINATED 107 $324,992 112 $356,150 9 $225,293 APPLICATIONS APPROVED, NOT ACCEPTED 24 $345,501 46 $369,204 4 $358,750 APPLICATIONS DENIED 6 $332,852 18 $423,153 7 $453,049 APPLICATIONS WITHDRAWN 17 $299,676 21 $389,969 3 $219,460 FILES CLOSED FOR INCOMPLETENESS 0 $0 0 $0 0 $0
Aggregated Statistics For Year 2006(Based on 12 full and 8 partial tracts) A) Conventional B) Refinancings C) Non-occupant Loans on Number Average Value Number Average Value Number Average Value
LOANS ORIGINATED 33 $365,006 54 $342,506 2 $197,815 APPLICATIONS APPROVED, NOT ACCEPTED 21 $367,813 24 $335,792 1 $468,360 APPLICATIONS DENIED 0 $0 0 $0 0 $0 APPLICATIONS WITHDRAWN 2 $421,345 7 $379,973 0 $0 FILES CLOSED FOR INCOMPLETENESS 0 $0 1 $289,000 0 $0
Aggregated Statistics For Year 2005(Based on 10 full and 8 partial tracts) A) Conventional B) Refinancings C) Non-occupant Loans on Number Average Value Number Average Value Number Average Value
LOANS ORIGINATED 43 $329,956 66 $316,173 3 $304,417 APPLICATIONS APPROVED, NOT ACCEPTED 10 $294,911 22 $283,244 0 $0 APPLICATIONS DENIED 2 $382,545 3 $326,820 0 $0 APPLICATIONS WITHDRAWN 2 $408,575 9 $289,890 0 $0 FILES CLOSED FOR INCOMPLETENESS 2 $232,170 2 $318,000 0 $0
Aggregated Statistics For Year 2004(Based on 12 full and 8 partial tracts) A) Conventional B) Refinancings C) Non-occupant Loans on D) Loans On Manufactured Number Average Value Number Average Value Number Average Value Number Average Value
LOANS ORIGINATED 146 $245,054 117 $220,630 27 $200,133 0 $0 APPLICATIONS APPROVED, NOT ACCEPTED 41 $232,357 67 $185,334 9 $163,572 0 $0 APPLICATIONS DENIED 3 $222,747 4 $228,395 2 $208,120 1 $253,840 APPLICATIONS WITHDRAWN 7 $252,816 4 $198,932 2 $211,685 0 $0 FILES CLOSED FOR INCOMPLETENESS 1 $362,650 9 $183,748 3 $150,737 0 $0
Aggregated Statistics For Year 2003(Based on 12 full and 8 partial tracts) A) Conventional B) Refinancings C) Non-occupant Loans on Number Average Value Number Average Value Number Average Value
LOANS ORIGINATED 305 $187,729 326 $172,097 32 $152,307 APPLICATIONS APPROVED, NOT ACCEPTED 67 $181,693 93 $174,653 9 $162,506 APPLICATIONS DENIED 8 $197,794 6 $217,208 0 $0 APPLICATIONS WITHDRAWN 14 $202,239 18 $180,037 1 $165,000 FILES CLOSED FOR INCOMPLETENESS 0 $0 0 $0 0 $0
Aggregated Statistics For Year 1999(Based on 2 partial tracts) A) Conventional B) Refinancings C) Non-occupant Loans on Number Average Value Number Average Value Number Average Value
LOANS ORIGINATED 63 $136,802 87 $135,364 8 $109,899 APPLICATIONS APPROVED, NOT ACCEPTED 7 $156,089 14 $131,906 1 $134,090 APPLICATIONS DENIED 6 $141,287 5 $127,614 0 $0 APPLICATIONS WITHDRAWN 2 $160,800 3 $129,760 0 $0 FILES CLOSED FOR INCOMPLETENESS 1 $86,940 0 $0 0 $0
2006 - 2018 National Fire Incident Reporting System (NFIRS) incidents See full 2006 National Fire Incident Reporting System statistics for zip code 92557, California
Most common first names in zip code 92557 among deceased individuals Name Count Lived (average)
Mary 56 77.8 years James 56 67.5 years Robert 54 72.2 years William 51 71.6 years Charles 38 74.1 years John 37 75.1 years George 35 72.1 years Richard 26 66.2 years Margaret 25 79.1 years Maria 23 78.4 years
Most common last names in zip code 92557 among deceased individuals Last name Count Lived (average)
Johnson 23 69.5 years Williams 20 74.3 years Jones 19 75.3 years Smith 17 76.8 years Miller 14 74.4 years Martin 13 79.8 years Anderson 13 78.3 years Clark 12 74.8 years Rodriguez 11 70.1 years Garcia 11 71.1 years
Businesses in zip code 92557
Name Count Name Count
Albertsons 1 KFC 1 Arby's 1 Kroger 2 Best Western 1 Little Caesars Pizza 1 Burger King 1 Papa John's Pizza 1 CVS 1 Pizza Hut 1 Carl\s Jr. 1 Rite Aid 1 Curves 1 Starbucks 1 DHL 1 Subway 2 Discount Tire 1 T-Mobile 1 Express 1 Taco Bell 1 FedEx 1 U-Haul 1 H&R Block 1 UPS 1 Home Depot 1 Victoria's Secret 1 IHOP 1 Walgreens 1

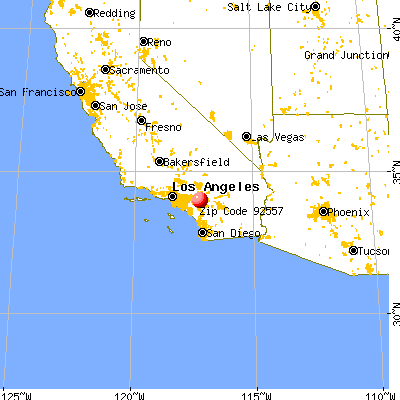


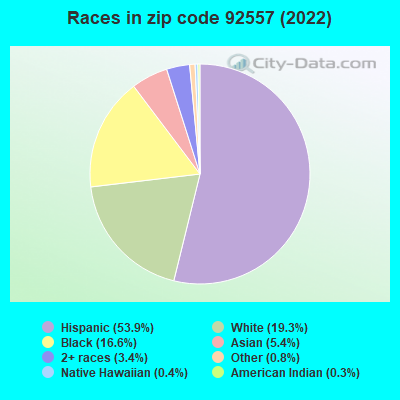


 Nearest zip codes: 92553, 92324, 92507, 92354, 92313, 92518.
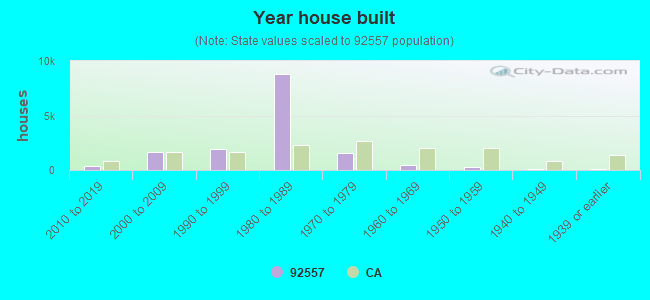

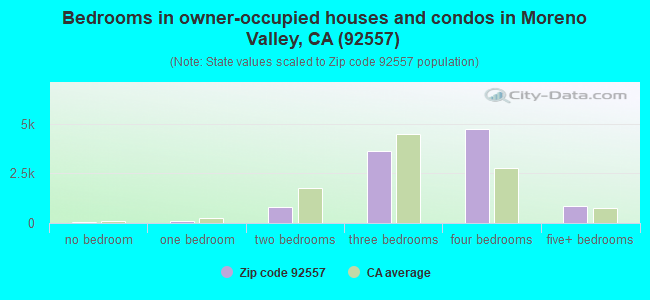
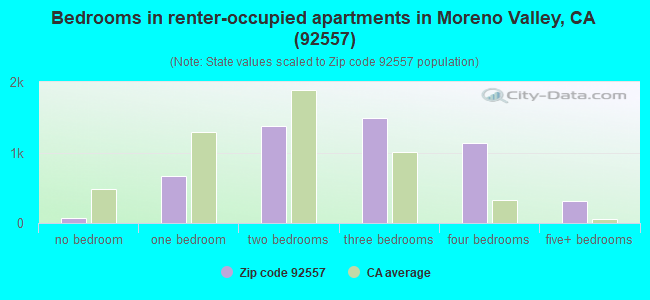
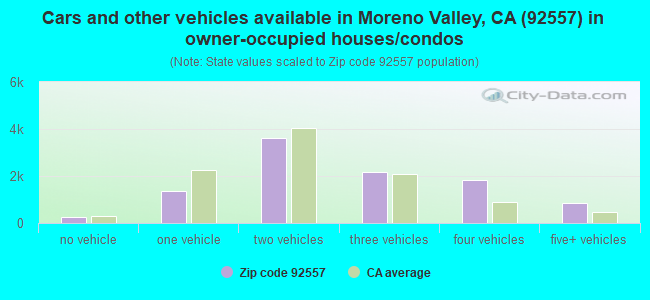
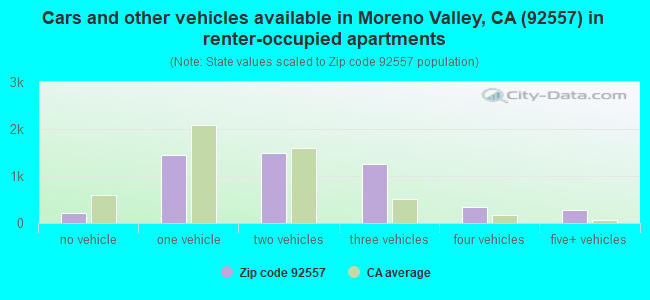


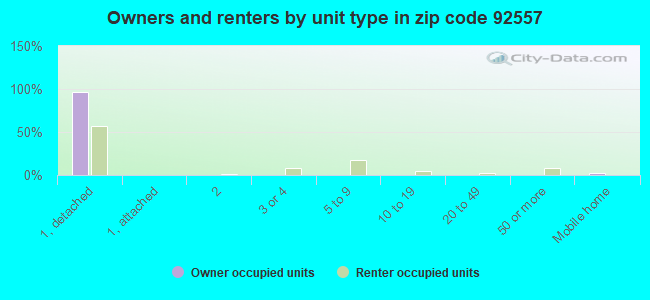
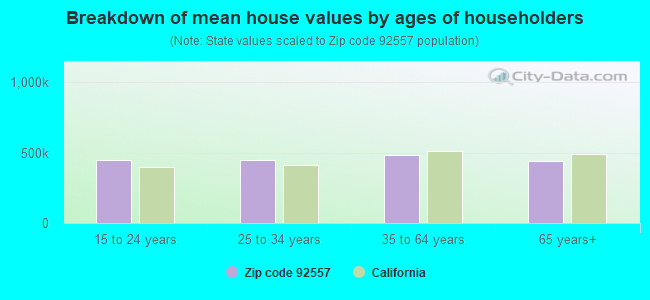


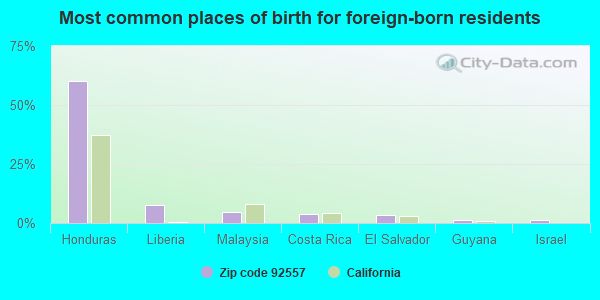
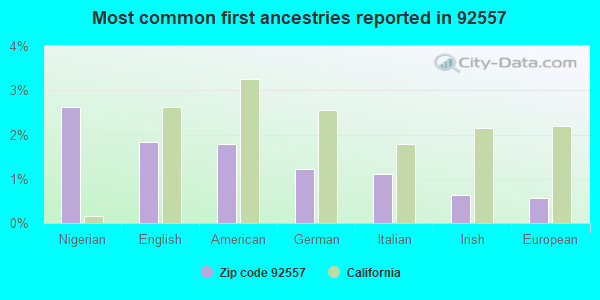
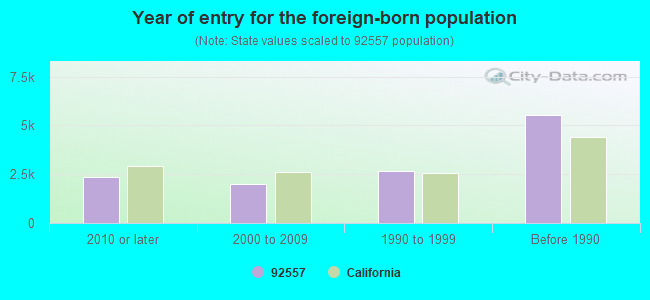


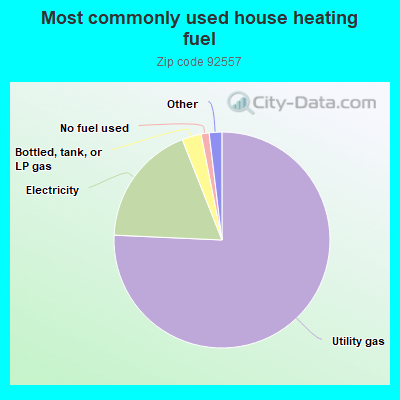
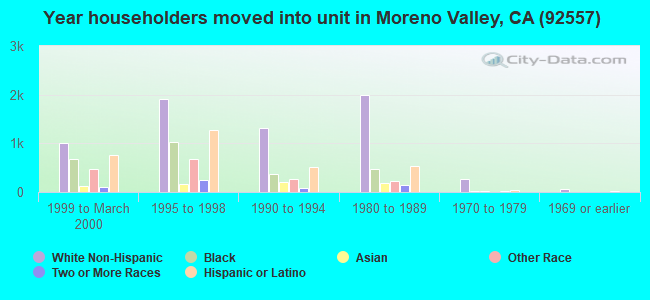
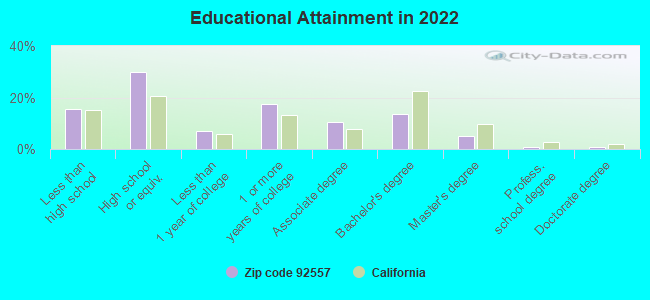
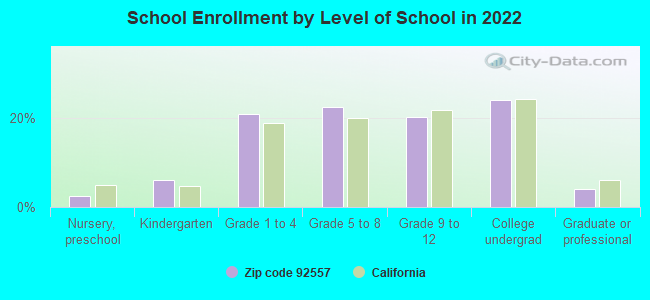
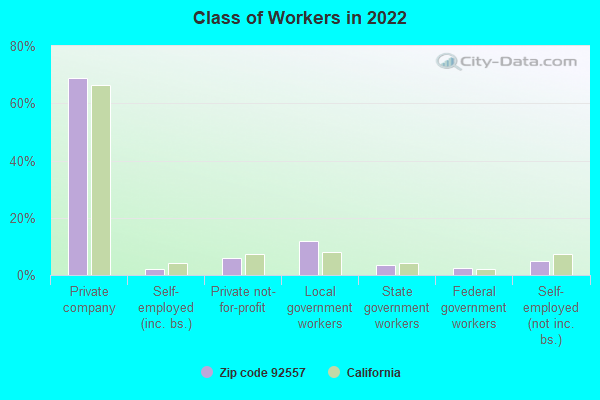
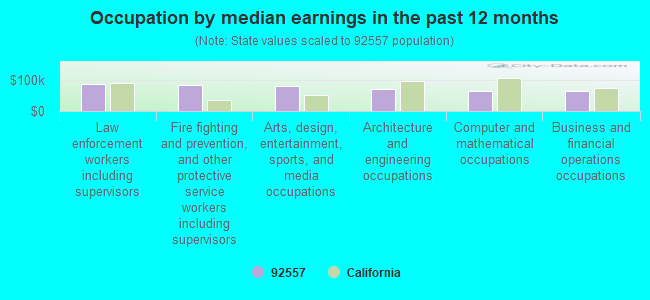
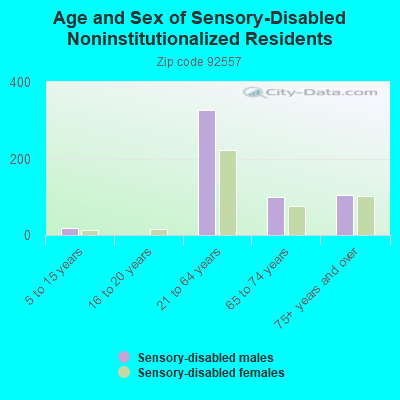
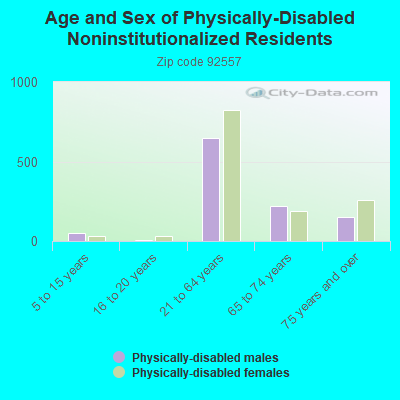

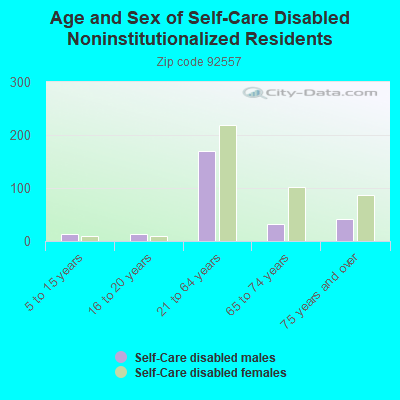
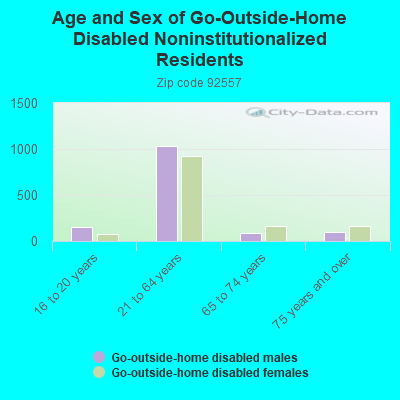
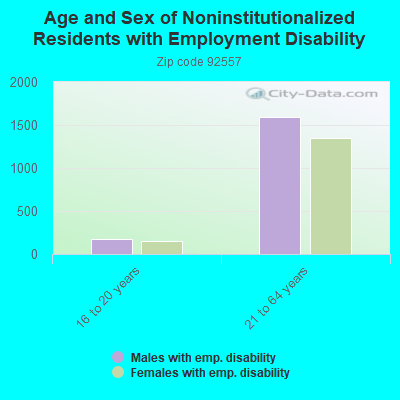
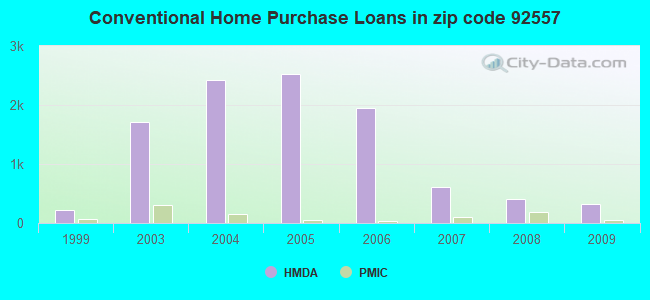
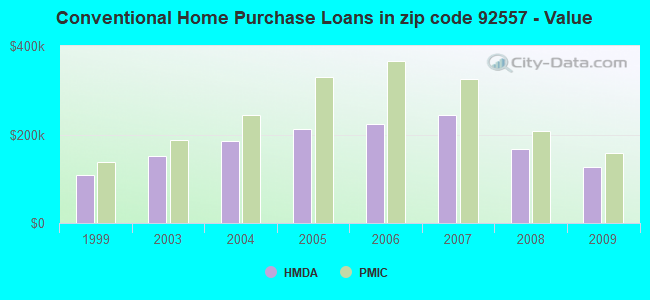
 Based on the data from the years 2006 - 2018 the average number of fire incidents per year is 74. The highest number of fires - 104 took place in 2008, and the least - 9 in 2006. The data has an increasing trend.
 When looking into fire subcategories, the most incidents belonged to: Outside Fires (48.4%), and Mobile Property/Vehicle Fires (21.7%).