Estimated zip code population in 2022: 62,668 Zip code population in 2010: 60,254 Zip code population in 2000: 57,001
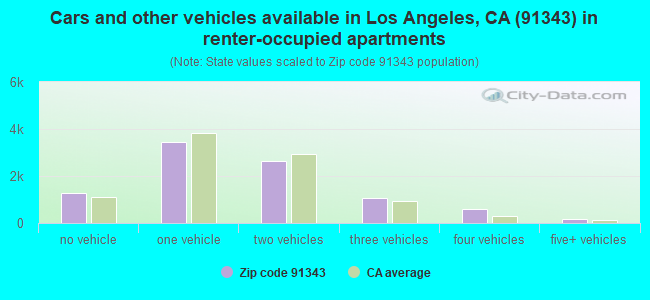
Houses and condos: 18,943 Renter-occupied apartments: 9,223
% of renters here:
50%
State:
44%
March 2022 cost of living index in zip code 91343: 136.1 (high, U.S. average is 100)
Land area: 5.9 sq. mi. Water area: 0.0 sq. mi.
Population density: 10,601 people per square mile
(high).
OSM Map
General Map
Google Map
MSN Map
OSM Map
General Map
Google Map
MSN Map
OSM Map
General Map
Google Map
MSN Map
OSM Map
General Map
Google Map
MSN Map
Please wait while loading the map...
Real estate property taxes paid for housing units in 2022:
This zip code:
0.6% ($4,767)
California:
0.7% ($4,831)
Median real estate property taxes paid for housing units with mortgages in 2022: $5,266 (0.7%) Median real estate property taxes paid for housing units with no mortgage in 2022: $3,198 (0.4%)
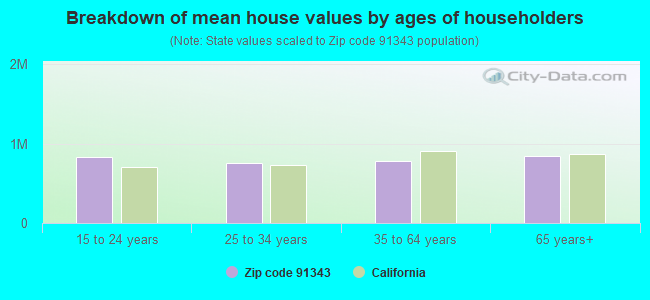
Estimated median house/condo value in 2022: $758,357
91343:
$758,357
California:
$715,900
According to our research of California and other state lists, there were 35 registered sex offenders living in 91343 zip code as of May 04, 2024. The ratio of all residents to sex offenders in zip code 91343 is 1,864 to 1. The ratio of registered sex offenders to all residents in this zip code is much lower than the state average.
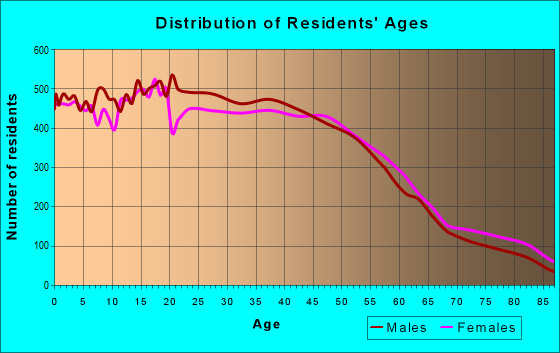
Median resident age:
This zip code:
36.0 years
California median age:
37.9 years
Average household size:
This zip code:
3.4 people
California:
2.8 people
Averages for the 2020 tax year for zip code 91343, filed in 2021:
Average Adjusted Gross Income (AGI) in 2020: $54,312 (Individual Income Tax Returns)
Here:
$54,312
State:
$95,910
Salary/wage: $52,023 (reported on 78.9% of returns)
Here:
$52,023
State:
$77,331
(% of AGI for various income ranges: 1227.4% for AGIs below $25k, 4000.8% for AGIs $25k-50k, 7556.9% for AGIs $50k-75k, 11356.7% for AGIs $75k-100k, 21511.3% for AGIs $100k-200k, 70817.1% for AGIs over 200k)
Taxable interest for individuals: $987 (reported on 25.8% of returns)
This zip code:
$987
California:
$2,294
(% of AGI for various income ranges: 9.4% for AGIs below $25k, 15.3% for AGIs $25k-50k, 33.9% for AGIs $50k-75k, 59.6% for AGIs $75k-100k, 126.1% for AGIs $100k-200k, 857.9% for AGIs over 200k)
Ordinary dividends: $3,067 (reported on 10.9% of returns)
Here:
$3,067
State:
$10,949
(% of AGI for various income ranges: 11.0% for AGIs below $25k, 19.2% for AGIs $25k-50k, 42.5% for AGIs $50k-75k, 104.0% for AGIs $75k-100k, 201.8% for AGIs $100k-200k, 801.7% for AGIs over 200k)
Net capital gain/loss in AGI: +$8,643 (reported on 11.3% of returns)
Here:
+$8,643
State:
+$49,306
(% of AGI for various income ranges: 5.8% for AGIs below $25k, 9.8% for AGIs $25k-50k, 45.8% for AGIs $50k-75k, 92.2% for AGIs $75k-100k, 373.0% for AGIs $100k-200k, 7573.8% for AGIs over 200k)
Profit/loss from business: +$10,062 (reported on 24.8% of returns)
Here:
+$10,062
State:
+$15,671
(% of AGI for various income ranges: 387.7% for AGIs below $25k, 257.5% for AGIs $25k-50k, 329.7% for AGIs $50k-75k, 430.9% for AGIs $75k-100k, 592.2% for AGIs $100k-200k, 3202.1% for AGIs over 200k)
Taxable individual retirement arrangement distribution: $17,276 (reported on 4.3% of returns)
91343:
$17,276
California:
$23,505
(% of AGI for various income ranges: 20.0% for AGIs below $25k, 46.2% for AGIs $25k-50k, 106.7% for AGIs $50k-75k, 261.8% for AGIs $75k-100k, 442.0% for AGIs $100k-200k, 1487.5% for AGIs over 200k)
Self-employed (Keogh) retirement plans: $17,943 (reported on 0.2% of returns)
91343:
$17,943
California:
$30,163
(% of AGI for various income ranges: 40.6% for AGIs $75k-100k, 305.0% for AGIs over 200k)
Total itemized deductions: $30,542 (reported on 13.2% of returns)
Here:
$30,542
State:
$39,517
(% of AGI for various income ranges: 69.0% for AGIs below $25k, 203.8% for AGIs $25k-50k, 653.9% for AGIs $50k-75k, 1339.9% for AGIs $75k-100k, 2760.6% for AGIs $100k-200k, 7936.7% for AGIs over 200k)
Charity contributions: $4,953 (reported on 10.7% of returns)
Here:
$4,953
State:
$12,598
(% of AGI for various income ranges: 3.2% for AGIs below $25k, 16.2% for AGIs $25k-50k, 72.3% for AGIs $50k-75k, 155.0% for AGIs $75k-100k, 405.8% for AGIs $100k-200k, 1397.5% for AGIs over 200k)
Taxes paid: $8,610 (reported on 13.2% of returns)
91343:
$8,610
State:
$8,807
(% of AGI for various income ranges: 15.4% for AGIs below $25k, 51.6% for AGIs $25k-50k, 182.3% for AGIs $50k-75k, 413.5% for AGIs $75k-100k, 836.8% for AGIs $100k-200k, 1857.9% for AGIs over 200k)
Earned income credit: $2,169 (reported on 18.6% of returns)
Here:
$2,169
State:
$2,074
(% of AGI for various income ranges: 112.8% for AGIs below $25k, 72.8% for AGIs $25k-50k, 1.4% for AGIs $50k-75k)
Percentage of individuals using paid preparers for their 2020 taxes: 91.2%
Here:
91%
State:
92%
(% for various income ranges: 88.0% for AGIs below $25k, 92.9% for AGIs $25k-50k, 92.7% for AGIs $50k-75k, 94.0% for AGIs $75k-100k, 92.8% for AGIs $100k-200k, 93.9% for AGIs over 200k)
Averages for the 2012 tax year for zip code 91343, filed in 2013:
Average Adjusted Gross Income (AGI) in 2012: $44,324 (Individual Income Tax Returns)
Here:
$44,324
State:
$72,726
Salary/wage: $42,626 (reported on 82.1% of returns)
Here:
$42,626
State:
$59,079
(% of AGI for various income ranges: 72.8% for AGIs below $25k, 83.9% for AGIs $25k-50k, 82.0% for AGIs $50k-75k, 80.5% for AGIs $75k-100k, 82.3% for AGIs $100k-200k, 59.7% for AGIs over 200k)
Taxable interest for individuals: $940 (reported on 27.6% of returns)
This zip code:
$940
California:
$2,146
(% of AGI for various income ranges: 0.5% for AGIs below $25k, 0.6% for AGIs $25k-50k, 0.6% for AGIs $50k-75k, 0.4% for AGIs $75k-100k, 0.6% for AGIs $100k-200k, 1.1% for AGIs over 200k)
Ordinary dividends: $3,485 (reported on 10.7% of returns)
Here:
$3,485
State:
$9,308
(% of AGI for various income ranges: 0.6% for AGIs below $25k, 0.5% for AGIs $25k-50k, 0.7% for AGIs $50k-75k, 0.7% for AGIs $75k-100k, 0.8% for AGIs $100k-200k, 2.3% for AGIs over 200k)
Net capital gain/loss in AGI: +$2,302 (reported on 8.7% of returns)
Here:
+$2,302
State:
+$30,460
(% of AGI for various income ranges: 0.3% for AGIs $75k-100k, 0.4% for AGIs $100k-200k, 3.5% for AGIs over 200k)
Profit/loss from business: +$10,733 (reported on 22.8% of returns)
Here:
+$10,733
State:
+$17,064
(% of AGI for various income ranges: 19.3% for AGIs below $25k, 5.6% for AGIs $25k-50k, 3.1% for AGIs $50k-75k, 2.4% for AGIs $75k-100k, 2.3% for AGIs $100k-200k, 3.6% for AGIs over 200k)
Taxable individual retirement arrangement distribution: $14,252 (reported on 5.7% of returns)
91343:
$14,252
California:
$19,557
(% of AGI for various income ranges: 1.2% for AGIs below $25k, 1.4% for AGIs $25k-50k, 1.8% for AGIs $50k-75k, 2.1% for AGIs $75k-100k, 2.1% for AGIs $100k-200k, 2.4% for AGIs over 200k)
Self-employment retirement plans: $13,867 (reported on 0.4% of returns)
91343:
$13,867
California:
$24,530
Total itemized deductions: $24,876 (29% of AGI, reported on 31.1% of returns)
Here:
$24,876
State:
$34,004
Here:
28.5% of AGI
State:
22.7% of AGI
(% of AGI for various income ranges: 8.0% for AGIs below $25k, 14.5% for AGIs $25k-50k, 19.4% for AGIs $50k-75k, 21.3% for AGIs $75k-100k, 21.5% for AGIs $100k-200k, 16.2% for AGIs over 200k)
Charity contributions: $2,844 (reported on 25.5% of returns)
Here:
$2,844
State:
$4,659
(% of AGI for various income ranges: 0.4% for AGIs below $25k, 1.0% for AGIs $25k-50k, 1.8% for AGIs $50k-75k, 2.1% for AGIs $75k-100k, 2.2% for AGIs $100k-200k, 2.0% for AGIs over 200k)
Taxes paid: $7,816 (reported on 31.1% of returns)
91343:
$7,816
State:
$14,448
(% of AGI for various income ranges: 1.5% for AGIs below $25k, 3.0% for AGIs $25k-50k, 5.2% for AGIs $50k-75k, 6.7% for AGIs $75k-100k, 7.7% for AGIs $100k-200k, 8.2% for AGIs over 200k)
Earned income credit: $2,489 (reported on 24.5% of returns)
Here:
$2,489
State:
$2,286
(% of AGI for various income ranges: 8.1% for AGIs below $25k, 1.4% for AGIs $25k-50k)
Percentage of individuals using paid preparers for their 2012 taxes: 74.5%
Here:
75%
State:
64%
(% for various income ranges: 74.9% for AGIs below $25k, 75.1% for AGIs $25k-50k, 73.6% for AGIs $50k-75k, 71.5% for AGIs $75k-100k, 74.4% for AGIs $100k-200k, 75.0% for AGIs over 200k)
Averages for the 2004 tax year for zip code 91343, filed in 2005:
Average Adjusted Gross Income (AGI) in 2004: $39,324 (Individual Income Tax Returns)
Here:
$39,324
State:
$58,600
Salary/wage: $37,969 (reported on 83.9% of returns)
Here:
$37,969
State:
$49,455
(% of AGI for various income ranges: 102.9% for AGIs below $10k, 79.8% for AGIs $10k-25k, 85.2% for AGIs $25k-50k, 81.8% for AGIs $50k-75k, 84.7% for AGIs $75k-100k, 74.1% for AGIs over 100k)
Taxable interest for individuals: $1,449 (reported on 38.1% of returns)
This zip code:
$1,449
California:
$2,365
(% of AGI for various income ranges: 5.2% for AGIs below $10k, 1.4% for AGIs $10k-25k, 1.0% for AGIs $25k-50k, 1.2% for AGIs $50k-75k, 1.0% for AGIs $75k-100k, 1.9% for AGIs over 100k)
Taxable dividends: $2,087 (reported on 15.2% of returns)
Here:
$2,087
State:
$4,746
(% of AGI for various income ranges: 2.8% for AGIs below $10k, 0.7% for AGIs $10k-25k, 0.6% for AGIs $25k-50k, 0.7% for AGIs $50k-75k, 0.7% for AGIs $75k-100k, 1.0% for AGIs over 100k)
Net capital gain/loss: +$7,150 (reported on 12.6% of returns)
Here:
+$7,150
State:
+$23,418
(% of AGI for various income ranges: -2.0% for AGIs below $10k, -0.1% for AGIs $10k-25k, -0.0% for AGIs $25k-50k, 0.5% for AGIs $50k-75k, 1.1% for AGIs $75k-100k, 7.4% for AGIs over 100k)
Profit/loss from business: +$10,151 (reported on 21.1% of returns)
Here:
+$10,151
State:
+$16,826
(% of AGI for various income ranges: 31.0% for AGIs below $10k, 11.9% for AGIs $10k-25k, 5.5% for AGIs $25k-50k, 3.6% for AGIs $50k-75k, 2.6% for AGIs $75k-100k, 3.6% for AGIs over 100k)
IRA payment deduction: $2,975 (reported on 2.5% of returns)
91343:
$2,975
California:
$3,192
(% of AGI for various income ranges: 0.3% for AGIs below $10k, 0.1% for AGIs $10k-25k, 0.3% for AGIs $25k-50k, 0.2% for AGIs $50k-75k, 0.2% for AGIs $75k-100k, 0.1% for AGIs over 100k)
Self-employed pension: $9,400 (reported on 0.7% of returns)
Here:
$9,400
California:
$17,688
(% of AGI for various income ranges: 0.1% for AGIs $25k-50k, 0.1% for AGIs $50k-75k, 0.1% for AGIs $75k-100k, 0.3% for AGIs over 100k)
Total itemized deductions: $22,129 (32% of AGI, reported on 37.0% of returns)
Here:
$22,129
State:
$28,113
Here:
31.6% of AGI
State:
25.3% of AGI
(% of AGI for various income ranges: 17.0% for AGIs below $10k, 11.6% for AGIs $10k-25k, 19.7% for AGIs $25k-50k, 24.8% for AGIs $50k-75k, 25.0% for AGIs $75k-100k, 21.3% for AGIs over 100k)
Charity contributions deductions: $2,820 (4% of AGI, reported on 32.2% of returns)
Here:
$2,820
State:
$3,923
Here:
3.8% of AGI
State:
3.3% of AGI
(% of AGI for various income ranges: 0.8% for AGIs below $10k, 0.9% for AGIs $10k-25k, 1.7% for AGIs $25k-50k, 2.5% for AGIs $50k-75k, 2.8% for AGIs $75k-100k, 3.1% for AGIs over 100k)
Total tax: $5,050 (reported on 69.9% of returns)
91343:
$5,050
State:
$10,761
(% of AGI for various income ranges: 6.6% for AGIs below $10k, 3.9% for AGIs $10k-25k, 5.7% for AGIs $25k-50k, 7.9% for AGIs $50k-75k, 9.2% for AGIs $75k-100k, 14.8% for AGIs over 100k)
Earned income credit: $1,994 (reported on 23.9% of returns)
Here:
$1,994
State:
$1,763
Percentage of individuals using paid preparers for their 2004 taxes: 76.4%
Here:
76%
State:
66%
(% for various income ranges: 71.8% for AGIs below $10k, 80.1% for AGIs $10k-25k, 76.6% for AGIs $25k-50k, 75.6% for AGIs $50k-75k, 73.4% for AGIs $75k-100k, 75.9% for AGIs over 100k)
Likely homosexual households (counted as self-reported same-sex unmarried-partner households)
Lesbian couples: 0.3% of all households
Gay men: 0.0% of all households
Household received Food Stamps/SNAP in the past 12 months: 3,427 Household did not receive Food Stamps/SNAP in the past 12 months: 15,166
Women who had a birth in the past 12 months: 777 (344 now married, 437 unmarried) Women who did not have a birth in the past 12 months: 15,601 (5,465 now married, 10,166 unmarried)
Housing units in zip code 91343 with a mortgage: 6,791 (333 second mortgage, 30 home equity loan, 222 both second mortgage and home equity loan) Houses without a mortgage: 120
Median monthly owner costs for units with a mortgage: $2,843 Median monthly owner costs for units without a mortgage: $848
Residents with income below the poverty level in 2022:
This zip code:
17.8%
Whole state:
12.2%
Residents with income below 50% of the poverty level in 2022:
This zip code:
10.8%
Whole state:
6.2%
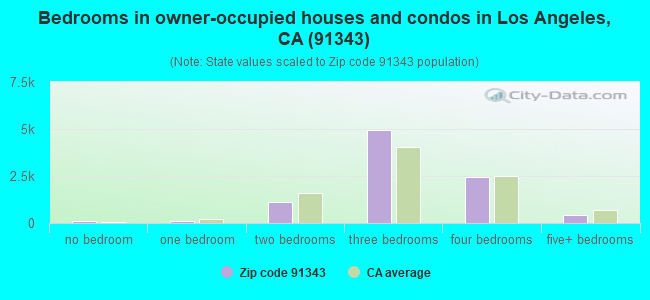
Median number of rooms in houses and condos:
Here:
5.8
State:
6.0
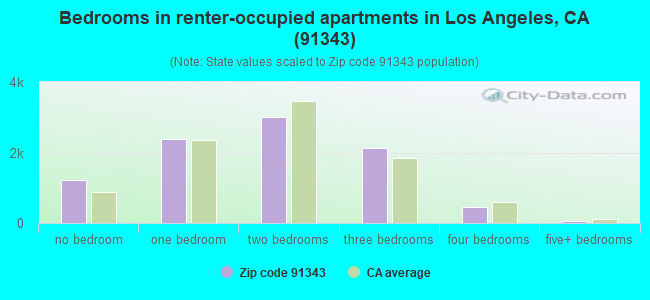
Median number of rooms in apartments:
Here:
3.8
State:
3.9
Notable locations in this zip code not listed on our city pages
Churches in zip code 91343 include: Sepulveda Unitarian Society (A), Sepulveda United Methodist Church (B), Valley Park Baptist Church (C), Church of Christ (D), Church of the Living Word (E), Our Lady of Peace Catholic Church (F), Valley Presbyterian Church (G). Display/hide their locations on the map
7,995 married couples with children.
4,149 single-parent households (1,080 men, 3,069 women).
34.3% of residents of 91343 zip code speak English at home.
48.1% of residents speak Spanish at home (60% very well, 16% well, 16% not well, 8% not at all).
5.7% of residents speak other Indo-European language at home (62% very well, 22% well, 12% not well, 4% not at all).
10.1% of residents speak Asian or Pacific Island language at home (53% very well, 28% well, 15% not well, 3% not at all).
2.1% of residents speak other language at home (68% very well, 20% well, 5% not well, 7% not at all).
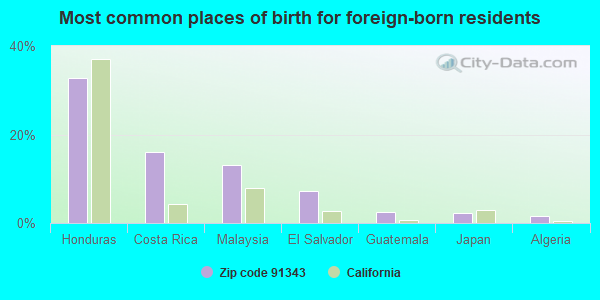
Foreign born population: 25,748 (41.1%) (50.9% of them are naturalized citizens)
This zip code:
41.1%
Whole state:
26.7%
33%Honduras
16%Costa Rica
13%Malaysia
7%El Salvador
2%Guatemala
2%Japan
2%Algeria
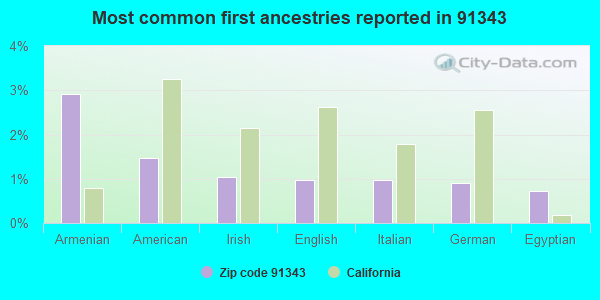
3%Armenian
1%American
1%Irish
1%English
1%Italian
1%German
1%Egyptian
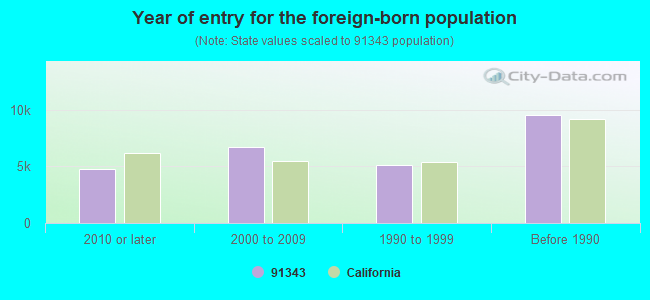
Year of entry for the foreign-born population
4,8002010 or later
6,7422000 to 2009
5,1121990 to 1999
9,543Before 1990
Major facilities with environmental interests located in this zip code:
MONROE (JAMES) HIGH (9229 HASKELL AVE. in SEPULVEDA, CA)
(National Center for Education Statistics) - STATE ID-1935865 Large Quantity Generators, more that 1000 kg of hazardous waste/month (Resource Conservation and Recovery Act (tracking hazardous waste)) Organizations: LAUSD (CONTACT/OPERATOR)
, LOS ANGELES UNIFIED (SCHOOL DISTRICT)
Alternative names: LAUSD--MONROE HS
MONROE E S NO 2 (8855 NOBLE AVE in NORTH HILLS, CA)
STATE MASTER (California - Hazardous Waste Tracking) - HAZARDOU WASTE PROGRAM Large Quantity Generators, more that 1000 kg of hazardous waste/month (Resource Conservation and Recovery Act (tracking hazardous waste)) - notification Organizations: LAUSD (CONTACT/OPERATOR)
4 WHEEL SPECIALTIES (9441 SEPULVEDA BLVD in SEPULVEDA, CA)
STATE MASTER (California - Hazardous Waste Tracking) - HAZARDOU WASTE PROGRAM Small Quantity Generators, between 100 kg and 1000 kg of hazardous waste/month (Resource Conservation and Recovery Act (tracking hazardous waste)) Organizations: DWAYNE CASTAGENA (CONTACT/OPERATOR)
Alternative names: 4 WHEEL SPECIALTIES UNLIMITED
GALPIN MOTORS INC (15505 ROSCOE BLVD in SEPULVEDA, CA)
STATE MASTER (California - Hazardous Waste Tracking) - HAZARDOU WASTE PROGRAM Large Quantity Generators, more that 1000 kg of hazardous waste/month (Resource Conservation and Recovery Act (tracking hazardous waste))
LA USD SEPULVEDA JUNIOR HIGH (15330 PLUMMER ST in SEPULVEDA, CA)
STATE MASTER (California - Hazardous Waste Tracking) - HAZARDOU WASTE PROGRAM Small Quantity Generators, between 100 kg and 1000 kg of hazardous waste/month (Resource Conservation and Recovery Act (tracking hazardous waste)) - notification Alternative names: LAUSD/ SEPULVEDA JUNIOR HIGH
BALBOA EQUIP RENTALS (16755 ROSCOE BLVD in SEPULVEDA, CA)
STATE MASTER (California - Hazardous Waste Tracking) - HAZARDOU WASTE PROGRAM Small Quantity Generators, between 100 kg and 1000 kg of hazardous waste/month (Resource Conservation and Recovery Act (tracking hazardous waste)) - notification Business NAICS classification: CONSTRUCTION, MINING, AND FORESTRY MACHINERY AND EQUIPMENT RENTAL AND LEASING. Organizations: L A DEPT OF AIRPORTS (CONTACT/OWNER)
NIEL'S SERVIC CORP (8646 SEPULVEDA BLVD in SEPULVEDA, CA) . Federal Facility
STATE MASTER (California - Hazardous Waste Tracking) - HAZARDOU WASTE PROGRAM Small Quantity Generators, between 100 kg and 1000 kg of hazardous waste/month (Resource Conservation and Recovery Act (tracking hazardous waste)) - notification Organizations: STAMCY INC (CONTACT/OWNER)
Alternative names: NIELS MOTOR HOMES
EINSTEIN (ALBERT) CONTINUATION (15938 TUPPER ST. in SEPULVEDA, CA)
(National Center for Education Statistics) - STATE ID-1931385 Organizations: LOS ANGELES UNIFIED (SCHOOL DISTRICT)
GLEDHILL STREET ELEMENTARY (16030 GLEDHILL ST. in SEPULVEDA, CA)
(National Center for Education Statistics) - STATE ID-6017289 Organizations: LOS ANGELES UNIFIED (SCHOOL DISTRICT)
LANGDON AVENUE ELEMENTARY (8817 LANGDON AVE. in SEPULVEDA, CA)
(National Center for Education Statistics) - STATE ID-6017776 Organizations: LOS ANGELES UNIFIED (SCHOOL DISTRICT)
LASSEN ELEMENTARY (15017 SUPERIOR ST. in SEPULVEDA, CA)
(National Center for Education Statistics) - STATE ID-6017792 Organizations: LOS ANGELES UNIFIED (SCHOOL DISTRICT)
MAYALL STREET ELEMENTARY (16701 MAYALL ST. in SEPULVEDA, CA)
(National Center for Education Statistics) - STATE ID-6018089 Organizations: LOS ANGELES UNIFIED (SCHOOL DISTRICT)
NOBLE AVENUE ELEMENTARY (8329 NOBLE AVE. in SEPULVEDA, CA)
(National Center for Education Statistics) - STATE ID-6018394 Organizations: LOS ANGELES UNIFIED (SCHOOL DISTRICT)
Housing units lacking complete plumbing facilities: 0.5% Housing units lacking complete kitchen facilities: 2.2%
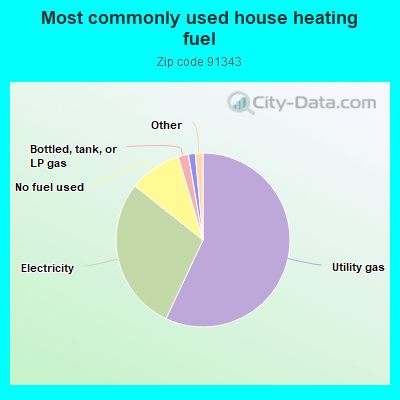
57.0%Utility gas
28.7%Electricity
9.7%No fuel used
1.9%Bottled, tank, or LP gas
1.3%Solar energy
0.7%Wood
0.5%Coal or coke
Population in 1990: 48,751. Population change in the 1990s: +8,250 (+16.9%).
Place of birth for U.S.-born residents:
This state: 31,292
Northeast: 1,646
Midwest: 1,596
South: 1,222
West: 690
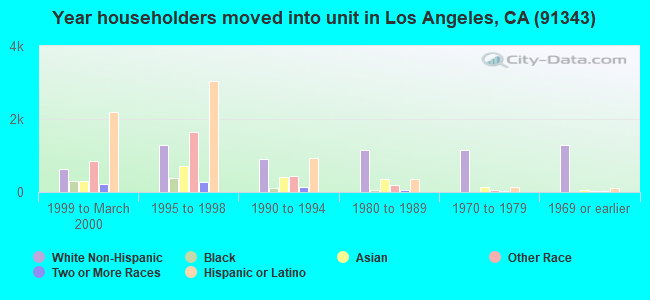
53% of the 91343 zip code residents lived in the same house 5 years ago. Out of people who lived in different houses, 91% lived in this county. Out of people who lived in different counties, 50% lived in California.
93% of the 91343 zip code residents lived in the same house 1 year ago. Out of people who lived in different houses, 77% moved from this county. Out of people who lived in different houses, 4% moved from different county within same state. Out of people who lived in different houses, 11% moved from different state. Out of people who lived in different houses, 10% moved from abroad.
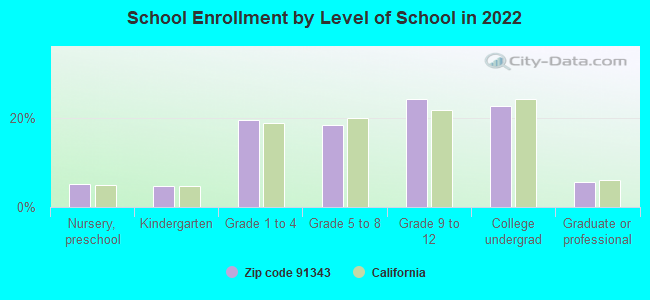
Private vs. public school enrollment:
Students in private schools in grades 1 to 8 (elementary and middle school): 548
Here:
8.6%
California:
10.5%
Students in private schools in grades 9 to 12 (high school): 316
Here:
7.8%
California:
8.5%
Students in private undergraduate colleges: 399
Here:
10.5%
California:
15.9%
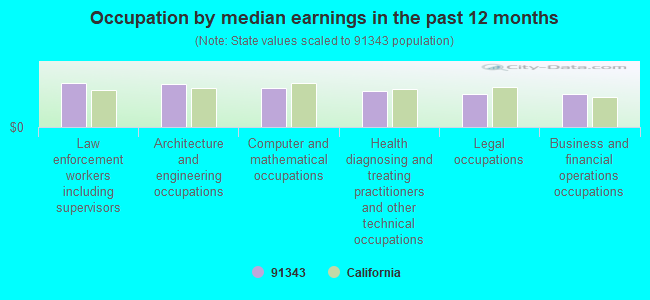
Occupation by median earnings in the past 12 months ($)
101,085Law enforcement workers including supervisors
100,315Architecture and engineering occupations
90,330Computer and mathematical occupations
83,117Health diagnosing and treating practitioners and other technical occupations
76,800Legal occupations
75,858Business and financial operations occupations
Companies with federal contracts located in this zip code:
PRIDE LAUNDRY SYSTEMS INC (8321 DE CELIS PL in NORTH HILLS, CA; small business) : $417,434 in 12 contractsfrom 2003 to 2006
Contracts for Children's and Infants' Apparel and Accessories, Non-nuclear Ship Repair (West) Ship repair (including overhauls and conversions) performed on. non-nuclear propelled and nonpropelled ships west of the 108th meridian, Laundry and Dry Cleaning Equipment by Army, Navy Signed by year:2000: $0; 2001: $0; 2002: $0; 2003: $54,116; 2004: $8,345; 2005: $56,881; 2006: $298,092.
Biggest contracts:
$276,488 with Army for Children's and Infants' Apparel and Accessories. Signed on 2006-01-10. Completion date: 2006-07-12.
$28,311 with Navy for Non-nuclear Ship Repair (West) Ship repair (including overhauls and conversions) performed on. non-nuclear propelled and nonpropelled ships west of the 108th meridian. Signed on 2003-06-04. Completion date: 2003-07-15.
$21,834 with Navy for Laundry and Dry Cleaning Equipment. Signed on 2005-09-17. Completion date: 2005-10-07.
$15,712, same as above.Signed on 2006-05-15. Completion date: 2006-06-09.
GORKO INDUSTRIES, INC (16772 SCHOENBORN ST in NORTH HILLS, CA; small business) : $87,275 in 10 contractsfrom 2004 to 2006
Contracts for Bearings, Antifriction, Unmounted, Guns, through 30 mm, Nails, Machine Keys, and Pins by Defense Logistics Agency Signed by year:2000: $0; 2001: $0; 2002: $0; 2003: $0; 2004: $3,580; 2005: $42,723; 2006: $40,972.
Biggest contracts:
$16,438 with Defense Logistics Agency for Bearings, Antifriction, Unmounted. Signed on 2006-05-11. Completion date: 2006-09-04.
$16,407, same as above.Signed on 2005-03-12. Completion date: 2005-07-07.
$14,276, same as above.Signed on 2006-05-23. Completion date: 2006-09-15.
$10,898, same as above.Signed on 2005-09-28. Completion date: 2006-01-20.
PHILLIPS, KEN (9416 VALJEAN AVE in NORTH HILLS, CA; small business) : $56,443 in 5 contractsfrom 2004 to 2005
Contracts for Signs, Advertising Displays, and Identification Plates, Miscellaneous Items, Office Supplies by Army Signed by year:2000: $0; 2001: $0; 2002: $0; 2003: $0; 2004: $9,199; 2005: $47,244; 2006: $0.
Biggest contracts:
$20,000 with Army for Signs, Advertising Displays, and Identification Plates. Signed on 2005-08-24. Completion date: 2005-10-01.
$19,750, same as above.Signed on 2005-03-03. Completion date: 2005-03-21.
$7,494 with Army for Miscellaneous Items. Taking place in WY. Signed on 2005-08-03. Completion date: 2005-09-02.
$4,999 with Army for Office Supplies. Taking place in NV. Signed on 2004-09-28. Completion date: 2004-10-15.
ISAIAH R RHODES (16309 CHASE ST in SEPULVEDA, CA; small business) : $36,702 in 4 contractsfrom 2001 to 2002
$25,000 with U.S. Army Corps of Engineers - civil program financing only for Guard Services. Taking place in NY. Signed on 2001-12-28. Completion date: 2001-12-31.
$9,650, same as above.Signed on 2002-02-28. Completion date: 2002-04-30.
$2,052, same as above.Signed on 2002-02-27. Completion date: 2002-02-27.
$0, same as above.Signed on 2002-02-27. Completion date: 2002-02-27.
PCA ELECTRONICS INC (16799 SCHOENBORN ST in NORTH HILLS, CA; small business)
$2,390 with Army for Coils and Transformers. Signed on 2005-12-13. Completion date: 2006-03-21.
DILLON, BRIAN D (16007 LEMARSH ST in NORTH HILLS, CA; small business)
-$44,239 with Army for Other Research and Development -- Applied Research and Exploratory Development (R&D). Signed on 1999-10-19. Completion date: 1998-09-30.
Top industries in this zip code by the number of employees in 2005:
Health Care and Social Assistance: General Medical and Surgical Hospitals (500-999 employees: 1 establishment)
Arts, Entertainment, and Recreation: Fitness and Recreational Sports Centers (250-499: 1, 20-49: 1)
2005 - 2018 National Fire Incident Reporting System (NFIRS) incidents
According to the data from the years 2005 - 2018 the average number of fires per year is 89. The highest number of fires - 125 took place in 2006, and the least - 41 in 2012. The data has a growing trend.
When looking into fire subcategories, the most reports belonged to: Structure Fires (42.6%), and Mobile Property/Vehicle Fires (27.6%).
Fire incident types reported to NFIRS in Zip Code 91343


 Nearest zip codes: 91325, 91345, 91402, 91406, 91330, 91405.
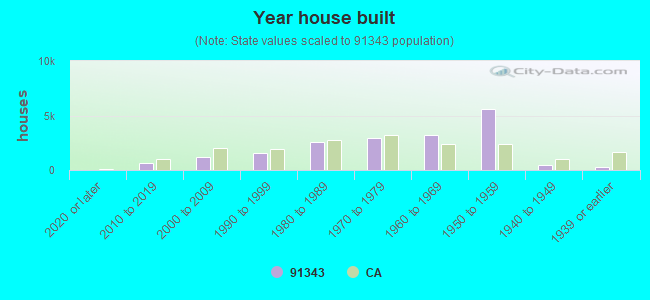


 According to the data from the years 2005 - 2018 the average number of fires per year is 89. The highest number of fires - 125 took place in 2006, and the least - 41 in 2012. The data has a growing trend.
 When looking into fire subcategories, the most reports belonged to: Structure Fires (42.6%), and Mobile Property/Vehicle Fires (27.6%).