Estimated zip code population in 2022: 36,199
Zip code population in 2010: 33,708
Zip code population in 2000: 28,049
Houses and condos: 13,584
Renter-occupied apartments: 3,148
% of renters here:
24%State:
44%
March 2022 cost of living index in zip code 91326: 134.8
(high, U.S. average is 100)
Land area: 8.2
sq. mi.
Water area: 0.0
sq. mi.
Population density: 4,437 people per square mile (average).
OSM Map
General Map
Google Map
MSN Map
OSM Map
General Map
Google Map
MSN Map
OSM Map
General Map
Google Map
MSN Map
OSM Map
General Map
Google Map
MSN Map
Please wait while loading the map...
Real estate property taxes paid for housing units in 2022:
This zip code:
0.8% ($7,818)California:
0.7% ($4,831)
Median real estate property taxes paid for housing units with mortgages in 2022: $8,401 (0.8%)
Median real estate property taxes paid for housing units with no mortgage in 2022: $6,715 (0.7%)
Profiles of local businesses
Business Search - 14 Million verified businesses
Males: 18,117 Females: 18,082
For population 25 years and over in 91326:
High school or higher: 96.0%Bachelor's degree or higher: 57.0%Graduate or professional degree: 24.2%Unemployed: 3.2%Mean travel time to work (commute): 32.4 minutes
For population 15 years and over in 91326:
Never married: 29.0%Now married: 58.9%Separated: 1.1%Widowed: 4.3%Divorced: 6.8%
Zip code 91326 compared to state average:
Median household income above state average. Hispanic race population percentage significantly below state average. Median age above state average. Renting percentage below state average. Length of stay since moving in above state average. Number of rooms per house above state average. House age below state average. Percentage of population with a bachelor's degree or higher above state average. 15,012 41.5% White 11,248 31.1% Asian 4,856 13.4% Hispanic or Latino 2,963 8.2% Black 1,663 4.6% Two or more races 356 1.0% Some other race 55 0.2% American Indian 44 0.1% Native Hawaiian and Other
Data:
Median household income ($)
Median household income (% change since 2000)
Household income diversity
Ratio of average income to average house value (%)
Ratio of average income to average rent
Median household income ($) - White
Median household income ($) - Black or African American
Median household income ($) - Asian
Median household income ($) - Hispanic or Latino
Median household income ($) - American Indian and Alaska Native
Median household income ($) - Multirace
Median household income ($) - Other Race
Median household income for houses/condos with a mortgage ($)
Median household income for apartments without a mortgage ($)
Races - White alone (%)
Races - White alone (% change since 2000)
Races - Black alone (%)
Races - Black alone (% change since 2000)
Races - American Indian alone (%)
Races - American Indian alone (% change since 2000)
Races - Asian alone (%)
Races - Asian alone (% change since 2000)
Races - Hispanic (%)
Races - Hispanic (% change since 2000)
Races - Native Hawaiian and Other Pacific Islander alone (%)
Races - Native Hawaiian and Other Pacific Islander alone (% change since 2000)
Races - Two or more races (%)
Races - Two or more races (% change since 2000)
Races - Other race alone (%)
Races - Other race alone (% change since 2000)
Racial diversity
Unemployment (%)
Unemployment (% change since 2000)
Unemployment (%) - White
Unemployment (%) - Black or African American
Unemployment (%) - Asian
Unemployment (%) - Hispanic or Latino
Unemployment (%) - American Indian and Alaska Native
Unemployment (%) - Multirace
Unemployment (%) - Other Race
Population density (people per square mile)
Population - Males (%)
Population - Females (%)
Population - Males (%) - White
Population - Males (%) - Black or African American
Population - Males (%) - Asian
Population - Males (%) - Hispanic or Latino
Population - Males (%) - American Indian and Alaska Native
Population - Males (%) - Multirace
Population - Males (%) - Other Race
Population - Females (%) - White
Population - Females (%) - Black or African American
Population - Females (%) - Asian
Population - Females (%) - Hispanic or Latino
Population - Females (%) - American Indian and Alaska Native
Population - Females (%) - Multirace
Population - Females (%) - Other Race
Coronavirus confirmed cases (May 04, 2024)
Deaths caused by coronavirus (May 04, 2024)
Coronavirus confirmed cases (per 100k population) (May 04, 2024)
Deaths caused by coronavirus (per 100k population) (May 04, 2024)
Daily increase in number of cases (May 04, 2024)
Weekly increase in number of cases (May 04, 2024)
Cases doubled (in days) (May 04, 2024)
Hospitalized patients (Apr 18, 2022)
Negative test results (Apr 18, 2022)
Total test results (Apr 18, 2022)
COVID Vaccine doses distributed (per 100k population) (Sep 19, 2023)
COVID Vaccine doses administered (per 100k population) (Sep 19, 2023)
COVID Vaccine doses distributed (Sep 19, 2023)
COVID Vaccine doses administered (Sep 19, 2023)
Likely homosexual households (%)
Likely homosexual households (% change since 2000)
Likely homosexual households - Lesbian couples (%)
Likely homosexual households - Lesbian couples (% change since 2000)
Likely homosexual households - Gay men (%)
Likely homosexual households - Gay men (% change since 2000)
Cost of living index
Median gross rent ($)
Median contract rent ($)
Median monthly housing costs ($)
Median house or condo value ($)
Median house or condo value ($ change since 2000)
Mean house or condo value by units in structure - 1, detached ($)
Mean house or condo value by units in structure - 1, attached ($)
Mean house or condo value by units in structure - 2 ($)
Mean house or condo value by units in structure by units in structure - 3 or 4 ($)
Mean house or condo value by units in structure - 5 or more ($)
Mean house or condo value by units in structure - Boat, RV, van, etc. ($)
Mean house or condo value by units in structure - Mobile home ($)
Median house or condo value ($) - White
Median house or condo value ($) - Black or African American
Median house or condo value ($) - Asian
Median house or condo value ($) - Hispanic or Latino
Median house or condo value ($) - American Indian and Alaska Native
Median house or condo value ($) - Multirace
Median house or condo value ($) - Other Race
Median resident age
Resident age diversity
Median resident age - Males
Median resident age - Females
Median resident age - White
Median resident age - Black or African American
Median resident age - Asian
Median resident age - Hispanic or Latino
Median resident age - American Indian and Alaska Native
Median resident age - Multirace
Median resident age - Other Race
Median resident age - Males - White
Median resident age - Males - Black or African American
Median resident age - Males - Asian
Median resident age - Males - Hispanic or Latino
Median resident age - Males - American Indian and Alaska Native
Median resident age - Males - Multirace
Median resident age - Males - Other Race
Median resident age - Females - White
Median resident age - Females - Black or African American
Median resident age - Females - Asian
Median resident age - Females - Hispanic or Latino
Median resident age - Females - American Indian and Alaska Native
Median resident age - Females - Multirace
Median resident age - Females - Other Race
Commute - mean travel time to work (minutes)
Travel time to work - Less than 5 minutes (%)
Travel time to work - Less than 5 minutes (% change since 2000)
Travel time to work - 5 to 9 minutes (%)
Travel time to work - 5 to 9 minutes (% change since 2000)
Travel time to work - 10 to 19 minutes (%)
Travel time to work - 10 to 19 minutes (% change since 2000)
Travel time to work - 20 to 29 minutes (%)
Travel time to work - 20 to 29 minutes (% change since 2000)
Travel time to work - 30 to 39 minutes (%)
Travel time to work - 30 to 39 minutes (% change since 2000)
Travel time to work - 40 to 59 minutes (%)
Travel time to work - 40 to 59 minutes (% change since 2000)
Travel time to work - 60 to 89 minutes (%)
Travel time to work - 60 to 89 minutes (% change since 2000)
Travel time to work - 90 or more minutes (%)
Travel time to work - 90 or more minutes (% change since 2000)
Marital status - Never married (%)
Marital status - Now married (%)
Marital status - Separated (%)
Marital status - Widowed (%)
Marital status - Divorced (%)
Median family income ($)
Median family income (% change since 2000)
Median non-family income ($)
Median non-family income (% change since 2000)
Median per capita income ($)
Median per capita income (% change since 2000)
Median family income ($) - White
Median family income ($) - Black or African American
Median family income ($) - Asian
Median family income ($) - Hispanic or Latino
Median family income ($) - American Indian and Alaska Native
Median family income ($) - Multirace
Median family income ($) - Other Race
Median year house/condo built
Median year apartment built
Year house built - Built 2005 or later (%)
Year house built - Built 2000 to 2004 (%)
Year house built - Built 1990 to 1999 (%)
Year house built - Built 1980 to 1989 (%)
Year house built - Built 1970 to 1979 (%)
Year house built - Built 1960 to 1969 (%)
Year house built - Built 1950 to 1959 (%)
Year house built - Built 1940 to 1949 (%)
Year house built - Built 1939 or earlier (%)
Average household size
Household density (households per square mile)
Average household size - White
Average household size - Black or African American
Average household size - Asian
Average household size - Hispanic or Latino
Average household size - American Indian and Alaska Native
Average household size - Multirace
Average household size - Other Race
Occupied housing units (%)
Vacant housing units (%)
Owner occupied housing units (%)
Renter occupied housing units (%)
Vacancy status - For rent (%)
Vacancy status - For sale only (%)
Vacancy status - Rented or sold, not occupied (%)
Vacancy status - For seasonal, recreational, or occasional use (%)
Vacancy status - For migrant workers (%)
Vacancy status - Other vacant (%)
Residents with income below the poverty level (%)
Residents with income below 50% of the poverty level (%)
Children below poverty level (%)
Poor families by family type - Married-couple family (%)
Poor families by family type - Male, no wife present (%)
Poor families by family type - Female, no husband present (%)
Poverty status for native-born residents (%)
Poverty status for foreign-born residents (%)
Poverty among high school graduates not in families (%)
Poverty among people who did not graduate high school not in families (%)
Residents with income below the poverty level (%) - White
Residents with income below the poverty level (%) - Black or African American
Residents with income below the poverty level (%) - Asian
Residents with income below the poverty level (%) - Hispanic or Latino
Residents with income below the poverty level (%) - American Indian and Alaska Native
Residents with income below the poverty level (%) - Multirace
Residents with income below the poverty level (%) - Other Race
Air pollution - Air Quality Index (AQI)
Air pollution - CO
Air pollution - NO2
Air pollution - SO2
Air pollution - Ozone
Air pollution - PM10
Air pollution - PM25
Air pollution - Pb
Crime - Murders per 100,000 population
Crime - Rapes per 100,000 population
Crime - Robberies per 100,000 population
Crime - Assaults per 100,000 population
Crime - Burglaries per 100,000 population
Crime - Thefts per 100,000 population
Crime - Auto thefts per 100,000 population
Crime - Arson per 100,000 population
Crime - City-data.com crime index
Crime - Violent crime index
Crime - Property crime index
Crime - Murders per 100,000 population (5 year average)
Crime - Rapes per 100,000 population (5 year average)
Crime - Robberies per 100,000 population (5 year average)
Crime - Assaults per 100,000 population (5 year average)
Crime - Burglaries per 100,000 population (5 year average)
Crime - Thefts per 100,000 population (5 year average)
Crime - Auto thefts per 100,000 population (5 year average)
Crime - Arson per 100,000 population (5 year average)
Crime - City-data.com crime index (5 year average)
Crime - Violent crime index (5 year average)
Crime - Property crime index (5 year average)
1996 Presidential Elections Results (%) - Democratic Party (Clinton)
1996 Presidential Elections Results (%) - Republican Party (Dole)
1996 Presidential Elections Results (%) - Other
2000 Presidential Elections Results (%) - Democratic Party (Gore)
2000 Presidential Elections Results (%) - Republican Party (Bush)
2000 Presidential Elections Results (%) - Other
2004 Presidential Elections Results (%) - Democratic Party (Kerry)
2004 Presidential Elections Results (%) - Republican Party (Bush)
2004 Presidential Elections Results (%) - Other
2008 Presidential Elections Results (%) - Democratic Party (Obama)
2008 Presidential Elections Results (%) - Republican Party (McCain)
2008 Presidential Elections Results (%) - Other
2012 Presidential Elections Results (%) - Democratic Party (Obama)
2012 Presidential Elections Results (%) - Republican Party (Romney)
2012 Presidential Elections Results (%) - Other
2016 Presidential Elections Results (%) - Democratic Party (Clinton)
2016 Presidential Elections Results (%) - Republican Party (Trump)
2016 Presidential Elections Results (%) - Other
2020 Presidential Elections Results (%) - Democratic Party (Biden)
2020 Presidential Elections Results (%) - Republican Party (Trump)
2020 Presidential Elections Results (%) - Other
Ancestries Reported - Arab (%)
Ancestries Reported - Czech (%)
Ancestries Reported - Danish (%)
Ancestries Reported - Dutch (%)
Ancestries Reported - English (%)
Ancestries Reported - French (%)
Ancestries Reported - French Canadian (%)
Ancestries Reported - German (%)
Ancestries Reported - Greek (%)
Ancestries Reported - Hungarian (%)
Ancestries Reported - Irish (%)
Ancestries Reported - Italian (%)
Ancestries Reported - Lithuanian (%)
Ancestries Reported - Norwegian (%)
Ancestries Reported - Polish (%)
Ancestries Reported - Portuguese (%)
Ancestries Reported - Russian (%)
Ancestries Reported - Scotch-Irish (%)
Ancestries Reported - Scottish (%)
Ancestries Reported - Slovak (%)
Ancestries Reported - Subsaharan African (%)
Ancestries Reported - Swedish (%)
Ancestries Reported - Swiss (%)
Ancestries Reported - Ukrainian (%)
Ancestries Reported - United States (%)
Ancestries Reported - Welsh (%)
Ancestries Reported - West Indian (%)
Ancestries Reported - Other (%)
Educational Attainment - No schooling completed (%)
Educational Attainment - Less than high school (%)
Educational Attainment - High school or equivalent (%)
Educational Attainment - Less than 1 year of college (%)
Educational Attainment - 1 or more years of college (%)
Educational Attainment - Associate degree (%)
Educational Attainment - Bachelor's degree (%)
Educational Attainment - Master's degree (%)
Educational Attainment - Professional school degree (%)
Educational Attainment - Doctorate degree (%)
School Enrollment - Nursery, preschool (%)
School Enrollment - Kindergarten (%)
School Enrollment - Grade 1 to 4 (%)
School Enrollment - Grade 5 to 8 (%)
School Enrollment - Grade 9 to 12 (%)
School Enrollment - College undergrad (%)
School Enrollment - Graduate or professional (%)
School Enrollment - Not enrolled in school (%)
School enrollment - Public schools (%)
School enrollment - Private schools (%)
School enrollment - Not enrolled (%)
Median number of rooms in houses and condos
Median number of rooms in apartments
Housing units lacking complete plumbing facilities (%)
Housing units lacking complete kitchen facilities (%)
Density of houses
Urban houses (%)
Rural houses (%)
Households with people 60 years and over (%)
Households with people 65 years and over (%)
Households with people 75 years and over (%)
Households with one or more nonrelatives (%)
Households with no nonrelatives (%)
Population in households (%)
Family households (%)
Nonfamily households (%)
Population in families (%)
Family households with own children (%)
Median number of bedrooms in owner occupied houses
Mean number of bedrooms in owner occupied houses
Median number of bedrooms in renter occupied houses
Mean number of bedrooms in renter occupied houses
Median number of vehichles in owner occupied houses
Mean number of vehichles in owner occupied houses
Median number of vehichles in renter occupied houses
Mean number of vehichles in renter occupied houses
Mortgage status - with mortgage (%)
Mortgage status - with second mortgage (%)
Mortgage status - with home equity loan (%)
Mortgage status - with both second mortgage and home equity loan (%)
Mortgage status - without a mortgage (%)
Average family size
Average family size - White
Average family size - Black or African American
Average family size - Asian
Average family size - Hispanic or Latino
Average family size - American Indian and Alaska Native
Average family size - Multirace
Average family size - Other Race
Geographical mobility - Same house 1 year ago (%)
Geographical mobility - Moved within same county (%)
Geographical mobility - Moved from different county within same state (%)
Geographical mobility - Moved from different state (%)
Geographical mobility - Moved from abroad (%)
Place of birth - Born in state of residence (%)
Place of birth - Born in other state (%)
Place of birth - Native, outside of US (%)
Place of birth - Foreign born (%)
Housing units in structures - 1, detached (%)
Housing units in structures - 1, attached (%)
Housing units in structures - 2 (%)
Housing units in structures - 3 or 4 (%)
Housing units in structures - 5 to 9 (%)
Housing units in structures - 10 to 19 (%)
Housing units in structures - 20 to 49 (%)
Housing units in structures - 50 or more (%)
Housing units in structures - Mobile home (%)
Housing units in structures - Boat, RV, van, etc. (%)
House/condo owner moved in on average (years ago)
Renter moved in on average (years ago)
Year householder moved into unit - Moved in 1999 to March 2000 (%)
Year householder moved into unit - Moved in 1995 to 1998 (%)
Year householder moved into unit - Moved in 1990 to 1994 (%)
Year householder moved into unit - Moved in 1980 to 1989 (%)
Year householder moved into unit - Moved in 1970 to 1979 (%)
Year householder moved into unit - Moved in 1969 or earlier (%)
Means of transportation to work - Drove car alone (%)
Means of transportation to work - Carpooled (%)
Means of transportation to work - Public transportation (%)
Means of transportation to work - Bus or trolley bus (%)
Means of transportation to work - Streetcar or trolley car (%)
Means of transportation to work - Subway or elevated (%)
Means of transportation to work - Railroad (%)
Means of transportation to work - Ferryboat (%)
Means of transportation to work - Taxicab (%)
Means of transportation to work - Motorcycle (%)
Means of transportation to work - Bicycle (%)
Means of transportation to work - Walked (%)
Means of transportation to work - Other means (%)
Working at home (%)
Industry diversity
Most Common Industries - Agriculture, forestry, fishing and hunting, and mining (%)
Most Common Industries - Agriculture, forestry, fishing and hunting (%)
Most Common Industries - Mining, quarrying, and oil and gas extraction (%)
Most Common Industries - Construction (%)
Most Common Industries - Manufacturing (%)
Most Common Industries - Wholesale trade (%)
Most Common Industries - Retail trade (%)
Most Common Industries - Transportation and warehousing, and utilities (%)
Most Common Industries - Transportation and warehousing (%)
Most Common Industries - Utilities (%)
Most Common Industries - Information (%)
Most Common Industries - Finance and insurance, and real estate and rental and leasing (%)
Most Common Industries - Finance and insurance (%)
Most Common Industries - Real estate and rental and leasing (%)
Most Common Industries - Professional, scientific, and management, and administrative and waste management services (%)
Most Common Industries - Professional, scientific, and technical services (%)
Most Common Industries - Management of companies and enterprises (%)
Most Common Industries - Administrative and support and waste management services (%)
Most Common Industries - Educational services, and health care and social assistance (%)
Most Common Industries - Educational services (%)
Most Common Industries - Health care and social assistance (%)
Most Common Industries - Arts, entertainment, and recreation, and accommodation and food services (%)
Most Common Industries - Arts, entertainment, and recreation (%)
Most Common Industries - Accommodation and food services (%)
Most Common Industries - Other services, except public administration (%)
Most Common Industries - Public administration (%)
Occupation diversity
Most Common Occupations - Management, business, science, and arts occupations (%)
Most Common Occupations - Management, business, and financial occupations (%)
Most Common Occupations - Management occupations (%)
Most Common Occupations - Business and financial operations occupations (%)
Most Common Occupations - Computer, engineering, and science occupations (%)
Most Common Occupations - Computer and mathematical occupations (%)
Most Common Occupations - Architecture and engineering occupations (%)
Most Common Occupations - Life, physical, and social science occupations (%)
Most Common Occupations - Education, legal, community service, arts, and media occupations (%)
Most Common Occupations - Community and social service occupations (%)
Most Common Occupations - Legal occupations (%)
Most Common Occupations - Education, training, and library occupations (%)
Most Common Occupations - Arts, design, entertainment, sports, and media occupations (%)
Most Common Occupations - Healthcare practitioners and technical occupations (%)
Most Common Occupations - Health diagnosing and treating practitioners and other technical occupations (%)
Most Common Occupations - Health technologists and technicians (%)
Most Common Occupations - Service occupations (%)
Most Common Occupations - Healthcare support occupations (%)
Most Common Occupations - Protective service occupations (%)
Most Common Occupations - Fire fighting and prevention, and other protective service workers including supervisors (%)
Most Common Occupations - Law enforcement workers including supervisors (%)
Most Common Occupations - Food preparation and serving related occupations (%)
Most Common Occupations - Building and grounds cleaning and maintenance occupations (%)
Most Common Occupations - Personal care and service occupations (%)
Most Common Occupations - Sales and office occupations (%)
Most Common Occupations - Sales and related occupations (%)
Most Common Occupations - Office and administrative support occupations (%)
Most Common Occupations - Natural resources, construction, and maintenance occupations (%)
Most Common Occupations - Farming, fishing, and forestry occupations (%)
Most Common Occupations - Construction and extraction occupations (%)
Most Common Occupations - Installation, maintenance, and repair occupations (%)
Most Common Occupations - Production, transportation, and material moving occupations (%)
Most Common Occupations - Production occupations (%)
Most Common Occupations - Transportation occupations (%)
Most Common Occupations - Material moving occupations (%)
People in Group quarters - Institutionalized population (%)
People in Group quarters - Correctional institutions (%)
People in Group quarters - Federal prisons and detention centers (%)
People in Group quarters - Halfway houses (%)
People in Group quarters - Local jails and other confinement facilities (including police lockups) (%)
People in Group quarters - Military disciplinary barracks (%)
People in Group quarters - State prisons (%)
People in Group quarters - Other types of correctional institutions (%)
People in Group quarters - Nursing homes (%)
People in Group quarters - Hospitals/wards, hospices, and schools for the handicapped (%)
People in Group quarters - Hospitals/wards and hospices for chronically ill (%)
People in Group quarters - Hospices or homes for chronically ill (%)
People in Group quarters - Military hospitals or wards for chronically ill (%)
People in Group quarters - Other hospitals or wards for chronically ill (%)
People in Group quarters - Hospitals or wards for drug/alcohol abuse (%)
People in Group quarters - Mental (Psychiatric) hospitals or wards (%)
People in Group quarters - Schools, hospitals, or wards for the mentally retarded (%)
People in Group quarters - Schools, hospitals, or wards for the physically handicapped (%)
People in Group quarters - Institutions for the deaf (%)
People in Group quarters - Institutions for the blind (%)
People in Group quarters - Orthopedic wards and institutions for the physically handicapped (%)
People in Group quarters - Wards in general hospitals for patients who have no usual home elsewhere (%)
People in Group quarters - Wards in military hospitals for patients who have no usual home elsewhere (%)
People in Group quarters - Juvenile institutions (%)
People in Group quarters - Long-term care (%)
People in Group quarters - Homes for abused, dependent, and neglected children (%)
People in Group quarters - Residential treatment centers for emotionally disturbed children (%)
People in Group quarters - Training schools for juvenile delinquents (%)
People in Group quarters - Short-term care, detention or diagnostic centers for delinquent children (%)
People in Group quarters - Type of juvenile institution unknown (%)
People in Group quarters - Noninstitutionalized population (%)
People in Group quarters - College dormitories (includes college quarters off campus) (%)
People in Group quarters - Military quarters (%)
People in Group quarters - On base (%)
People in Group quarters - Barracks, unaccompanied personnel housing (UPH), (Enlisted/Officer), ;and similar group living quarters for military personnel (%)
People in Group quarters - Transient quarters for temporary residents (%)
People in Group quarters - Military ships (%)
People in Group quarters - Group homes (%)
People in Group quarters - Homes or halfway houses for drug/alcohol abuse (%)
People in Group quarters - Homes for the mentally ill (%)
People in Group quarters - Homes for the mentally retarded (%)
People in Group quarters - Homes for the physically handicapped (%)
People in Group quarters - Other group homes (%)
People in Group quarters - Religious group quarters (%)
People in Group quarters - Dormitories (%)
People in Group quarters - Agriculture workers' dormitories on farms (%)
People in Group quarters - Job Corps and vocational training facilities (%)
People in Group quarters - Other workers' dormitories (%)
People in Group quarters - Crews of maritime vessels (%)
People in Group quarters - Other nonhousehold living situations (%)
People in Group quarters - Other noninstitutional group quarters (%)
Residents speaking English at home (%)
Residents speaking English at home - Born in the United States (%)
Residents speaking English at home - Native, born elsewhere (%)
Residents speaking English at home - Foreign born (%)
Residents speaking Spanish at home (%)
Residents speaking Spanish at home - Born in the United States (%)
Residents speaking Spanish at home - Native, born elsewhere (%)
Residents speaking Spanish at home - Foreign born (%)
Residents speaking other language at home (%)
Residents speaking other language at home - Born in the United States (%)
Residents speaking other language at home - Native, born elsewhere (%)
Residents speaking other language at home - Foreign born (%)
Class of Workers - Employee of private company (%)
Class of Workers - Self-employed in own incorporated business (%)
Class of Workers - Private not-for-profit wage and salary workers (%)
Class of Workers - Local government workers (%)
Class of Workers - State government workers (%)
Class of Workers - Federal government workers (%)
Class of Workers - Self-employed workers in own not incorporated business and Unpaid family workers (%)
House heating fuel used in houses and condos - Utility gas (%)
House heating fuel used in houses and condos - Bottled, tank, or LP gas (%)
House heating fuel used in houses and condos - Electricity (%)
House heating fuel used in houses and condos - Fuel oil, kerosene, etc. (%)
House heating fuel used in houses and condos - Coal or coke (%)
House heating fuel used in houses and condos - Wood (%)
House heating fuel used in houses and condos - Solar energy (%)
House heating fuel used in houses and condos - Other fuel (%)
House heating fuel used in houses and condos - No fuel used (%)
House heating fuel used in apartments - Utility gas (%)
House heating fuel used in apartments - Bottled, tank, or LP gas (%)
House heating fuel used in apartments - Electricity (%)
House heating fuel used in apartments - Fuel oil, kerosene, etc. (%)
House heating fuel used in apartments - Coal or coke (%)
House heating fuel used in apartments - Wood (%)
House heating fuel used in apartments - Solar energy (%)
House heating fuel used in apartments - Other fuel (%)
House heating fuel used in apartments - No fuel used (%)
Armed forces status - In Armed Forces (%)
Armed forces status - Civilian (%)
Armed forces status - Civilian - Veteran (%)
Armed forces status - Civilian - Nonveteran (%)
Fatal accidents locations in years 2005-2021
Fatal accidents locations in 2005
Fatal accidents locations in 2006
Fatal accidents locations in 2007
Fatal accidents locations in 2008
Fatal accidents locations in 2009
Fatal accidents locations in 2010
Fatal accidents locations in 2011
Fatal accidents locations in 2012
Fatal accidents locations in 2013
Fatal accidents locations in 2014
Fatal accidents locations in 2015
Fatal accidents locations in 2016
Fatal accidents locations in 2017
Fatal accidents locations in 2018
Fatal accidents locations in 2019
Fatal accidents locations in 2020
Fatal accidents locations in 2021
Alcohol use - People drinking some alcohol every month (%)
Alcohol use - People not drinking at all (%)
Alcohol use - Average days/month drinking alcohol
Alcohol use - Average drinks/week
Alcohol use - Average days/year people drink much
Audiometry - Average condition of hearing (%)
Audiometry - People that can hear a whisper from across a quiet room (%)
Audiometry - People that can hear normal voice from across a quiet room (%)
Audiometry - Ears ringing, roaring, buzzing (%)
Audiometry - Had a job exposure to loud noise (%)
Audiometry - Had off-work exposure to loud noise (%)
Blood Pressure & Cholesterol - Has high blood pressure (%)
Blood Pressure & Cholesterol - Checking blood pressure at home (%)
Blood Pressure & Cholesterol - Frequently checking blood cholesterol (%)
Blood Pressure & Cholesterol - Has high cholesterol level (%)
Consumer Behavior - Money monthly spent on food at supermarket/grocery store
Consumer Behavior - Money monthly spent on food at other stores
Consumer Behavior - Money monthly spent on eating out
Consumer Behavior - Money monthly spent on carryout/delivered foods
Consumer Behavior - Income spent on food at supermarket/grocery store (%)
Consumer Behavior - Income spent on food at other stores (%)
Consumer Behavior - Income spent on eating out (%)
Consumer Behavior - Income spent on carryout/delivered foods (%)
Current Health Status - General health condition (%)
Current Health Status - Blood donors (%)
Current Health Status - Has blood ever tested for HIV virus (%)
Current Health Status - Left-handed people (%)
Dermatology - People using sunscreen (%)
Diabetes - Diabetics (%)
Diabetes - Had a blood test for high blood sugar (%)
Diabetes - People taking insulin (%)
Diet Behavior & Nutrition - Diet health (%)
Diet Behavior & Nutrition - Milk product consumption (# of products/month)
Diet Behavior & Nutrition - Meals not home prepared (#/week)
Diet Behavior & Nutrition - Meals from fast food or pizza place (#/week)
Diet Behavior & Nutrition - Ready-to-eat foods (#/month)
Diet Behavior & Nutrition - Frozen meals/pizza (#/month)
Drug Use - People that ever used marijuana or hashish (%)
Drug Use - Ever used hard drugs (%)
Drug Use - Ever used any form of cocaine (%)
Drug Use - Ever used heroin (%)
Drug Use - Ever used methamphetamine (%)
Health Insurance - People covered by health insurance (%)
Kidney Conditions-Urology - Avg. # of times urinating at night
Medical Conditions - People with asthma (%)
Medical Conditions - People with anemia (%)
Medical Conditions - People with psoriasis (%)
Medical Conditions - People with overweight (%)
Medical Conditions - Elderly people having difficulties in thinking or remembering (%)
Medical Conditions - People who ever received blood transfusion (%)
Medical Conditions - People having trouble seeing even with glass/contacts (%)
Medical Conditions - People with arthritis (%)
Medical Conditions - People with gout (%)
Medical Conditions - People with congestive heart failure (%)
Medical Conditions - People with coronary heart disease (%)
Medical Conditions - People with angina pectoris (%)
Medical Conditions - People who ever had heart attack (%)
Medical Conditions - People who ever had stroke (%)
Medical Conditions - People with emphysema (%)
Medical Conditions - People with thyroid problem (%)
Medical Conditions - People with chronic bronchitis (%)
Medical Conditions - People with any liver condition (%)
Medical Conditions - People who ever had cancer or malignancy (%)
Mental Health - People who have little interest in doing things (%)
Mental Health - People feeling down, depressed, or hopeless (%)
Mental Health - People who have trouble sleeping or sleeping too much (%)
Mental Health - People feeling tired or having little energy (%)
Mental Health - People with poor appetite or overeating (%)
Mental Health - People feeling bad about themself (%)
Mental Health - People who have trouble concentrating on things (%)
Mental Health - People moving or speaking slowly or too fast (%)
Mental Health - People having thoughts they would be better off dead (%)
Oral Health - Average years since last visit a dentist
Oral Health - People embarrassed because of mouth (%)
Oral Health - People with gum disease (%)
Oral Health - General health of teeth and gums (%)
Oral Health - Average days a week using dental floss/device
Oral Health - Average days a week using mouthwash for dental problem
Oral Health - Average number of teeth
Pesticide Use - Households using pesticides to control insects (%)
Pesticide Use - Households using pesticides to kill weeds (%)
Physical Activity - People doing vigorous-intensity work activities (%)
Physical Activity - People doing moderate-intensity work activities (%)
Physical Activity - People walking or bicycling (%)
Physical Activity - People doing vigorous-intensity recreational activities (%)
Physical Activity - People doing moderate-intensity recreational activities (%)
Physical Activity - Average hours a day doing sedentary activities
Physical Activity - Average hours a day watching TV or videos
Physical Activity - Average hours a day using computer
Physical Functioning - People having limitations keeping them from working (%)
Physical Functioning - People limited in amount of work they can do (%)
Physical Functioning - People that need special equipment to walk (%)
Physical Functioning - People experiencing confusion/memory problems (%)
Physical Functioning - People requiring special healthcare equipment (%)
Prescription Medications - Average number of prescription medicines taking
Preventive Aspirin Use - Adults 40+ taking low-dose aspirin (%)
Reproductive Health - Vaginal deliveries (%)
Reproductive Health - Cesarean deliveries (%)
Reproductive Health - Deliveries resulted in a live birth (%)
Reproductive Health - Pregnancies resulted in a delivery (%)
Reproductive Health - Women breastfeeding newborns (%)
Reproductive Health - Women that had a hysterectomy (%)
Reproductive Health - Women that had both ovaries removed (%)
Reproductive Health - Women that have ever taken birth control pills (%)
Reproductive Health - Women taking birth control pills (%)
Reproductive Health - Women that have ever used Depo-Provera or injectables (%)
Reproductive Health - Women that have ever used female hormones (%)
Sexual Behavior - People 18+ that ever had sex (vaginal, anal, or oral) (%)
Sexual Behavior - Males 18+ that ever had vaginal sex with a woman (%)
Sexual Behavior - Males 18+ that ever performed oral sex on a woman (%)
Sexual Behavior - Males 18+ that ever had anal sex with a woman (%)
Sexual Behavior - Males 18+ that ever had any sex with a man (%)
Sexual Behavior - Females 18+ that ever had vaginal sex with a man (%)
Sexual Behavior - Females 18+ that ever performed oral sex on a man (%)
Sexual Behavior - Females 18+ that ever had anal sex with a man (%)
Sexual Behavior - Females 18+ that ever had any kind of sex with a woman (%)
Sexual Behavior - Average age people first had sex
Sexual Behavior - Average number of female sex partners in lifetime (males 18+)
Sexual Behavior - Average number of female vaginal sex partners in lifetime (males 18+)
Sexual Behavior - Average age people first performed oral sex on a woman (18+)
Sexual Behavior - Average number of woman performed oral sex on in lifetime (18+)
Sexual Behavior - Average number of male sex partners in lifetime (males 18+)
Sexual Behavior - Average number of male anal sex partners in lifetime (males 18+)
Sexual Behavior - Average age people first performed oral sex on a man (18+)
Sexual Behavior - Average number of male oral sex partners in lifetime (18+)
Sexual Behavior - People using protection when performing oral sex (%)
Sexual Behavior - Average number of times people have vaginal or anal sex a year
Sexual Behavior - People having sex without condom (%)
Sexual Behavior - Average number of male sex partners in lifetime (females 18+)
Sexual Behavior - Average number of male vaginal sex partners in lifetime (females 18+)
Sexual Behavior - Average number of female sex partners in lifetime (females 18+)
Sexual Behavior - Circumcised males 18+ (%)
Sleep Disorders - Average hours sleeping at night
Sleep Disorders - People that has trouble sleeping (%)
Smoking-Cigarette Use - People smoking cigarettes (%)
Taste & Smell - People 40+ having problems with smell (%)
Taste & Smell - People 40+ having problems with taste (%)
Taste & Smell - People 40+ that ever had wisdom teeth removed (%)
Taste & Smell - People 40+ that ever had tonsils teeth removed (%)
Taste & Smell - People 40+ that ever had a loss of consciousness because of a head injury (%)
Taste & Smell - People 40+ that ever had a broken nose or other serious injury to face or skull (%)
Taste & Smell - People 40+ that ever had two or more sinus infections (%)
Weight - Average height (inches)
Weight - Average weight (pounds)
Weight - Average BMI
Weight - People that are obese (%)
Weight - People that ever were obese (%)
Weight - People trying to lose weight (%)
Urban population: 36,026
Rural population: 172
Estimated median house/condo value in 2022: $1,023,630
91326:
$1,023,630California:
$715,900
According to our research of California and other state lists, there were 8 registered sex offenders living in 91326 zip code as of May 04, 2024 . The ratio of all residents to sex offenders in zip code 91326 is 4,586 to 1.The ratio of registered sex offenders to all residents in this zip code is much lower than the state average.
Median resident age: This zip code:
44.8 yearsCalifornia median age:
37.9 years
Average household size: This zip code:
2.8 peopleCalifornia:
2.8 people
Averages for the 2020 tax year for zip code 91326, filed in 2021:
Average Adjusted Gross Income (AGI) in 2020: $122,025 (Individual Income Tax Returns) Here:
$122,025State:
$95,910
Salary/wage: $102,042 (reported on 75.8% of returns )Here:
$102,042State:
$77,331
(% of AGI for various income ranges: 1158.5% for AGIs below $25k , 3856.2% for AGIs $25k-50k , 7445.5% for AGIs $50k-75k , 11072.2% for AGIs $75k-100k , 22541.1% for AGIs $100k-200k , 91888.0% for AGIs over 200k ) Taxable interest for individuals: $2,597 (reported on 50.1% of returns )This zip code:
$2,597California:
$2,294
(% of AGI for various income ranges: 45.2% for AGIs below $25k , 78.4% for AGIs $25k-50k , 142.6% for AGIs $50k-75k , 224.4% for AGIs $75k-100k , 350.5% for AGIs $100k-200k , 1424.9% for AGIs over 200k ) Ordinary dividends: $5,919 (reported on 32.6% of returns )(% of AGI for various income ranges: 54.4% for AGIs below $25k , 87.2% for AGIs $25k-50k , 176.7% for AGIs $50k-75k , 282.7% for AGIs $75k-100k , 543.6% for AGIs $100k-200k , 2272.2% for AGIs over 200k ) Net capital gain/loss in AGI: +$25,017 (reported on 32.8% of returns )Here:
+$25,017State:
+$49,306
(% of AGI for various income ranges: 38.5% for AGIs below $25k , 78.3% for AGIs $25k-50k , 165.0% for AGIs $50k-75k , 299.8% for AGIs $75k-100k , 860.1% for AGIs $100k-200k , 16095.6% for AGIs over 200k ) Profit/loss from business: +$18,608 (reported on 22.8% of returns )Here:
+$18,608State:
+$15,671
(% of AGI for various income ranges: 225.2% for AGIs below $25k , 404.6% for AGIs $25k-50k , 561.9% for AGIs $50k-75k , 658.6% for AGIs $75k-100k , 1114.4% for AGIs $100k-200k , 4092.6% for AGIs over 200k ) Taxable individual retirement arrangement distribution: $23,815 (reported on 9.8% of returns )91326:
$23,815California:
$23,505
(% of AGI for various income ranges: 76.5% for AGIs below $25k , 151.0% for AGIs $25k-50k , 310.5% for AGIs $50k-75k , 544.0% for AGIs $75k-100k , 810.6% for AGIs $100k-200k , 1923.6% for AGIs over 200k ) Self-employed (Keogh) retirement plans: $30,720 (reported on 1.6% of returns )91326:
$30,720California:
$30,163
(% of AGI for various income ranges: 30.5% for AGIs $75k-100k , 72.5% for AGIs $100k-200k , 956.0% for AGIs over 200k ) Total itemized deductions: $38,692 (reported on 29.1% of returns )Here:
$38,692State:
$39,517
(% of AGI for various income ranges: 243.6% for AGIs below $25k , 479.7% for AGIs $25k-50k , 963.4% for AGIs $50k-75k , 1797.4% for AGIs $75k-100k , 3696.8% for AGIs $100k-200k , 12387.5% for AGIs over 200k ) Charity contributions: $7,077 (reported on 24.8% of returns )(% of AGI for various income ranges: 11.7% for AGIs below $25k , 37.1% for AGIs $25k-50k , 104.0% for AGIs $50k-75k , 248.1% for AGIs $75k-100k , 520.5% for AGIs $100k-200k , 2328.6% for AGIs over 200k ) Taxes paid: $9,372 (reported on 29.1% of returns )(% of AGI for various income ranges: 56.9% for AGIs below $25k , 119.9% for AGIs $25k-50k , 270.1% for AGIs $50k-75k , 515.5% for AGIs $75k-100k , 1041.9% for AGIs $100k-200k , 2515.1% for AGIs over 200k ) Earned income credit: $1,602 (reported on 7.1% of returns )(% of AGI for various income ranges: 50.4% for AGIs below $25k , 46.2% for AGIs $25k-50k , 0.7% for AGIs $50k-75k ) Percentage of individuals using paid preparers for their 2020 taxes: 92.8%(% for various income ranges: 91.9% for AGIs below $25k , 93.4% for AGIs $25k-50k , 92.3% for AGIs $50k-75k , 92.6% for AGIs $75k-100k , 92.8% for AGIs $100k-200k , 94.0% for AGIs over 200k )
Averages for the 2012 tax year for zip code 91326, filed in 2013:
Average Adjusted Gross Income (AGI) in 2012: $97,986 (Individual Income Tax Returns) Here:
$97,986State:
$72,726
Salary/wage: $81,949 (reported on 78.0% of returns )Here:
$81,949State:
$59,079
(% of AGI for various income ranges: 68.2% for AGIs below $25k , 68.7% for AGIs $25k-50k , 68.3% for AGIs $50k-75k , 66.7% for AGIs $75k-100k , 73.0% for AGIs $100k-200k , 57.7% for AGIs over 200k ) Taxable interest for individuals: $1,905 (reported on 53.3% of returns )This zip code:
$1,905California:
$2,146
(% of AGI for various income ranges: 2.5% for AGIs below $25k , 1.4% for AGIs $25k-50k , 1.3% for AGIs $50k-75k , 1.0% for AGIs $75k-100k , 0.9% for AGIs $100k-200k , 0.9% for AGIs over 200k ) Ordinary dividends: $5,565 (reported on 31.8% of returns )(% of AGI for various income ranges: 2.4% for AGIs below $25k , 1.5% for AGIs $25k-50k , 1.6% for AGIs $50k-75k , 1.7% for AGIs $75k-100k , 1.4% for AGIs $100k-200k , 2.2% for AGIs over 200k ) Net capital gain/loss in AGI: +$14,805 (reported on 29.3% of returns )Here:
+$14,805State:
+$30,460
(% of AGI for various income ranges: 0.3% for AGIs $50k-75k , 0.4% for AGIs $75k-100k , 1.0% for AGIs $100k-200k , 9.8% for AGIs over 200k ) Profit/loss from business: +$22,679 (reported on 23.2% of returns )Here:
+$22,679State:
+$17,064
(% of AGI for various income ranges: 15.9% for AGIs below $25k , 11.8% for AGIs $25k-50k , 7.2% for AGIs $50k-75k , 5.9% for AGIs $75k-100k , 4.6% for AGIs $100k-200k , 3.8% for AGIs over 200k ) Taxable individual retirement arrangement distribution: $21,292 (reported on 12.4% of returns )91326:
$21,292California:
$19,557
(% of AGI for various income ranges: 4.1% for AGIs below $25k , 3.0% for AGIs $25k-50k , 3.4% for AGIs $50k-75k , 3.5% for AGIs $75k-100k , 2.9% for AGIs $100k-200k , 2.1% for AGIs over 200k ) Self-employment retirement plans: $27,035 (reported on 2.0% of returns )91326:
$27,035California:
$24,530
(% of AGI for various income ranges: 0.4% for AGIs $25k-50k , 0.3% for AGIs $75k-100k , 0.3% for AGIs $100k-200k , 0.9% for AGIs over 200k ) Total itemized deductions: $36,998 (25% of AGI, reported on 55.7% of returns )Here:
$36,998State:
$34,004
Here:
24.5% of AGIState:
22.7% of AGI
(% of AGI for various income ranges: 22.2% for AGIs below $25k , 22.1% for AGIs $25k-50k , 23.2% for AGIs $50k-75k , 24.5% for AGIs $75k-100k , 23.2% for AGIs $100k-200k , 18.0% for AGIs over 200k ) Charity contributions: $4,284 (reported on 47.9% of returns )(% of AGI for various income ranges: 0.9% for AGIs below $25k , 1.6% for AGIs $25k-50k , 2.0% for AGIs $50k-75k , 2.2% for AGIs $75k-100k , 2.4% for AGIs $100k-200k , 2.0% for AGIs over 200k ) Taxes paid: $14,992 (reported on 55.6% of returns )91326:
$14,992State:
$14,448
(% of AGI for various income ranges: 5.1% for AGIs below $25k , 5.8% for AGIs $25k-50k , 6.9% for AGIs $50k-75k , 8.0% for AGIs $75k-100k , 9.1% for AGIs $100k-200k , 9.1% for AGIs over 200k ) Earned income credit: $1,674 (reported on 8.9% of returns )(% of AGI for various income ranges: 3.5% for AGIs below $25k , 0.6% for AGIs $25k-50k ) Percentage of individuals using paid preparers for their 2012 taxes: 70.0%(% for various income ranges: 65.0% for AGIs below $25k , 68.7% for AGIs $25k-50k , 72.1% for AGIs $50k-75k , 73.3% for AGIs $75k-100k , 71.5% for AGIs $100k-200k , 76.5% for AGIs over 200k )
Averages for the 2004 tax year for zip code 91326, filed in 2005:
Average Adjusted Gross Income (AGI) in 2004: $81,344 (Individual Income Tax Returns) Here:
$81,344State:
$58,600
Salary/wage: $72,291 (reported on 78.5% of returns )Here:
$72,291State:
$49,455
(% of AGI for various income ranges: 69.2% for AGIs $10k-25k , 69.9% for AGIs $25k-50k , 68.7% for AGIs $50k-75k , 69.5% for AGIs $75k-100k , 67.7% for AGIs over 100k ) Taxable interest for individuals: $2,476 (reported on 65.2% of returns )This zip code:
$2,476California:
$2,365
(% of AGI for various income ranges: 3.7% for AGIs $10k-25k , 2.9% for AGIs $25k-50k , 2.5% for AGIs $50k-75k , 1.9% for AGIs $75k-100k , 1.5% for AGIs over 100k ) Taxable dividends: $3,057 (reported on 39.1% of returns )(% of AGI for various income ranges: 2.6% for AGIs $10k-25k , 1.7% for AGIs $25k-50k , 1.3% for AGIs $50k-75k , 1.5% for AGIs $75k-100k , 1.3% for AGIs over 100k ) Net capital gain/loss: +$11,575 (reported on 36.6% of returns )Here:
+$11,575State:
+$23,418
(% of AGI for various income ranges: -0.1% for AGIs $10k-25k , 0.2% for AGIs $25k-50k , 0.4% for AGIs $50k-75k , 1.3% for AGIs $75k-100k , 7.3% for AGIs over 100k ) Profit/loss from business: +$25,955 (reported on 24.5% of returns )Here:
+$25,955State:
+$16,826
(% of AGI for various income ranges: 13.5% for AGIs $10k-25k , 13.0% for AGIs $25k-50k , 10.9% for AGIs $50k-75k , 9.0% for AGIs $75k-100k , 6.5% for AGIs over 100k ) IRA payment deduction: $3,960 (reported on 5.9% of returns )91326:
$3,960California:
$3,192
(% of AGI for various income ranges: 0.5% for AGIs $10k-25k , 0.5% for AGIs $25k-50k , 0.5% for AGIs $50k-75k , 0.4% for AGIs $75k-100k , 0.2% for AGIs over 100k ) Self-employed pension: $18,202 (reported on 3.1% of returns )Here:
$18,202California:
$17,688
(% of AGI for various income ranges: 0.3% for AGIs $25k-50k , 0.4% for AGIs $50k-75k , 0.6% for AGIs $75k-100k , 0.8% for AGIs over 100k ) Total itemized deductions: $32,442 (26% of AGI, reported on 59.3% of returns )Here:
$32,442State:
$28,113
Here:
26.2% of AGIState:
25.3% of AGI
(% of AGI for various income ranges: 24.1% for AGIs $10k-25k , 28.9% for AGIs $25k-50k , 28.5% for AGIs $50k-75k , 28.4% for AGIs $75k-100k , 21.0% for AGIs over 100k ) Charity contributions deductions: $4,030 (3% of AGI, reported on 53.3% of returns )Here:
3.1% of AGIState:
3.3% of AGI
(% of AGI for various income ranges: 1.7% for AGIs $10k-25k , 2.2% for AGIs $25k-50k , 2.8% for AGIs $50k-75k , 3.0% for AGIs $75k-100k , 2.6% for AGIs over 100k ) Total tax: $14,987 (reported on 83.2% of returns )91326:
$14,987State:
$10,761
(% of AGI for various income ranges: 5.7% for AGIs $10k-25k , 8.0% for AGIs $25k-50k , 9.5% for AGIs $50k-75k , 10.1% for AGIs $75k-100k , 18.0% for AGIs over 100k ) Earned income credit: $1,254 (reported on 6.7% of returns )Percentage of individuals using paid preparers for their 2004 taxes: 71.1%(% for various income ranges: 63.8% for AGIs below $10k , 68.3% for AGIs $10k-25k , 71.2% for AGIs $25k-50k , 74.0% for AGIs $50k-75k , 74.3% for AGIs $75k-100k , 74.5% for AGIs over 100k )
Estimated median household income in 2022: This zip code:
$141,622California:
$91,551
Nearest zip codes: 91324 ,
91330 ,
91311 ,
91344 ,
91325 ,
91306 .
Los Angeles Zip Code Map
Percentage of family households: This zip code:
47.5%California:
46.8%
Percentage of households with unmarried partners: This zip code:
3.4%California:
48.1%
No gay or lesbian households reported
Household received Food Stamps/SNAP in the past 12 months: 681Household did not receive Food Stamps/SNAP in the past 12 months: 12,055
Women who had a birth in the past 12 months: 291 (279 now married , 11 unmarried) Women who did not have a birth in the past 12 months: 7,447 (3,373 now married , 4,056 unmarried)
Housing units in zip code 91326 with a mortgage: 7,256 (830
second mortgage , 36
home equity loan , 804
both second mortgage and home equity loan )
Houses without a mortgage: 64
Median monthly owner costs for units with a mortgage: $3,839
Median monthly owner costs for units without a mortgage: $1,295
Residents with income below the poverty level in 2022:
This zip code:
6.4%Whole state:
12.2%
Residents with income below 50% of the poverty level in 2022:
This zip code:
4.0%Whole state:
6.2%
Median number of rooms in houses and condos: Median number of rooms in apartments:
Year house built (houses)
299 2020 or later1,643 2010 to 20192,459 2000 to 2009883 1990 to 19991,692 1980 to 19892,834 1970 to 19792,682 1960 to 19691,044 1950 to 195978 1940 to 194944 1939 or earlier
Zip code 91326 household income distribution in 2022 277 Less than $10,000358 $10,000 to $14,999326 $15,000 to $19,999233 $20,000 to $24,999294 $25,000 to $29,999182 $30,000 to $34,999121 $35,000 to $39,999272 $40,000 to $44,999216 $45,000 to $49,999697 $50,000 to $59,999714 $60,000 to $74,999969 $75,000 to $99,9991,076 $100,000 to $124,999969 $125,000 to $149,9991,841 $150,000 to $199,9994,384 $200,000 or moreEstimate of home value of owner-occupied houses/condos in 2022 in zip code 91326 141 Less than $10,0005 $50,000 to $59,9994 $70,000 to $79,9998 $80,000 to $89,99931 $100,000 to $124,9993 $125,000 to $149,9996 $250,000 to $299,99946 $300,000 to $399,999129 $400,000 to $499,9991,128 $500,000 to $749,9994,902 $750,000 to $999,9992,939 $1,000,000 to $1,499,999998 $1,500,000 to $1,999,999397 $2,000,000 or moreRent paid by renters in 2022 in zip code 91326 23 Less than $10021 $600 to $649109 $750 to $79914 $900 to $999156 $1,000 to $1,249360 $1,250 to $1,499454 $1,500 to $1,999348 $2,000 to $2,499341 $2,500 to $2,999314 $3,000 to $3,499786 $3,500 or more222 No cash rent
Median gross rent in 2022: $2,626.
Median price asked for vacant for-sale houses and condos in 2022: $1,299,324.
Estimated median house (or condo) value in 2022 for: White Non-Hispanic householders: $1,025,129Black or African American householders: $1,036,226American Indian or Alaska Native householders: $740,504Asian householders: $1,026,628Native Hawaiian and other Pacific Islander householders: $543,756Some other race householders: $882,366Two or more races householders: $1,092,911Hispanic or Latino householders: $1,030,527Estimated median house or condo value in 2022: $1,023,630
91326:
$1,023,630California:
$715,900
Lower value quartile - upper value quartile: $890,969 - $1,296,776
Mean price in 2022: Detached houses: $1,324,769Here:
$1,324,769State:
$988,808
Townhouses or other attached units: $832,477Here:
$832,477State:
$838,546
In 2-unit structures: $1,127,961Here:
$1,127,961State:
$1,138,100
In 3-to-4-unit structures: $930,211Here:
$930,211State:
$824,253
In 5-or-more-unit structures: $784,826Here:
$784,826State:
$730,996
Mobile homes: $255,082Here:
$255,082State:
$184,506
Occupied boats, RVs, vans, etc.: $63,014Here:
$63,014State:
$204,957
Housing units in structures:
One, detached: 10,756One, attached: 1,066Two: 303 or 4: 125 to 9: 4210 to 19: 10820 to 49: 33150 or more: 1,298Unemployment : 3.2%
Means of transportation to work in zip code 91326 68.0% 12,406 Drove a car alone6.9% 1,266 Carpooled0.0% 7 Bus or trolley bus0.0% 8 Streetcar or trolley car0.0% 5 Railroad0.1% 20 Taxi0.0% 9 Bicycle0.5% 92 Walked1.2% 211 Other means25.6% 4,673 Worked at homeTravel time to work (commute) in zip code 91326 242 Less than 5 minutes716 5 to 9 minutes1,006 10 to 14 minutes1,594 15 to 19 minutes1,664 20 to 24 minutes993 25 to 29 minutes2,600 30 to 34 minutes475 35 to 39 minutes798 40 to 44 minutes1,509 45 to 59 minutes1,828 60 to 89 minutes522 90 or more minutes
Neighborhoods in zip code 91326: Percentage of zip code residents living and working in this county: 96.5%
Household type by relationship:
Households: 36,199
Male householders: 7,566 (1,055 living alone ), Female householders: 5,359 (1,405 living alone )8,059 spouses (7,996 opposite-sex spouses ), 798 unmarried partners , (798 opposite-sex unmarried partners ), 11,031 children (10,614 natural , 157 adopted , 262 stepchildren ), 511 grandchildren , 337 brothers or sisters , 1,288 parents , 0 foster children , 578 other relatives , 607 non-relatives In group quarters: 97 (-1 institutionalized population )
Size of family households: 3,788 2-persons , 2,525 3-persons , 2,257 4-persons , 887 5-persons , 271 6-persons , 104 7-or-more-persons
Size of nonfamily households: 2,461 1-person , 470 2-persons , 61 3-persons , 62 4-persons , 15 7-or-more-persons
5,365 married couples with children. single-parent households (473 men , 833 women ).
53.3% of residents of 91326 zip code speak English at home. of residents speak Spanish at home (74% very well, 18% well, 6% not well, 1% not at all ).of residents speak other Indo-European language at home (73% very well, 16% well, 10% not well, 1% not at all ).of residents speak Asian or Pacific Island language at home (64% very well, 27% well, 9% not well ).of residents speak other language at home (74% very well, 14% well, 13% not well ).
Foreign born population: 13,518 (37.3%)
(82.8%
of them are naturalized citizens )
This zip code:
37.3%Whole state:
26.7%
14% Japan 12% Malaysia 9% Bhutan 8% India 4% Honduras 3% Kuwait 3% Singapore 11% Armenian 3% American 2% Iranian 2% German 2% Russian 2% English 2% Italian
Year of entry for the foreign-born population
1,969 2010 or later 2,312 2000 to 2009 2,877 1990 to 1999 6,818 Before 1990
Facilities with environmental interests located in this zip code:
FACEY MEDICAL GROUP INC (11145 TAMPA AVE STE 8B 12B in NORTHRIDGE, CA)
STATE MASTER (California - Hazardous Waste Tracking) - HAZARDOU WASTE PROGRAM Small Quantity Generators, between 100 kg and 1000 kg of hazardous waste/month (Resource Conservation and Recovery Act (tracking hazardous waste)) - notification Alternative names: FACEY MEDICAL FOUNDATION
FIRE STATION 28 (11641 CORBIN AVE in NORTHRIDGE, CA)
STATE MASTER (California - Hazardous Waste Tracking) - HAZARDOU WASTE PROGRAM Small Quantity Generators, between 100 kg and 1000 kg of hazardous waste/month (Resource Conservation and Recovery Act (tracking hazardous waste)) - notification Organizations: CITY OF L A (CONTACT/OWNER)
Alternative names: CITY OF LA GENERAL SERVICES
KIRK DOUGLAS CONTINUATION (10500 LINDLEY AVE. in NORTHRIDGE, CA)
(National Center for Education Statistics) - STATE ID-1931583 Organizations: LOS ANGELES UNIFIED (SCHOOL DISTRICT)
CASTLEBAY LANE ELEMENTARY (19010 CASTLEBAY LANE in NORTHRIDGE, CA)
(National Center for Education Statistics) - STATE ID-6071435 Organizations: LOS ANGELES UNIFIED (SCHOOL DISTRICT)
LAUSD--BECKFORD AVE. ELEM (19130 TULSA ST. in NORTHRIDGE, CA)
Large Quantity Generators, more that 1000 kg of hazardous waste/month (Resource Conservation and Recovery Act (tracking hazardous waste)) Alternative names: BECKFORD AVENUE ELEMENTARY
Housing units lacking complete plumbing facilities: 0.3%
Housing units lacking complete kitchen facilities: 1.7%
79.4% Utility gas 17.8% Electricity 1.1% Solar energy 0.7% No fuel used 0.7% Bottled, tank, or LP gas
Population in 1990: 23,466. Population change in the 1990s: +4,583 (+19.5%).
Place of birth for U.S.-born residents:
This state: 17,303Northeast: 1,479Midwest: 1,323South: 1,073West: 803
61% of the 91326 zip code residents lived in the same house 5 years ago.
Out of people who lived in different houses, 88% lived in this county.
Out of people who lived in different counties, 50% lived in California.
92% of the 91326 zip code residents lived in the same house 1 year ago.
Out of people who lived in different houses, 68% moved from this county.
Out of people who lived in different houses, 15% moved from different county within same state.
Out of people who lived in different houses, 6% moved from different state.
Out of people who lived in different houses, 13% moved from abroad.
Private vs. public school enrollment:
Students in private schools in grades 1 to 8 (elementary and middle school): 572
Here:
17.6%California:
10.5%
Students in private schools in grades 9 to 12 (high school): 545
Here:
27.7%California:
8.5%
Students in private undergraduate colleges: 276
Here:
16.7%California:
15.9%
Occupation by median earnings in the past 12 months ($)
129,051 Life, physical, and social science occupations 121,710 Architecture and engineering occupations 114,517 Health diagnosing and treating practitioners and other technical occupations 113,008 Management occupations 111,216 Legal occupations 107,825 Computer and mathematical occupations
Companies with federal contracts located in this zip code:
SUMA PAINTING CO., INC. (19360 RINALDI STREET, #122 in NORTHRIDGE, CA; small business) in 11 contracts from 1999 to 2000
Contracts for Maintenance, Repair or Alteration of Real Property -- Miscellaneous Buildings by NavySigned by year: 2000: $4,175; 2001: $0; 2002: $0; 2003: $0; 2004: $0; 2005: $0; 2006: $0.
Biggest contracts: with Navy for Maintenance, Repair or Alteration of Real Property -- Miscellaneous Buildings. Signed on 2000-02-22. Completion date: 2000-06-30.
, same as above. Signed on 1999-12-28. Completion date: 2000-01-24.
, same as above. Signed on 1999-12-28. Completion date: 2000-01-20.
, same as above. Signed on 1999-10-21. Completion date: 1999-08-27.
PREMIUM DATA PRODUCTS INC (19360 RINALDI ST STE 422 in NORTHRIDGE, CA; small business)
$5,798 with Navy for ADP Support Equipment. Signed on 2005-09-22. Completion date: 2005-10-06.
Top industries in this zip code by the number of employees in 2005:
Accommodation and Food Services: Full-Service Restaurants (100-249 employees: 2 establishments, 50-99 employees: 1 establishment, 20-49 employees: 3 establishments, 10-19 employees: 1 establishment, 5-9 employees: 4 establishments)Administrative and Support and Waste Management and Remediation Services: Office Administrative Services (250-499: 1, 10-19: 1, 1-4: 11)Other Services (except Public Administration): Civic and Social Organizations (250-499: 1)Accommodation and Food Services: Limited-Service Restaurants (50-99: 1, 20-49: 3, 10-19: 7, 5-9: 4, 1-4: 1)Other Services (except Public Administration): Religious Organizations (50-99: 3, 10-19: 1, 5-9: 2, 1-4: 6)Arts, Entertainment, and Recreation: Golf Courses and Country Clubs (100-249: 1)Real Estate and Rental and Leasing: Offices of Real Estate Agents and Brokers (50-99: 1, 10-19: 1, 5-9: 1, 1-4: 19)
People in group quarters in 2010:
25 people in workers' group living quarters and job corps centers
13 people in nursing facilities/skilled-nursing facilities
11 people in group homes intended for adults
6 people in group homes for juveniles (non-correctional)
6 people in residential treatment centers for adults
People in group quarters in 2000:
70 people in other noninstitutional group quarters
11 people in homes for the mentally retarded
6 people in mental (psychiatric) hospitals or wards
Fatal accident statistics in 2014:
Fatal accident count: 1Vehicles involved in fatal accidents: 1Fatal accidents caused by drunken drivers: 0Fatalities: 1Persons involved in fatal accidents: 1Pedestrians involved in fatal accidents: 0
Fatal accident statistics in 2012:
Fatal accident count: 1Vehicles involved in fatal accidents: 1Fatal accidents caused by drunken drivers: 1Fatalities: 1Persons involved in fatal accidents: 2Pedestrians involved in fatal accidents: 0
Home Mortgage Disclosure Act Aggregated Statistics For Year 2009(Based on 6 full and 8 partial tracts) A) FHA, FSA/RHS & VA B) Conventional C) Refinancings D) Home Improvement Loans F) Non-occupant Loans on G) Loans On Manufactured Number Average Value Number Average Value Number Average Value Number Average Value Number Average Value Number Average Value
LOANS ORIGINATED 98 $443,410 533 $418,099 1,697 $343,285 59 $236,817 60 $313,735 0 $0 APPLICATIONS APPROVED, NOT ACCEPTED 13 $410,397 80 $446,413 211 $372,631 13 $180,502 14 $289,976 0 $0 APPLICATIONS DENIED 39 $434,223 140 $431,668 566 $378,372 18 $121,314 28 $302,835 1 $35,000 APPLICATIONS WITHDRAWN 17 $486,372 104 $439,996 291 $406,274 20 $292,140 20 $262,067 0 $0 FILES CLOSED FOR INCOMPLETENESS 7 $380,396 27 $454,314 119 $397,836 3 $204,380 4 $263,140 0 $0
Aggregated Statistics For Year 2008(Based on 6 full and 8 partial tracts) A) FHA, FSA/RHS & VA B) Conventional C) Refinancings D) Home Improvement Loans E) Loans on Dwellings For 5+ Families F) Non-occupant Loans on G) Loans On Manufactured Number Average Value Number Average Value Number Average Value Number Average Value Number Average Value Number Average Value Number Average Value
LOANS ORIGINATED 29 $520,978 604 $433,416 580 $367,550 62 $203,570 3 $28,771,833 68 $315,237 0 $0 APPLICATIONS APPROVED, NOT ACCEPTED 2 $345,290 144 $478,971 156 $396,147 9 $184,021 0 $0 10 $281,209 5 $133,162 APPLICATIONS DENIED 21 $545,095 184 $483,616 374 $482,692 28 $248,849 0 $0 27 $415,561 0 $0 APPLICATIONS WITHDRAWN 12 $557,461 153 $447,858 177 $384,752 13 $276,988 0 $0 14 $378,845 0 $0 FILES CLOSED FOR INCOMPLETENESS 2 $472,545 38 $484,838 49 $466,993 5 $176,500 0 $0 8 $432,159 0 $0
Aggregated Statistics For Year 2007(Based on 6 full and 8 partial tracts) A) FHA, FSA/RHS & VA B) Conventional C) Refinancings D) Home Improvement Loans E) Loans on Dwellings For 5+ Families F) Non-occupant Loans on G) Loans On Manufactured Number Average Value Number Average Value Number Average Value Number Average Value Number Average Value Number Average Value Number Average Value
LOANS ORIGINATED 1 $431,580 782 $495,630 1,202 $461,718 144 $269,607 2 $5,200,640 95 $423,173 0 $0 APPLICATIONS APPROVED, NOT ACCEPTED 0 $0 218 $511,785 294 $474,722 28 $258,986 0 $0 31 $468,884 4 $60,205 APPLICATIONS DENIED 0 $0 314 $490,409 685 $532,293 67 $347,741 0 $0 61 $548,157 0 $0 APPLICATIONS WITHDRAWN 0 $0 159 $559,405 287 $531,208 24 $352,269 0 $0 14 $692,605 0 $0 FILES CLOSED FOR INCOMPLETENESS 0 $0 40 $534,692 119 $483,760 9 $273,937 0 $0 3 $184,193 0 $0
Aggregated Statistics For Year 2006(Based on 6 full and 8 partial tracts) B) Conventional C) Refinancings D) Home Improvement Loans E) Loans on Dwellings For 5+ Families F) Non-occupant Loans on Number Average Value Number Average Value Number Average Value Number Average Value Number Average Value
LOANS ORIGINATED 1,318 $501,229 1,563 $473,263 211 $341,980 1 $1,102,650 123 $422,347 APPLICATIONS APPROVED, NOT ACCEPTED 262 $501,042 328 $488,470 35 $296,097 0 $0 21 $414,802 APPLICATIONS DENIED 521 $514,268 738 $546,457 111 $309,829 0 $0 59 $430,570 APPLICATIONS WITHDRAWN 268 $556,779 508 $521,190 43 $279,758 0 $0 22 $417,740 FILES CLOSED FOR INCOMPLETENESS 59 $500,387 133 $486,280 11 $206,110 0 $0 5 $894,210
Aggregated Statistics For Year 2005(Based on 6 full and 8 partial tracts) B) Conventional C) Refinancings D) Home Improvement Loans E) Loans on Dwellings For 5+ Families F) Non-occupant Loans on G) Loans On Manufactured Number Average Value Number Average Value Number Average Value Number Average Value Number Average Value Number Average Value
LOANS ORIGINATED 1,531 $486,251 2,059 $436,704 240 $301,832 1 $1,712,590 154 $396,386 1 $143,860 APPLICATIONS APPROVED, NOT ACCEPTED 254 $445,494 336 $416,845 39 $282,070 0 $0 23 $389,499 4 $83,698 APPLICATIONS DENIED 444 $469,999 721 $471,816 161 $282,266 0 $0 45 $402,745 3 $59,940 APPLICATIONS WITHDRAWN 348 $456,388 577 $426,609 83 $281,835 0 $0 45 $413,284 1 $575,440 FILES CLOSED FOR INCOMPLETENESS 62 $560,752 152 $444,067 20 $194,304 0 $0 4 $429,528 0 $0
Aggregated Statistics For Year 2004(Based on 6 full and 8 partial tracts) B) Conventional C) Refinancings D) Home Improvement Loans E) Loans on Dwellings For 5+ Families F) Non-occupant Loans on G) Loans On Manufactured Number Average Value Number Average Value Number Average Value Number Average Value Number Average Value Number Average Value
LOANS ORIGINATED 1,610 $426,182 2,577 $360,926 178 $266,704 2 $3,317,465 139 $331,423 3 $299,740 APPLICATIONS APPROVED, NOT ACCEPTED 308 $400,077 512 $373,580 33 $158,386 0 $0 19 $453,463 0 $0 APPLICATIONS DENIED 443 $423,579 636 $403,639 94 $152,961 0 $0 49 $406,110 0 $0 APPLICATIONS WITHDRAWN 256 $438,590 531 $352,740 56 $216,970 0 $0 24 $360,408 2 $23,580 FILES CLOSED FOR INCOMPLETENESS 76 $368,735 219 $384,748 20 $129,864 0 $0 9 $261,920 0 $0
Aggregated Statistics For Year 2003(Based on 6 full and 8 partial tracts) A) FHA, FSA/RHS & VA B) Conventional C) Refinancings D) Home Improvement Loans E) Loans on Dwellings For 5+ Families F) Non-occupant Loans on Number Average Value Number Average Value Number Average Value Number Average Value Number Average Value Number Average Value
LOANS ORIGINATED 2 $228,905 1,403 $355,623 6,129 $278,446 81 $99,530 4 $1,564,072 176 $227,876 APPLICATIONS APPROVED, NOT ACCEPTED 0 $0 277 $356,354 956 $289,826 33 $147,318 0 $0 47 $291,392 APPLICATIONS DENIED 0 $0 306 $353,654 947 $315,934 57 $87,062 0 $0 57 $270,635 APPLICATIONS WITHDRAWN 0 $0 234 $326,750 999 $293,551 21 $205,963 0 $0 21 $253,549 FILES CLOSED FOR INCOMPLETENESS 0 $0 75 $376,925 253 $305,055 2 $376,345 0 $0 21 $261,382
Aggregated Statistics For Year 2002(Based on 6 full and 8 partial tracts) A) FHA, FSA/RHS & VA B) Conventional C) Refinancings D) Home Improvement Loans E) Loans on Dwellings For 5+ Families F) Non-occupant Loans on Number Average Value Number Average Value Number Average Value Number Average Value Number Average Value Number Average Value
LOANS ORIGINATED 3 $199,930 1,194 $304,754 4,148 $268,167 72 $101,628 1 $519,890 144 $198,293 APPLICATIONS APPROVED, NOT ACCEPTED 0 $0 148 $339,131 693 $266,946 26 $87,388 0 $0 19 $203,380 APPLICATIONS DENIED 0 $0 245 $307,327 732 $274,694 39 $82,062 0 $0 29 $216,206 APPLICATIONS WITHDRAWN 2 $226,640 145 $266,055 707 $274,476 17 $93,724 0 $0 27 $176,499 FILES CLOSED FOR INCOMPLETENESS 0 $0 46 $303,583 170 $279,336 1 $34,990 0 $0 3 $250,450
Aggregated Statistics For Year 2001(Based on 6 full and 8 partial tracts) A) FHA, FSA/RHS & VA B) Conventional C) Refinancings D) Home Improvement Loans F) Non-occupant Loans on Number Average Value Number Average Value Number Average Value Number Average Value Number Average Value
LOANS ORIGINATED 64 $219,660 1,094 $267,586 2,432 $235,414 112 $47,218 72 $200,793 APPLICATIONS APPROVED, NOT ACCEPTED 7 $235,657 120 $255,302 448 $233,395 16 $48,832 26 $180,431 APPLICATIONS DENIED 9 $197,471 209 $268,016 646 $246,805 81 $56,688 26 $173,412 APPLICATIONS WITHDRAWN 3 $161,597 162 $274,500 566 $217,849 53 $52,148 31 $189,214 FILES CLOSED FOR INCOMPLETENESS 8 $169,208 39 $281,096 153 $249,426 2 $23,055 3 $135,707
Aggregated Statistics For Year 2000(Based on 6 full and 8 partial tracts) A) FHA, FSA/RHS & VA B) Conventional C) Refinancings D) Home Improvement Loans F) Non-occupant Loans on Number Average Value Number Average Value Number Average Value Number Average Value Number Average Value
LOANS ORIGINATED 27 $161,931 1,000 $239,878 615 $205,405 97 $58,833 44 $192,970 APPLICATIONS APPROVED, NOT ACCEPTED 0 $0 154 $261,737 178 $251,925 55 $38,253 12 $220,921 APPLICATIONS DENIED 4 $177,308 276 $254,294 319 $216,764 65 $63,824 18 $159,298 APPLICATIONS WITHDRAWN 4 $173,412 122 $254,683 224 $187,168 29 $42,296 7 $221,373 FILES CLOSED FOR INCOMPLETENESS 1 $171,190 41 $302,043 59 $236,802 0 $0 2 $324,690
Aggregated Statistics For Year 1999(Based on 4 full and 5 partial tracts) A) FHA, FSA/RHS & VA B) Conventional C) Refinancings D) Home Improvement Loans E) Loans on Dwellings For 5+ Families F) Non-occupant Loans on Number Average Value Number Average Value Number Average Value Number Average Value Number Average Value Number Average Value
LOANS ORIGINATED 8 $143,686 663 $235,892 854 $211,489 74 $45,832 2 $7,403,950 41 $164,639 APPLICATIONS APPROVED, NOT ACCEPTED 0 $0 93 $230,230 173 $211,798 25 $51,082 0 $0 7 $204,680 APPLICATIONS DENIED 4 $187,268 161 $257,147 341 $210,221 29 $55,596 0 $0 16 $207,590 APPLICATIONS WITHDRAWN 0 $0 122 $241,948 234 $199,562 8 $34,516 1 $315,510 7 $172,673 FILES CLOSED FOR INCOMPLETENESS 0 $0 43 $239,425 83 $207,847 2 $35,230 0 $0 2 $200,445
Private Mortgage Insurance Companies Aggregated Statistics For Year 2009(Based on 4 full and 8 partial tracts) A) Conventional B) Refinancings Number Average Value Number Average Value
LOANS ORIGINATED 42 $395,318 11 $376,769 APPLICATIONS APPROVED, NOT ACCEPTED 22 $430,661 4 $450,882 APPLICATIONS DENIED 11 $500,067 7 $540,231 APPLICATIONS WITHDRAWN 1 $640,000 2 $499,950 FILES CLOSED FOR INCOMPLETENESS 3 $407,603 0 $0
Aggregated Statistics For Year 2008(Based on 6 full and 8 partial tracts) A) Conventional B) Refinancings Number Average Value Number Average Value
LOANS ORIGINATED 90 $447,069 2 $445,565 APPLICATIONS APPROVED, NOT ACCEPTED 20 $492,456 4 $548,902 APPLICATIONS DENIED 25 $483,784 6 $531,278 APPLICATIONS WITHDRAWN 5 $581,420 2 $384,250 FILES CLOSED FOR INCOMPLETENESS 2 $476,740 0 $0
Aggregated Statistics For Year 2007(Based on 2 full and 8 partial tracts) A) Conventional B) Refinancings Number Average Value Number Average Value
LOANS ORIGINATED 8 $465,419 4 $543,768 APPLICATIONS APPROVED, NOT ACCEPTED 3 $610,453 3 $567,893 APPLICATIONS DENIED 2 $408,840 0 $0 APPLICATIONS WITHDRAWN 0 $0 2 $970,615 FILES CLOSED FOR INCOMPLETENESS 0 $0 0 $0
Aggregated Statistics For Year 2006(Based on 2 full and 6 partial tracts) A) Conventional B) Refinancings C) Non-occupant Loans on Number Average Value Number Average Value Number Average Value
LOANS ORIGINATED 9 $506,103 7 $436,777 1 $555,300 APPLICATIONS APPROVED, NOT ACCEPTED 0 $0 4 $576,598 0 $0 APPLICATIONS DENIED 11 $613,252 2 $403,690 6 $542,340 APPLICATIONS WITHDRAWN 2 $581,955 2 $471,600 0 $0 FILES CLOSED FOR INCOMPLETENESS 0 $0 0 $0 0 $0
Aggregated Statistics For Year 2005(Based on 4 full and 8 partial tracts) A) Conventional B) Refinancings C) Non-occupant Loans on Number Average Value Number Average Value Number Average Value
LOANS ORIGINATED 11 $528,008 6 $335,253 1 $679,020 APPLICATIONS APPROVED, NOT ACCEPTED 4 $527,398 1 $367,000 0 $0 APPLICATIONS DENIED 0 $0 0 $0 0 $0 APPLICATIONS WITHDRAWN 4 $417,838 0 $0 0 $0 FILES CLOSED FOR INCOMPLETENESS 0 $0 0 $0 0 $0
Aggregated Statistics For Year 2004(Based on 4 full and 8 partial tracts) A) Conventional B) Refinancings Number Average Value Number Average Value
LOANS ORIGINATED 18 $403,362 7 $435,067 APPLICATIONS APPROVED, NOT ACCEPTED 5 $461,782 4 $352,315 APPLICATIONS DENIED 0 $0 0 $0 APPLICATIONS WITHDRAWN 3 $408,397 0 $0 FILES CLOSED FOR INCOMPLETENESS 0 $0 3 $707,020
Aggregated Statistics For Year 2003(Based on 6 full and 8 partial tracts) A) Conventional B) Refinancings C) Non-occupant Loans on Number Average Value Number Average Value Number Average Value
LOANS ORIGINATED 42 $353,264 15 $284,374 4 $271,835 APPLICATIONS APPROVED, NOT ACCEPTED 14 $281,837 24 $346,610 6 $322,795 APPLICATIONS DENIED 5 $613,936 0 $0 0 $0 APPLICATIONS WITHDRAWN 2 $430,100 3 $403,207 2 $430,100 FILES CLOSED FOR INCOMPLETENESS 0 $0 0 $0 0 $0
Aggregated Statistics For Year 2002(Based on 6 full and 8 partial tracts) A) Conventional B) Refinancings C) Non-occupant Loans on Number Average Value Number Average Value Number Average Value
LOANS ORIGINATED 92 $302,267 47 $321,234 2 $234,100 APPLICATIONS APPROVED, NOT ACCEPTED 23 $334,233 27 $328,493 0 $0 APPLICATIONS DENIED 0 $0 1 $223,250 0 $0 APPLICATIONS WITHDRAWN 9 $368,826 1 $144,410 2 $389,885 FILES CLOSED FOR INCOMPLETENESS 1 $188,460 1 $101,600 0 $0
Aggregated Statistics For Year 2001(Based on 6 full and 8 partial tracts) A) Conventional B) Refinancings C) Non-occupant Loans on Number Average Value Number Average Value Number Average Value
LOANS ORIGINATED 118 $295,046 40 $313,582 4 $200,972 APPLICATIONS APPROVED, NOT ACCEPTED 47 $299,655 16 $337,709 0 $0 APPLICATIONS DENIED 7 $296,217 7 $374,221 0 $0 APPLICATIONS WITHDRAWN 6 $221,543 3 $254,153 0 $0 FILES CLOSED FOR INCOMPLETENESS 0 $0 0 $0 0 $0
Aggregated Statistics For Year 2000(Based on 6 full and 8 partial tracts) A) Conventional B) Refinancings C) Non-occupant Loans on Number Average Value Number Average Value Number Average Value
LOANS ORIGINATED 116 $278,105 27 $280,914 7 $203,626 APPLICATIONS APPROVED, NOT ACCEPTED 43 $283,718 6 $291,832 0 $0 APPLICATIONS DENIED 16 $265,314 4 $223,218 0 $0 APPLICATIONS WITHDRAWN 8 $368,874 1 $414,320 0 $0 FILES CLOSED FOR INCOMPLETENESS 5 $234,542 0 $0 0 $0
Aggregated Statistics For Year 1999(Based on 4 full and 5 partial tracts) A) Conventional B) Refinancings Number Average Value Number Average Value
LOANS ORIGINATED 115 $258,391 37 $268,660 APPLICATIONS APPROVED, NOT ACCEPTED 20 $257,555 14 $255,129 APPLICATIONS DENIED 11 $303,589 5 $313,336 APPLICATIONS WITHDRAWN 2 $236,970 5 $283,364 FILES CLOSED FOR INCOMPLETENESS 1 $163,700 2 $337,200
2005 - 2018 National Fire Incident Reporting System (NFIRS) incidents See full 2006 National Fire Incident Reporting System statistics for zip code 91326, California
Most common first names in zip code 91326 among deceased individuals Name Count Lived (average)
John 67 75.4 years Robert 64 70.3 years Mary 62 81.3 years William 44 75.0 years James 36 69.3 years George 36 73.5 years Joseph 35 80.6 years Margaret 34 83.6 years Ruth 31 84.4 years Charles 29 71.9 years
Most common last names in zip code 91326 among deceased individuals Last name Count Lived (average)
Smith 23 81.6 years Lee 17 77.9 years Johnson 12 76.1 years Brown 12 79.2 years Williams 10 85.3 years Miller 10 74.7 years Phillips 9 78.9 years Anderson 9 75.6 years Adams 9 76.9 years Davis 9 75.9 years
Businesses in zip code 91326
Name Count Name Count
7-Eleven 2 Nike 4 Bath & Body Works 1 Starbucks 1 CVS 1 Subway 3 Famous Footwear 1 T-Mobile 1 FedEx 2 T.G.I. Driday's 1 GNC 1 Toys"R"Us 1 Jack In The Box 1 UPS 1 Jones New York 1 Verizon Wireless 1 Kroger 1 Walmart 1 McDonald's 2 Whole Foods Market 1 New Balance 1 YMCA 1

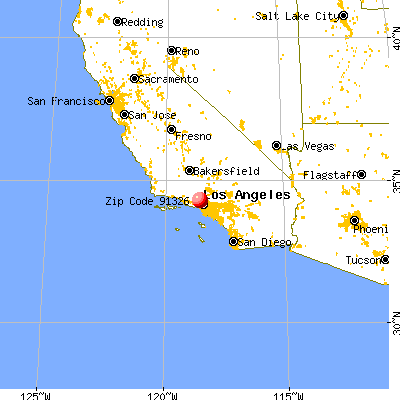


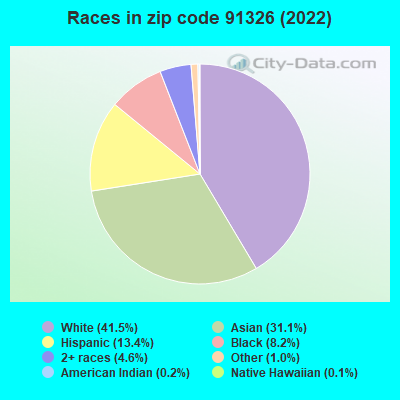


 Nearest zip codes: 91324, 91330, 91311, 91344, 91325, 91306.
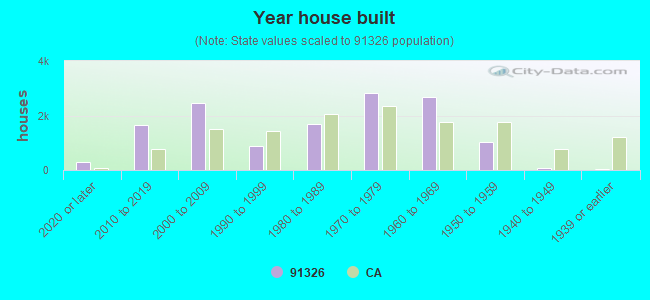

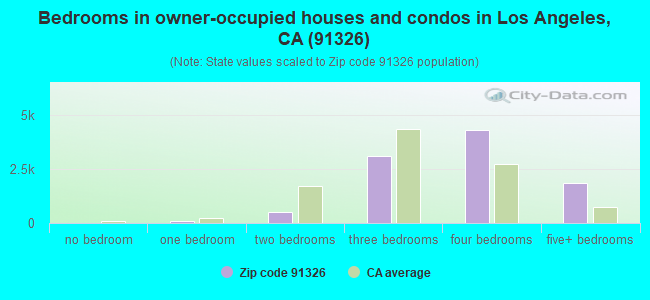
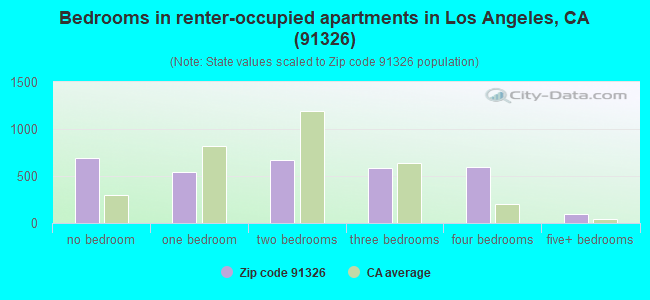
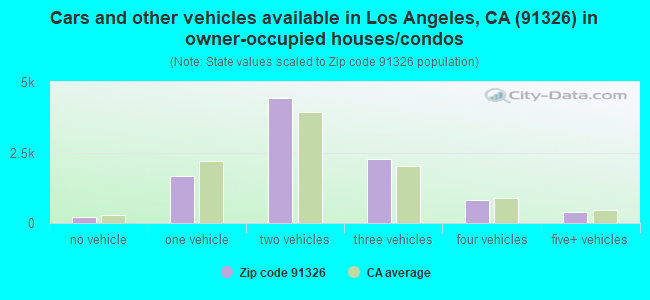
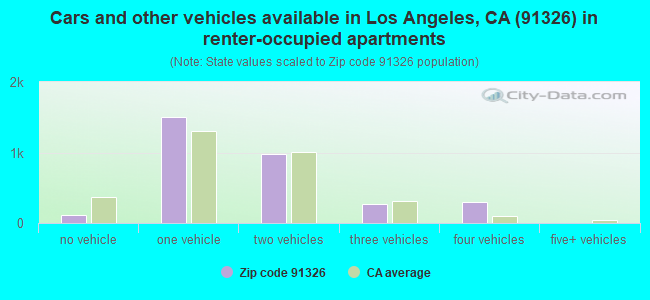


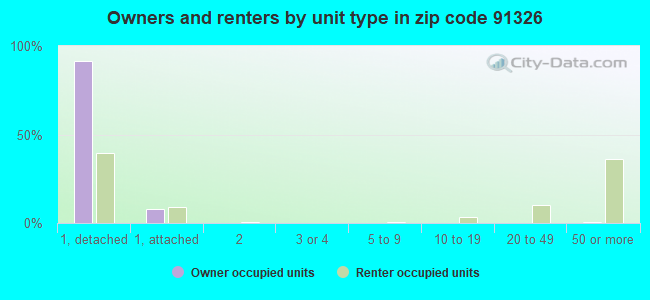


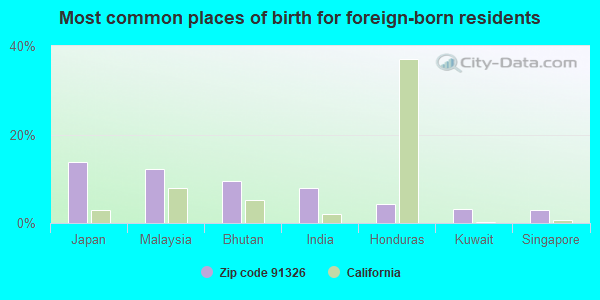
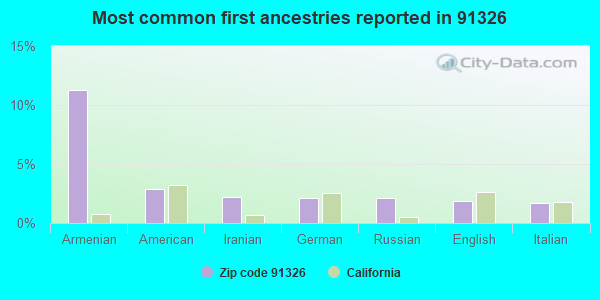
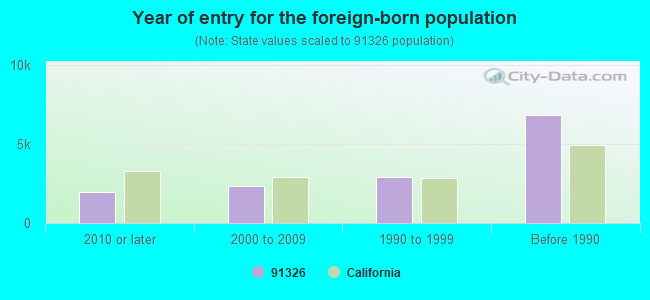


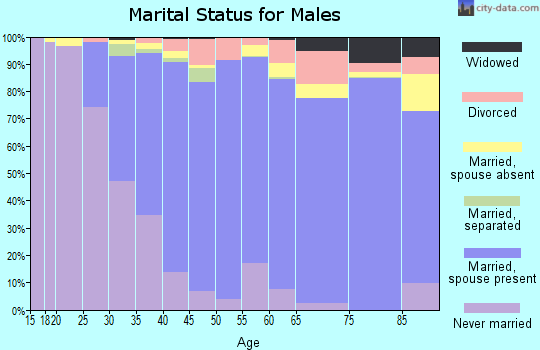
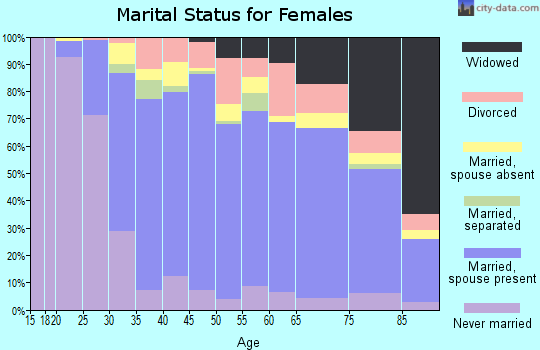
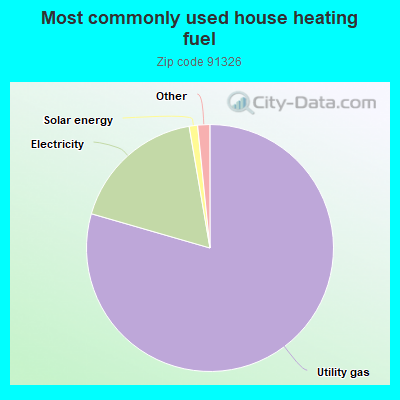
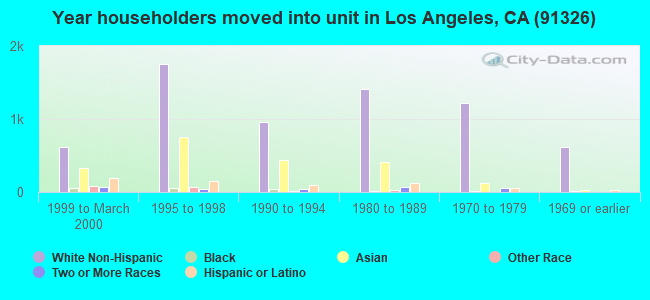
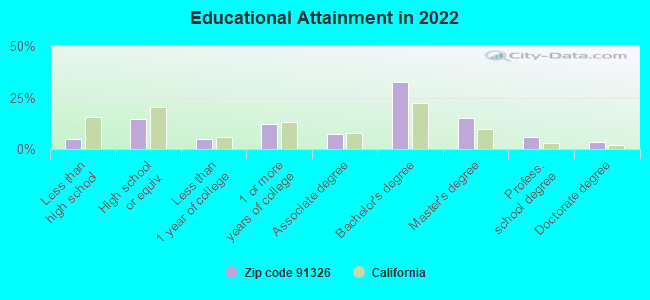
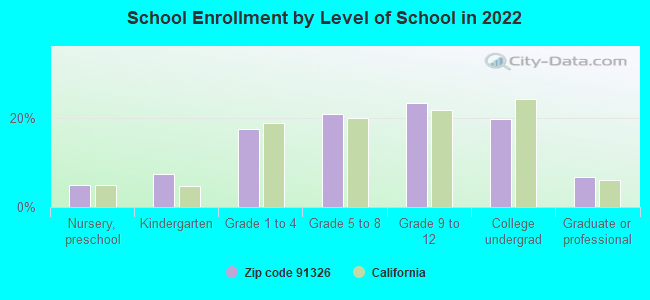
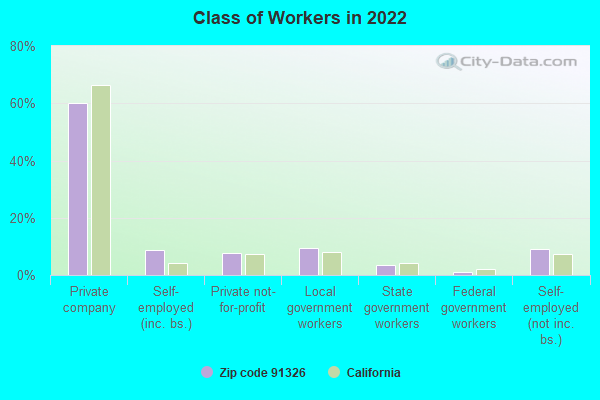
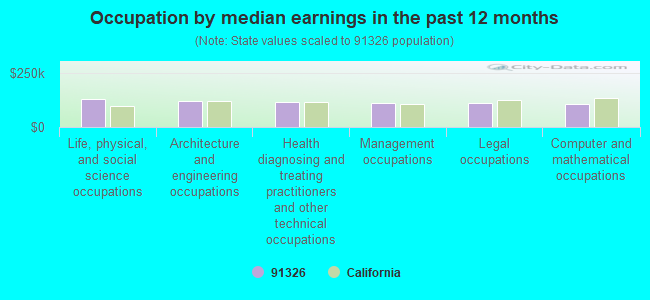
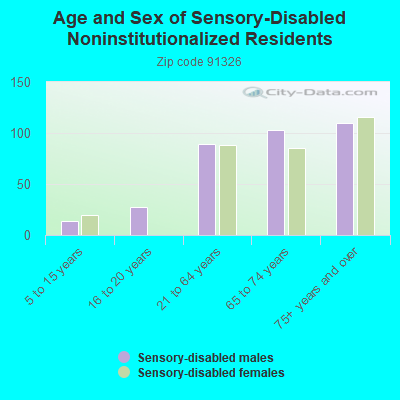
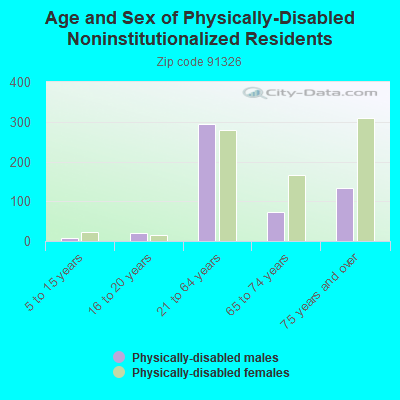
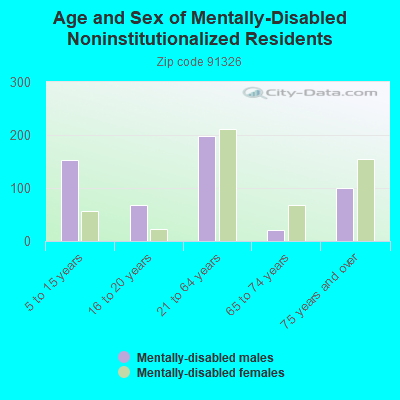
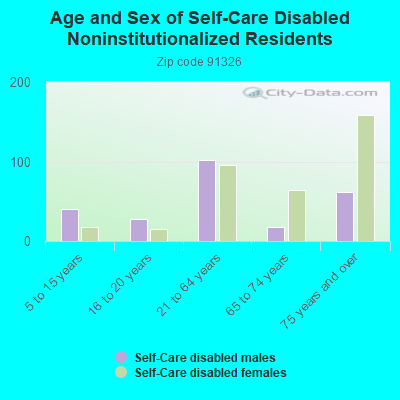
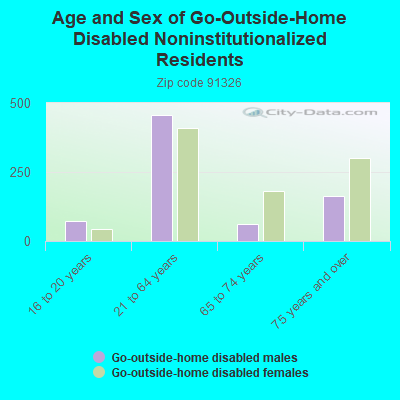
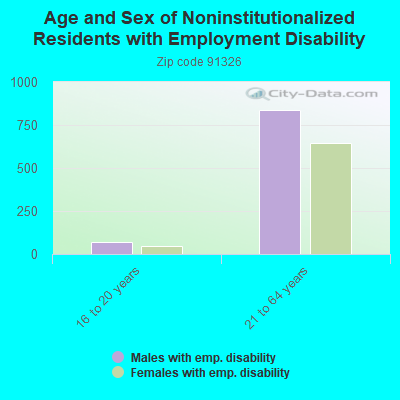
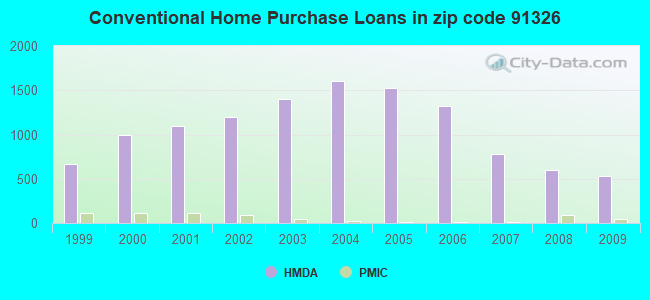
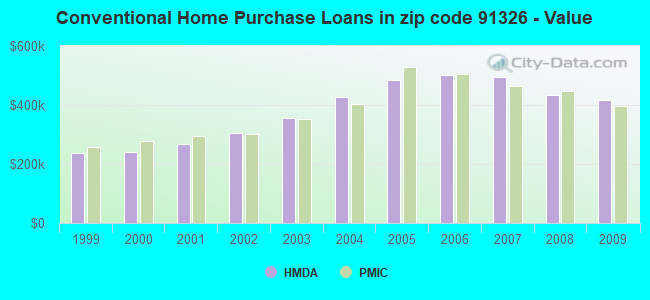
 According to the data from the years 2005 - 2018 the average number of fires per year is 44. The highest number of fires - 70 took place in 2007, and the least - 28 in 2016. The data has a dropping trend.
 When looking into fire subcategories, the most reports belonged to: Structure Fires (35.7%), and Mobile Property/Vehicle Fires (34.0%).