Estimated zip code population in 2022: 25,157 Zip code population in 2010: 24,474 Zip code population in 2000: 23,622
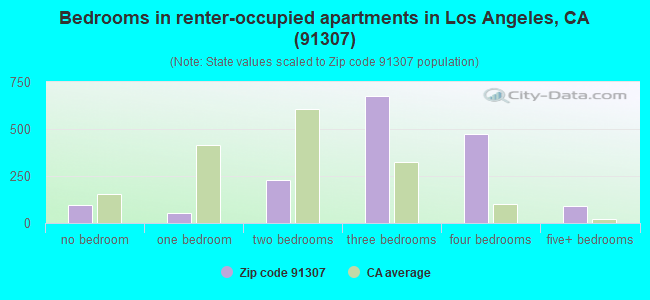
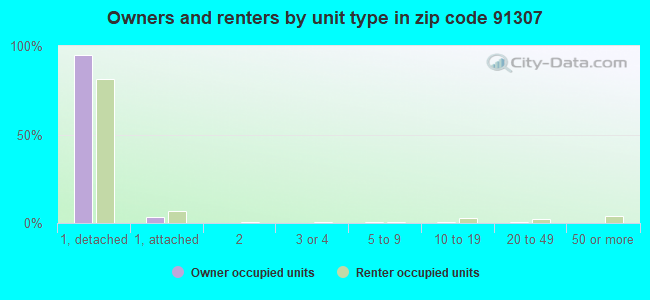
Houses and condos: 8,960 Renter-occupied apartments: 1,611
% of renters here:
19%
State:
44%
March 2022 cost of living index in zip code 91307: 137.6 (high, U.S. average is 100)
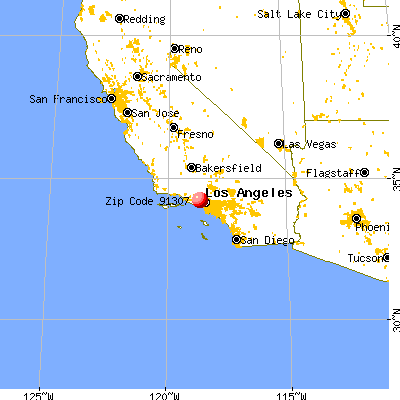
Land area: 8.0 sq. mi. Water area: 0.0 sq. mi.
Population density: 3,127 people per square mile
(average).
OSM Map
General Map
Google Map
MSN Map
OSM Map
General Map
Google Map
MSN Map
OSM Map
General Map
Google Map
MSN Map
OSM Map
General Map
Google Map
MSN Map
Please wait while loading the map...
Real estate property taxes paid for housing units in 2022:
This zip code:
0.7% ($6,481)
California:
0.7% ($4,831)
Median real estate property taxes paid for housing units with mortgages in 2022: $6,986 (0.7%) Median real estate property taxes paid for housing units with no mortgage in 2022: $5,192 (0.6%)
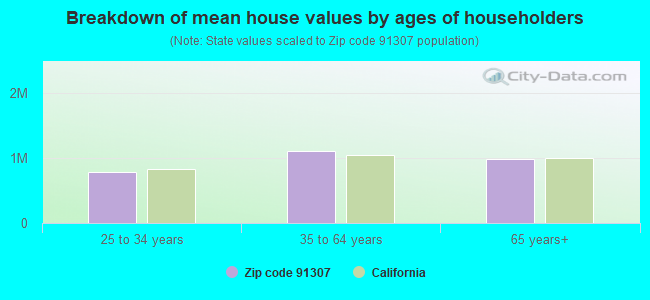
Estimated median house/condo value in 2022: $955,221
91307:
$955,221
California:
$715,900
According to our research of California and other state lists, there were 13 registered sex offenders living in 91307 zip code as of May 10, 2024. The ratio of all residents to sex offenders in zip code 91307 is 2,084 to 1. The ratio of registered sex offenders to all residents in this zip code is much lower than the state average.
Median resident age:
This zip code:
45.4 years
California median age:
37.9 years
Average household size:
This zip code:
2.9 people
California:
2.8 people
Averages for the 2020 tax year for zip code 91307, filed in 2021:
Average Adjusted Gross Income (AGI) in 2020: $114,704 (Individual Income Tax Returns)
Here:
$114,704
State:
$95,910
Salary/wage: $94,374 (reported on 75.6% of returns)
Here:
$94,374
State:
$77,331
(% of AGI for various income ranges: 1153.2% for AGIs below $25k, 3780.9% for AGIs $25k-50k, 7597.3% for AGIs $50k-75k, 11457.9% for AGIs $75k-100k, 23633.6% for AGIs $100k-200k, 92404.4% for AGIs over 200k)
Taxable interest for individuals: $1,865 (reported on 48.8% of returns)
This zip code:
$1,865
California:
$2,294
(% of AGI for various income ranges: 34.1% for AGIs below $25k, 68.3% for AGIs $25k-50k, 115.8% for AGIs $50k-75k, 190.5% for AGIs $75k-100k, 246.4% for AGIs $100k-200k, 1100.9% for AGIs over 200k)
Ordinary dividends: $6,278 (reported on 31.0% of returns)
Here:
$6,278
State:
$10,949
(% of AGI for various income ranges: 45.6% for AGIs below $25k, 90.5% for AGIs $25k-50k, 211.0% for AGIs $50k-75k, 314.7% for AGIs $75k-100k, 531.7% for AGIs $100k-200k, 2791.1% for AGIs over 200k)
Net capital gain/loss in AGI: +$38,044 (reported on 30.7% of returns)
Here:
+$38,044
State:
+$49,306
(% of AGI for various income ranges: 29.3% for AGIs below $25k, 88.4% for AGIs $25k-50k, 107.8% for AGIs $50k-75k, 277.2% for AGIs $75k-100k, 821.6% for AGIs $100k-200k, 29238.4% for AGIs over 200k)
Profit/loss from business: +$18,556 (reported on 25.1% of returns)
Here:
+$18,556
State:
+$15,671
(% of AGI for various income ranges: 256.6% for AGIs below $25k, 478.9% for AGIs $25k-50k, 641.4% for AGIs $50k-75k, 867.4% for AGIs $75k-100k, 1091.6% for AGIs $100k-200k, 5434.4% for AGIs over 200k)
Taxable individual retirement arrangement distribution: $23,272 (reported on 9.9% of returns)
91307:
$23,272
California:
$23,505
(% of AGI for various income ranges: 57.6% for AGIs below $25k, 191.9% for AGIs $25k-50k, 378.6% for AGIs $50k-75k, 570.3% for AGIs $75k-100k, 801.1% for AGIs $100k-200k, 2120.4% for AGIs over 200k)
Self-employed (Keogh) retirement plans: $27,641 (reported on 1.4% of returns)
91307:
$27,641
California:
$30,163
(% of AGI for various income ranges: 16.7% for AGIs $25k-50k, 65.2% for AGIs $100k-200k, 828.0% for AGIs over 200k)
Total itemized deductions: $41,414 (reported on 26.7% of returns)
Here:
$41,414
State:
$39,517
(% of AGI for various income ranges: 175.3% for AGIs below $25k, 489.4% for AGIs $25k-50k, 1056.4% for AGIs $50k-75k, 1915.0% for AGIs $75k-100k, 3442.3% for AGIs $100k-200k, 15204.9% for AGIs over 200k)
Charity contributions: $9,142 (reported on 22.6% of returns)
Here:
$9,142
State:
$12,598
(% of AGI for various income ranges: 7.7% for AGIs below $25k, 34.0% for AGIs $25k-50k, 84.7% for AGIs $50k-75k, 206.6% for AGIs $75k-100k, 416.9% for AGIs $100k-200k, 4080.7% for AGIs over 200k)
Taxes paid: $9,161 (reported on 26.5% of returns)
91307:
$9,161
State:
$8,807
(% of AGI for various income ranges: 42.8% for AGIs below $25k, 122.0% for AGIs $25k-50k, 271.3% for AGIs $50k-75k, 551.0% for AGIs $75k-100k, 1007.7% for AGIs $100k-200k, 2394.9% for AGIs over 200k)
Earned income credit: $1,537 (reported on 8.3% of returns)
Here:
$1,537
State:
$2,074
(% of AGI for various income ranges: 57.4% for AGIs below $25k, 42.7% for AGIs $25k-50k)
Percentage of individuals using paid preparers for their 2020 taxes: 92.2%
Here:
92%
State:
92%
(% for various income ranges: 90.0% for AGIs below $25k, 92.1% for AGIs $25k-50k, 92.2% for AGIs $50k-75k, 92.3% for AGIs $75k-100k, 93.4% for AGIs $100k-200k, 94.7% for AGIs over 200k)
Averages for the 2012 tax year for zip code 91307, filed in 2013:
Average Adjusted Gross Income (AGI) in 2012: $91,762 (Individual Income Tax Returns)
Here:
$91,762
State:
$72,726
Salary/wage: $81,329 (reported on 77.1% of returns)
Here:
$81,329
State:
$59,079
(% of AGI for various income ranges: 63.0% for AGIs below $25k, 67.3% for AGIs $25k-50k, 67.1% for AGIs $50k-75k, 68.9% for AGIs $75k-100k, 76.5% for AGIs $100k-200k, 62.7% for AGIs over 200k)
Taxable interest for individuals: $1,905 (reported on 50.7% of returns)
This zip code:
$1,905
California:
$2,146
(% of AGI for various income ranges: 2.5% for AGIs below $25k, 1.1% for AGIs $25k-50k, 1.1% for AGIs $50k-75k, 1.0% for AGIs $75k-100k, 0.8% for AGIs $100k-200k, 1.1% for AGIs over 200k)
Ordinary dividends: $4,578 (reported on 30.9% of returns)
Here:
$4,578
State:
$9,308
(% of AGI for various income ranges: 3.0% for AGIs below $25k, 1.6% for AGIs $25k-50k, 1.7% for AGIs $50k-75k, 1.8% for AGIs $75k-100k, 1.3% for AGIs $100k-200k, 1.5% for AGIs over 200k)
Net capital gain/loss in AGI: +$9,667 (reported on 28.0% of returns)
Here:
+$9,667
State:
+$30,460
(% of AGI for various income ranges: 0.4% for AGIs $50k-75k, 0.5% for AGIs $75k-100k, 1.2% for AGIs $100k-200k, 6.4% for AGIs over 200k)
Profit/loss from business: +$21,451 (reported on 24.4% of returns)
Here:
+$21,451
State:
+$17,064
(% of AGI for various income ranges: 16.2% for AGIs below $25k, 10.8% for AGIs $25k-50k, 6.8% for AGIs $50k-75k, 5.4% for AGIs $75k-100k, 4.7% for AGIs $100k-200k, 4.4% for AGIs over 200k)
Taxable individual retirement arrangement distribution: $18,081 (reported on 12.8% of returns)
91307:
$18,081
California:
$19,557
(% of AGI for various income ranges: 4.7% for AGIs below $25k, 4.3% for AGIs $25k-50k, 4.2% for AGIs $50k-75k, 3.6% for AGIs $75k-100k, 2.4% for AGIs $100k-200k, 1.5% for AGIs over 200k)
Self-employment retirement plans: $24,936 (reported on 1.9% of returns)
91307:
$24,936
California:
$24,530
(% of AGI for various income ranges: 0.4% for AGIs $25k-50k, 0.4% for AGIs $75k-100k, 0.4% for AGIs $100k-200k, 0.9% for AGIs over 200k)
Total itemized deductions: $34,829 (24% of AGI, reported on 53.2% of returns)
Here:
$34,829
State:
$34,004
Here:
24.1% of AGI
State:
22.7% of AGI
(% of AGI for various income ranges: 23.6% for AGIs below $25k, 21.9% for AGIs $25k-50k, 22.7% for AGIs $50k-75k, 21.7% for AGIs $75k-100k, 22.3% for AGIs $100k-200k, 17.0% for AGIs over 200k)
Charity contributions: $3,551 (reported on 45.8% of returns)
Here:
$3,551
State:
$4,659
(% of AGI for various income ranges: 1.0% for AGIs below $25k, 1.6% for AGIs $25k-50k, 1.9% for AGIs $50k-75k, 1.8% for AGIs $75k-100k, 1.9% for AGIs $100k-200k, 1.7% for AGIs over 200k)
Taxes paid: $14,115 (reported on 53.1% of returns)
91307:
$14,115
State:
$14,448
(% of AGI for various income ranges: 5.2% for AGIs below $25k, 5.1% for AGIs $25k-50k, 6.1% for AGIs $50k-75k, 7.0% for AGIs $75k-100k, 8.7% for AGIs $100k-200k, 9.3% for AGIs over 200k)
Earned income credit: $1,713 (reported on 9.7% of returns)
Here:
$1,713
State:
$2,286
(% of AGI for various income ranges: 3.5% for AGIs below $25k, 0.7% for AGIs $25k-50k)
Percentage of individuals using paid preparers for their 2012 taxes: 69.2%
Here:
69%
State:
64%
(% for various income ranges: 63.6% for AGIs below $25k, 68.8% for AGIs $25k-50k, 71.2% for AGIs $50k-75k, 73.6% for AGIs $75k-100k, 71.1% for AGIs $100k-200k, 77.7% for AGIs over 200k)
Averages for the 2004 tax year for zip code 91307, filed in 2005:
Average Adjusted Gross Income (AGI) in 2004: $76,042 (Individual Income Tax Returns)
Here:
$76,042
State:
$58,600
Salary/wage: $69,963 (reported on 77.6% of returns)
Here:
$69,963
State:
$49,455
(% of AGI for various income ranges: 60.9% for AGIs $10k-25k, 69.2% for AGIs $25k-50k, 71.2% for AGIs $50k-75k, 76.7% for AGIs $75k-100k, 69.2% for AGIs over 100k)
Taxable interest for individuals: $2,081 (reported on 62.2% of returns)
This zip code:
$2,081
California:
$2,365
(% of AGI for various income ranges: 4.2% for AGIs $10k-25k, 2.3% for AGIs $25k-50k, 1.6% for AGIs $50k-75k, 1.6% for AGIs $75k-100k, 1.4% for AGIs over 100k)
Taxable dividends: $2,707 (reported on 36.7% of returns)
Here:
$2,707
State:
$4,746
(% of AGI for various income ranges: 2.5% for AGIs $10k-25k, 1.6% for AGIs $25k-50k, 1.4% for AGIs $50k-75k, 1.3% for AGIs $75k-100k, 1.0% for AGIs over 100k)
Net capital gain/loss: +$13,429 (reported on 32.7% of returns)
Here:
+$13,429
State:
+$23,418
(% of AGI for various income ranges: -0.3% for AGIs $10k-25k, 1.1% for AGIs $25k-50k, 1.0% for AGIs $50k-75k, 1.3% for AGIs $75k-100k, 8.5% for AGIs over 100k)
Profit/loss from business: +$21,708 (reported on 25.2% of returns)
Here:
+$21,708
State:
+$16,826
(% of AGI for various income ranges: 14.8% for AGIs $10k-25k, 12.1% for AGIs $25k-50k, 7.9% for AGIs $50k-75k, 5.6% for AGIs $75k-100k, 6.0% for AGIs over 100k)
IRA payment deduction: $3,562 (reported on 4.6% of returns)
91307:
$3,562
California:
$3,192
(% of AGI for various income ranges: 0.3% for AGIs $10k-25k, 0.4% for AGIs $25k-50k, 0.4% for AGIs $50k-75k, 0.3% for AGIs $75k-100k, 0.1% for AGIs over 100k)
Self-employed pension: $17,214 (reported on 2.5% of returns)
Here:
$17,214
California:
$17,688
(% of AGI for various income ranges: 0.3% for AGIs $25k-50k, 0.3% for AGIs $50k-75k, 0.4% for AGIs $75k-100k, 0.7% for AGIs over 100k)
Total itemized deductions: $31,226 (26% of AGI, reported on 56.7% of returns)
Here:
$31,226
State:
$28,113
Here:
26.4% of AGI
State:
25.3% of AGI
(% of AGI for various income ranges: 26.9% for AGIs $10k-25k, 26.2% for AGIs $25k-50k, 27.9% for AGIs $50k-75k, 27.6% for AGIs $75k-100k, 20.2% for AGIs over 100k)
Charity contributions deductions: $3,385 (3% of AGI, reported on 51.3% of returns)
Here:
$3,385
State:
$3,923
Here:
2.7% of AGI
State:
3.3% of AGI
(% of AGI for various income ranges: 1.9% for AGIs $10k-25k, 2.1% for AGIs $25k-50k, 2.6% for AGIs $50k-75k, 2.7% for AGIs $75k-100k, 2.2% for AGIs over 100k)
Total tax: $14,349 (reported on 81.3% of returns)
91307:
$14,349
State:
$10,761
(% of AGI for various income ranges: 5.3% for AGIs $10k-25k, 7.8% for AGIs $25k-50k, 8.9% for AGIs $50k-75k, 9.5% for AGIs $75k-100k, 19.2% for AGIs over 100k)
Earned income credit: $1,363 (reported on 7.9% of returns)
Here:
$1,363
State:
$1,763
Percentage of individuals using paid preparers for their 2004 taxes: 70.9%
Here:
71%
State:
66%
(% for various income ranges: 63.4% for AGIs below $10k, 67.4% for AGIs $10k-25k, 72.2% for AGIs $25k-50k, 72.3% for AGIs $50k-75k, 74.4% for AGIs $75k-100k, 75.7% for AGIs over 100k)
Likely homosexual households (counted as self-reported same-sex unmarried-partner households)
Lesbian couples: 0.0% of all households
Gay men: 0.2% of all households
Household received Food Stamps/SNAP in the past 12 months: 447 Household did not receive Food Stamps/SNAP in the past 12 months: 8,089
Women who had a birth in the past 12 months: 309 (296 now married, 11 unmarried) Women who did not have a birth in the past 12 months: 5,164 (2,220 now married, 2,936 unmarried)
Housing units in zip code 91307 with a mortgage: 5,200 (855 second mortgage, 694 both second mortgage and home equity loan) Houses without a mortgage: 76
Median monthly owner costs for units with a mortgage: $3,435 Median monthly owner costs for units without a mortgage: $1,005
Residents with income below the poverty level in 2022:
This zip code:
6.4%
Whole state:
12.2%
Residents with income below 50% of the poverty level in 2022:
This zip code:
2.8%
Whole state:
6.2%
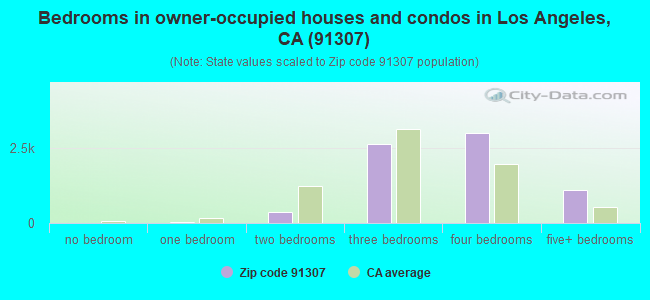
Median number of rooms in houses and condos:
Here:
6.4
State:
6.0
Median number of rooms in apartments:
Here:
5.4
State:
3.9
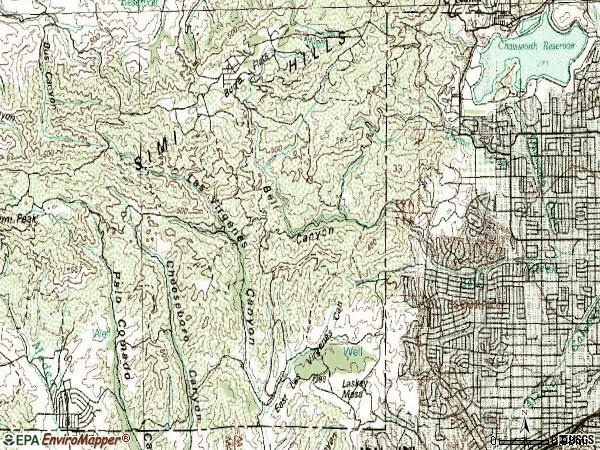
Notable locations in this zip code not listed on our city pages
Parks in zip code 91307 include: Shadow Ranch Park (1), Bell Canyon Park (2), El Escorpion Park (3), Knapp Ranch Park (4), Mae Boyar Recreation Center (5), West Hills Recreation Center (6). Display/hide their locations on the map
In group quarters: 399 (-1 institutionalized population)
Size of family households: 2,531 2-persons, 1,493 3-persons, 1,677 4-persons, 717 5-persons, 190 6-persons, 68 7-or-more-persons
Size of nonfamily households: 1,422 1-person, 484 2-persons, 55 3-persons
4,053 married couples with children.
677 single-parent households (359 men, 318 women).
63.2% of residents of 91307 zip code speak English at home.
9.1% of residents speak Spanish at home (79% very well, 14% well, 6% not well, 1% not at all).
15.1% of residents speak other Indo-European language at home (78% very well, 11% well, 8% not well, 3% not at all).
9.9% of residents speak Asian or Pacific Island language at home (58% very well, 29% well, 10% not well, 3% not at all).
3.2% of residents speak other language at home (78% very well, 15% well, 7% not well).
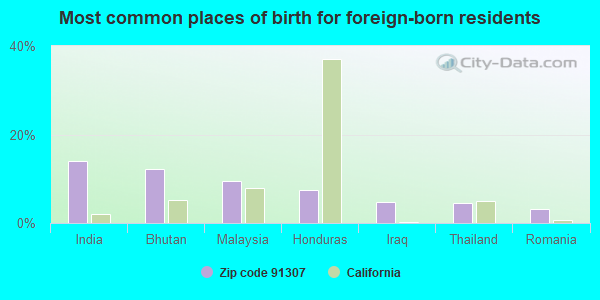
Foreign born population: 7,348 (29.2%) (78.4% of them are naturalized citizens)
This zip code:
29.2%
Whole state:
26.7%
14%India
12%Bhutan
9%Malaysia
7%Honduras
5%Iraq
5%Thailand
3%Romania
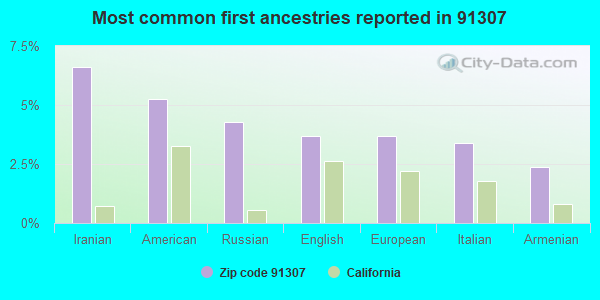
7%Iranian
5%American
4%Russian
4%English
4%European
3%Italian
2%Armenian
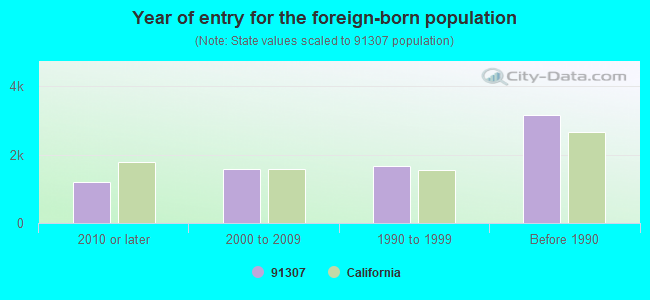
Year of entry for the foreign-born population
1,1922010 or later
1,5782000 to 2009
1,6701990 to 1999
3,164Before 1990
Facilities with environmental interests located in this zip code:
ESPRIT CLEANERS (23649 VANOWEN ST in CANOGA PARK, CA)
STATE MASTER (California - Hazardous Waste Tracking) - HAZARDOU WASTE PROGRAM Small Quantity Generators, between 100 kg and 1000 kg of hazardous waste/month (Resource Conservation and Recovery Act (tracking hazardous waste)) - notification Organizations: PAUL SCHOELEN (CONTACT/OWNER)
HAMLIN STREET ELEMENTARY (22627 HAMLIN ST. in CANOGA PARK, CA)
(National Center for Education Statistics) - STATE ID-6017438 Organizations: LOS ANGELES UNIFIED (SCHOOL DISTRICT)
HAYNES ELEMENTARY (6624 LOCKHURST DR. in WEST HILLS, CA)
(National Center for Education Statistics) - STATE ID-6017529 Organizations: LOS ANGELES UNIFIED (SCHOOL DISTRICT)
KITS CAMERA WESTHILLS (6633 FALLBROOK AVE STE 536 in CANOGA PARK, CA)
(Resource Conservation and Recovery Act (tracking hazardous waste))
HOME DEPOT USA INC HD 1070 (22855 VICTORY BLVD in WEST HILLS, CA)
Small Quantity Generators, between 100 kg and 1000 kg of hazardous waste/month (Resource Conservation and Recovery Act (tracking hazardous waste)) Alternative names: HOME DEPOT USA HD 1070
JAPANESE AUTO SVC (22950 VANOWEN in CANOGA PARK, CA)
Small Quantity Generators, between 100 kg and 1000 kg of hazardous waste/month (Resource Conservation and Recovery Act (tracking hazardous waste)) - notification Organizations: RASE INC (CONTACT/OWNER)
KMART CORP NO7714 (6433 FALLBROOK AVE in WEST HILLS, CA)
Small Quantity Generators, between 100 kg and 1000 kg of hazardous waste/month (Resource Conservation and Recovery Act (tracking hazardous waste)) - notification Organizations: KMART CORPORATION (CONTACT/OWNER)
MEDICAL CENTER MRI WEST HILLS (7320 MEDICAL CENTER DR in CANOGA PARK, CA)
Small Quantity Generators, between 100 kg and 1000 kg of hazardous waste/month (Resource Conservation and Recovery Act (tracking hazardous waste)) - notification
IDEAL COMMUNITY SCHOOL (7115 SHOUP AVE in CANOGA PARK, CA)
COMPLIANCE ACTIVITY (Tracking inspections of insecticide, fungicide, and rodenticide, and toxic substances)
Housing units lacking complete plumbing facilities: 0.4% Housing units lacking complete kitchen facilities: 1.5%
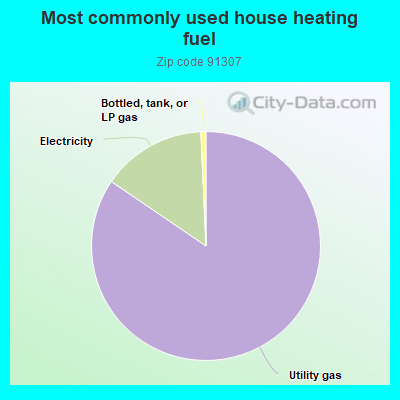
84.1%Utility gas
14.7%Electricity
0.7%Bottled, tank, or LP gas
Population in 1990: 22,049. Population change in the 1990s: +1,573 (+7.1%).
Place of birth for U.S.-born residents:
This state: 12,968
Northeast: 1,717
Midwest: 1,254
South: 768
West: 716
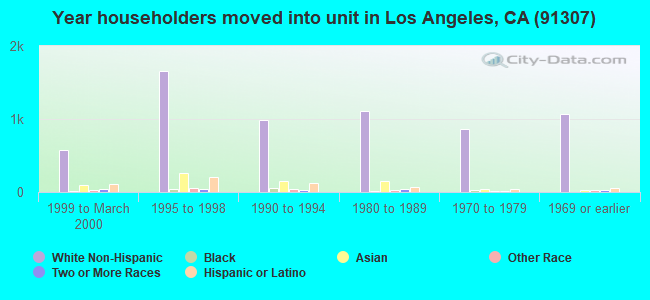
63% of the 91307 zip code residents lived in the same house 5 years ago. Out of people who lived in different houses, 80% lived in this county. Out of people who lived in different counties, 50% lived in California.
92% of the 91307 zip code residents lived in the same house 1 year ago. Out of people who lived in different houses, 70% moved from this county. Out of people who lived in different houses, 14% moved from different county within same state. Out of people who lived in different houses, 12% moved from different state. Out of people who lived in different houses, 5% moved from abroad.
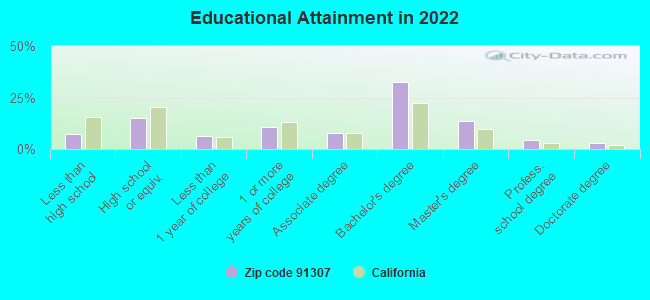
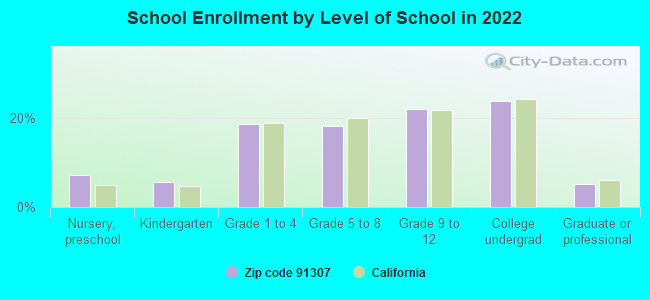
Private vs. public school enrollment:
Students in private schools in grades 1 to 8 (elementary and middle school): 379
Here:
16.5%
California:
10.5%
Students in private schools in grades 9 to 12 (high school): 211
Here:
15.5%
California:
8.5%
Students in private undergraduate colleges: 220
Here:
14.9%
California:
15.9%
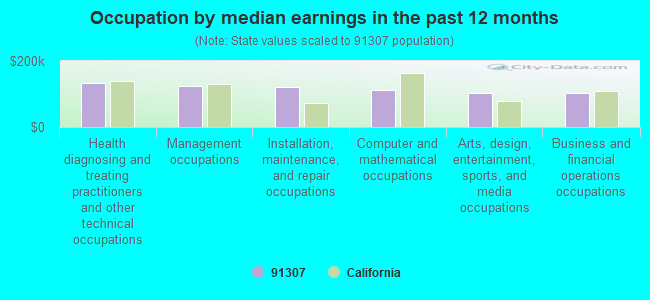
Occupation by median earnings in the past 12 months ($)
134,114Health diagnosing and treating practitioners and other technical occupations
122,733Management occupations
121,065Installation, maintenance, and repair occupations
113,599Computer and mathematical occupations
102,486Arts, design, entertainment, sports, and media occupations
101,754Business and financial operations occupations
Companies with federal contracts located in this zip code:
EDUCATIONAL CONTROL PRODUCTS (1 BUCKSKIN CT in CANOGA PARK, CA; small business) : $90,367 in 5 contractsfrom 2000 to 2005
Contracts for Laboratory Equipment and Supplies, Miscellaneous Electrical and Electronic Components, Physical Properties Testing and Inspection by Navy, Army Signed by year:2000: $43,900; 2001: $0; 2002: $0; 2003: $11,875; 2004: $13,895; 2005: $20,697; 2006: $0.
Biggest contracts:
$43,900 with Navy for Laboratory Equipment and Supplies. Signed on 2000-09-26. Completion date: 2000-11-13.
$13,895, same as above.Signed on 2004-12-14. Completion date: 2005-01-14.
$11,875 with Navy for Miscellaneous Electrical and Electronic Components. Signed on 2003-09-24. Completion date: 2003-11-07.
$11,700 with Navy for Laboratory Equipment and Supplies. Signed on 2005-09-30. Completion date: 2005-11-11.
RILEY LABORATORIES (6520 PLATT AVE #562 in CANOGA PARK, CA; small business) : $53,810 in 2 contractsin 2004
$36,200 with Navy for In Vitro Diagnostic Substances, Reagents, Test Kits, and Sets. Signed on 2004-01-15. Completion date: 2005-01-14.
$17,610, same as above.Signed on 2004-03-31. Completion date: 2005-01-14.
ADVANCED SPECIALTY PRODUCTS IN (23383 BASSETT STREET in WEST HILLS, CA; small business) : $36,816 in 2 contractsfrom 2003 to 2004
$31,900 with Navy for Individual Equipment. Signed on 2003-08-05. Completion date: 2003-09-03.
$4,916 with Navy for Armor, Personal. Signed on 2004-05-17. Completion date: 2004-05-24.
Top industries in this zip code by the number of employees in 2005:
Health Care and Social Assistance: General Medical and Surgical Hospitals (500-999 employees: 1 establishment)
2005 - 2018 National Fire Incident Reporting System (NFIRS) incidents
Based on the data from the years 2005 - 2018 the average number of fires per year is 23. The highest number of reported fires - 38 took place in 2005, and the least - 15 in 2015. The data has a dropping trend.
When looking into fire subcategories, the most reports belonged to: Structure Fires (50.5%), and Outside Fires (27.7%).
Fire incident types reported to NFIRS in Zip Code 91307


 Nearest zip codes: 91304, 91367, 93064, 91303, 91302, 91364.


 Based on the data from the years 2005 - 2018 the average number of fires per year is 23. The highest number of reported fires - 38 took place in 2005, and the least - 15 in 2015. The data has a dropping trend.
 When looking into fire subcategories, the most reports belonged to: Structure Fires (50.5%), and Outside Fires (27.7%).