Estimated zip code population in 2022: 26,941 Zip code population in 2010: 27,480 Zip code population in 2000: 27,887
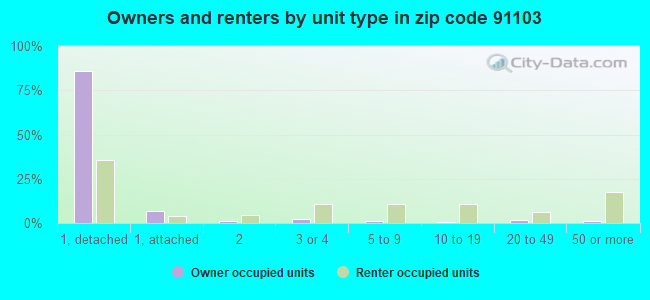
Houses and condos: 9,685 Renter-occupied apartments: 4,857
% of renters here:
54%
State:
44%
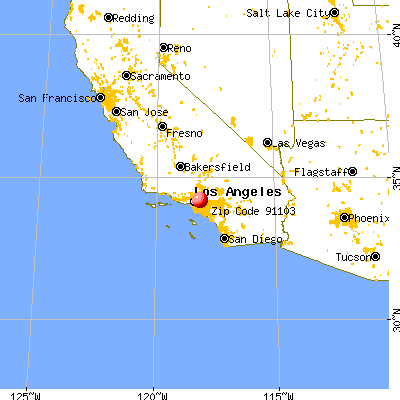
March 2022 cost of living index in zip code 91103: 140.5 (very high, U.S. average is 100)
Land area: 5.4 sq. mi. Water area: 0.1 sq. mi.
Population density: 5,021 people per square mile
(average).
OSM Map
General Map
Google Map
MSN Map
OSM Map
General Map
Google Map
MSN Map
OSM Map
General Map
Google Map
MSN Map
OSM Map
General Map
Google Map
MSN Map
Please wait while loading the map...
Real estate property taxes paid for housing units in 2022:
This zip code:
0.6% ($5,709)
California:
0.7% ($4,831)
Median real estate property taxes paid for housing units with mortgages in 2022: $6,296 (0.6%) Median real estate property taxes paid for housing units with no mortgage in 2022: $3,466 (0.4%)
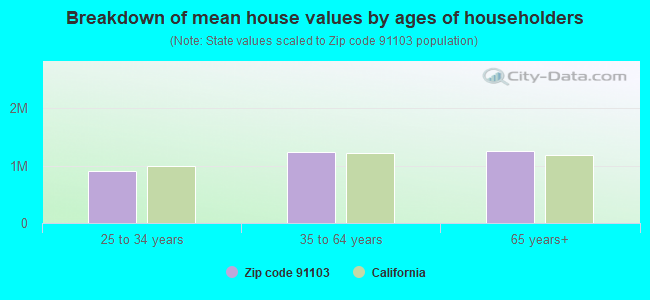
Estimated median house/condo value in 2022: $977,698
91103:
$977,698
California:
$715,900
According to our research of California and other state lists, there were 25 registered sex offenders living in 91103 zip code as of May 10, 2024. The ratio of all residents to sex offenders in zip code 91103 is 1,141 to 1. The ratio of registered sex offenders to all residents in this zip code is lower than the state average.
Median resident age:
This zip code:
40.6 years
California median age:
37.9 years
Average household size:
This zip code:
2.8 people
California:
2.8 people
Averages for the 2020 tax year for zip code 91103, filed in 2021:
Average Adjusted Gross Income (AGI) in 2020: $100,469 (Individual Income Tax Returns)
Here:
$100,469
State:
$95,910
Salary/wage: $76,242 (reported on 80.4% of returns)
Here:
$76,242
State:
$77,331
(% of AGI for various income ranges: 1261.1% for AGIs below $25k, 4034.2% for AGIs $25k-50k, 7583.7% for AGIs $50k-75k, 11376.7% for AGIs $75k-100k, 20984.3% for AGIs $100k-200k, 130696.3% for AGIs over 200k)
Taxable interest for individuals: $2,688 (reported on 30.7% of returns)
This zip code:
$2,688
California:
$2,294
(% of AGI for various income ranges: 12.4% for AGIs below $25k, 14.1% for AGIs $25k-50k, 41.8% for AGIs $50k-75k, 64.1% for AGIs $75k-100k, 155.6% for AGIs $100k-200k, 2888.1% for AGIs over 200k)
Ordinary dividends: $14,630 (reported on 17.4% of returns)
Here:
$14,630
State:
$10,949
(% of AGI for various income ranges: 15.6% for AGIs below $25k, 25.9% for AGIs $25k-50k, 89.9% for AGIs $50k-75k, 216.5% for AGIs $75k-100k, 586.1% for AGIs $100k-200k, 9117.0% for AGIs over 200k)
Net capital gain/loss in AGI: +$54,784 (reported on 17.5% of returns)
Here:
+$54,784
State:
+$49,306
(% of AGI for various income ranges: 15.9% for AGIs below $25k, 22.4% for AGIs $25k-50k, 66.0% for AGIs $50k-75k, 287.1% for AGIs $75k-100k, 726.9% for AGIs $100k-200k, 41480.0% for AGIs over 200k)
Profit/loss from business: +$12,026 (reported on 23.0% of returns)
Here:
+$12,026
State:
+$15,671
(% of AGI for various income ranges: 237.6% for AGIs below $25k, 213.3% for AGIs $25k-50k, 302.0% for AGIs $50k-75k, 328.4% for AGIs $75k-100k, 837.1% for AGIs $100k-200k, 4594.4% for AGIs over 200k)
Taxable individual retirement arrangement distribution: $31,761 (reported on 5.3% of returns)
91103:
$31,761
California:
$23,505
(% of AGI for various income ranges: 27.4% for AGIs below $25k, 32.7% for AGIs $25k-50k, 87.6% for AGIs $50k-75k, 205.3% for AGIs $75k-100k, 908.3% for AGIs $100k-200k, 4090.4% for AGIs over 200k)
Self-employed (Keogh) retirement plans: $37,300 (reported on 1.1% of returns)
91103:
$37,300
California:
$30,163
(% of AGI for various income ranges: 52.8% for AGIs $100k-200k, 1787.4% for AGIs over 200k)
Total itemized deductions: $45,892 (reported on 17.6% of returns)
Here:
$45,892
State:
$39,517
(% of AGI for various income ranges: 118.7% for AGIs below $25k, 192.9% for AGIs $25k-50k, 686.1% for AGIs $50k-75k, 1320.6% for AGIs $75k-100k, 3107.7% for AGIs $100k-200k, 21208.1% for AGIs over 200k)
Charity contributions: $11,719 (reported on 15.6% of returns)
Here:
$11,719
State:
$12,598
(% of AGI for various income ranges: 7.8% for AGIs below $25k, 22.3% for AGIs $25k-50k, 93.6% for AGIs $50k-75k, 209.0% for AGIs $75k-100k, 522.3% for AGIs $100k-200k, 6044.1% for AGIs over 200k)
Taxes paid: $8,682 (reported on 17.6% of returns)
91103:
$8,682
State:
$8,807
(% of AGI for various income ranges: 21.8% for AGIs below $25k, 40.8% for AGIs $25k-50k, 167.7% for AGIs $50k-75k, 401.8% for AGIs $75k-100k, 898.7% for AGIs $100k-200k, 2689.6% for AGIs over 200k)
Earned income credit: $2,064 (reported on 17.5% of returns)
Here:
$2,064
State:
$2,074
(% of AGI for various income ranges: 107.1% for AGIs below $25k, 71.1% for AGIs $25k-50k)
Percentage of individuals using paid preparers for their 2020 taxes: 91.1%
Here:
91%
State:
92%
(% for various income ranges: 88.1% for AGIs below $25k, 91.4% for AGIs $25k-50k, 92.4% for AGIs $50k-75k, 93.0% for AGIs $75k-100k, 94.2% for AGIs $100k-200k, 94.3% for AGIs over 200k)
Averages for the 2012 tax year for zip code 91103, filed in 2013:
Average Adjusted Gross Income (AGI) in 2012: $72,766 (Individual Income Tax Returns)
Here:
$72,766
State:
$72,726
Salary/wage: $56,412 (reported on 80.9% of returns)
Here:
$56,412
State:
$59,079
(% of AGI for various income ranges: 74.1% for AGIs below $25k, 84.9% for AGIs $25k-50k, 81.1% for AGIs $50k-75k, 76.7% for AGIs $75k-100k, 73.8% for AGIs $100k-200k, 47.0% for AGIs over 200k)
Taxable interest for individuals: $2,270 (reported on 27.9% of returns)
This zip code:
$2,270
California:
$2,146
(% of AGI for various income ranges: 0.4% for AGIs below $25k, 0.5% for AGIs $25k-50k, 0.5% for AGIs $50k-75k, 0.6% for AGIs $75k-100k, 0.7% for AGIs $100k-200k, 1.2% for AGIs over 200k)
Ordinary dividends: $15,641 (reported on 14.8% of returns)
Here:
$15,641
State:
$9,308
(% of AGI for various income ranges: 0.7% for AGIs below $25k, 0.8% for AGIs $25k-50k, 1.3% for AGIs $50k-75k, 1.7% for AGIs $75k-100k, 2.4% for AGIs $100k-200k, 4.9% for AGIs over 200k)
Net capital gain/loss in AGI: +$32,121 (reported on 13.1% of returns)
Here:
+$32,121
State:
+$30,460
(% of AGI for various income ranges: 0.1% for AGIs $25k-50k, 0.5% for AGIs $75k-100k, 1.6% for AGIs $100k-200k, 11.1% for AGIs over 200k)
Profit/loss from business: +$15,761 (reported on 23.0% of returns)
Here:
+$15,761
State:
+$17,064
(% of AGI for various income ranges: 18.4% for AGIs below $25k, 4.3% for AGIs $25k-50k, 3.0% for AGIs $50k-75k, 2.3% for AGIs $75k-100k, 3.4% for AGIs $100k-200k, 4.1% for AGIs over 200k)
Taxable individual retirement arrangement distribution: $30,050 (reported on 5.5% of returns)
91103:
$30,050
California:
$19,557
(% of AGI for various income ranges: 1.0% for AGIs below $25k, 1.3% for AGIs $25k-50k, 1.8% for AGIs $50k-75k, 2.8% for AGIs $75k-100k, 3.5% for AGIs $100k-200k, 2.3% for AGIs over 200k)
Self-employment retirement plans: $44,485 (reported on 1.1% of returns)
91103:
$44,485
California:
$24,530
(% of AGI for various income ranges: 0.3% for AGIs $25k-50k, 0.3% for AGIs $100k-200k, 1.2% for AGIs over 200k)
Total itemized deductions: $40,714 (23% of AGI, reported on 32.4% of returns)
Here:
$40,714
State:
$34,004
Here:
23.4% of AGI
State:
22.7% of AGI
(% of AGI for various income ranges: 8.0% for AGIs below $25k, 13.6% for AGIs $25k-50k, 18.8% for AGIs $50k-75k, 21.4% for AGIs $75k-100k, 22.1% for AGIs $100k-200k, 18.9% for AGIs over 200k)
Charity contributions: $6,433 (reported on 27.7% of returns)
Here:
$6,433
State:
$4,659
(% of AGI for various income ranges: 0.5% for AGIs below $25k, 1.2% for AGIs $25k-50k, 2.1% for AGIs $50k-75k, 2.4% for AGIs $75k-100k, 2.7% for AGIs $100k-200k, 3.1% for AGIs over 200k)
Taxes paid: $18,090 (reported on 32.4% of returns)
91103:
$18,090
State:
$14,448
(% of AGI for various income ranges: 1.6% for AGIs below $25k, 2.8% for AGIs $25k-50k, 5.0% for AGIs $50k-75k, 6.9% for AGIs $75k-100k, 8.3% for AGIs $100k-200k, 10.9% for AGIs over 200k)
Earned income credit: $2,651 (reported on 25.6% of returns)
Here:
$2,651
State:
$2,286
(% of AGI for various income ranges: 9.3% for AGIs below $25k, 1.4% for AGIs $25k-50k)
Percentage of individuals using paid preparers for their 2012 taxes: 69.8%
Here:
70%
State:
64%
(% for various income ranges: 68.1% for AGIs below $25k, 70.8% for AGIs $25k-50k, 72.5% for AGIs $50k-75k, 67.6% for AGIs $75k-100k, 67.3% for AGIs $100k-200k, 80.9% for AGIs over 200k)
Averages for the 2004 tax year for zip code 91103, filed in 2005:
Average Adjusted Gross Income (AGI) in 2004: $61,266 (Individual Income Tax Returns)
Here:
$61,266
State:
$58,600
Salary/wage: $45,750 (reported on 83.8% of returns)
Here:
$45,750
State:
$49,455
(% of AGI for various income ranges: 101.0% for AGIs below $10k, 84.4% for AGIs $10k-25k, 86.1% for AGIs $25k-50k, 81.5% for AGIs $50k-75k, 76.2% for AGIs $75k-100k, 49.2% for AGIs over 100k)
Taxable interest for individuals: $2,372 (reported on 34.4% of returns)
This zip code:
$2,372
California:
$2,365
(% of AGI for various income ranges: 2.5% for AGIs below $10k, 0.7% for AGIs $10k-25k, 0.8% for AGIs $25k-50k, 1.2% for AGIs $50k-75k, 1.5% for AGIs $75k-100k, 1.5% for AGIs over 100k)
Taxable dividends: $8,647 (reported on 18.1% of returns)
Here:
$8,647
State:
$4,746
(% of AGI for various income ranges: 5.3% for AGIs below $10k, 1.0% for AGIs $10k-25k, 0.6% for AGIs $25k-50k, 1.5% for AGIs $50k-75k, 2.0% for AGIs $75k-100k, 3.4% for AGIs over 100k)
Net capital gain/loss: +$21,673 (reported on 15.6% of returns)
Here:
+$21,673
State:
+$23,418
(% of AGI for various income ranges: -1.9% for AGIs below $10k, 0.2% for AGIs $10k-25k, 0.6% for AGIs $25k-50k, 1.4% for AGIs $50k-75k, 2.8% for AGIs $75k-100k, 8.4% for AGIs over 100k)
Profit/loss from business: +$15,800 (reported on 19.0% of returns)
Here:
+$15,800
State:
+$16,826
(% of AGI for various income ranges: 20.0% for AGIs below $10k, 8.5% for AGIs $10k-25k, 3.6% for AGIs $25k-50k, 3.1% for AGIs $50k-75k, 3.8% for AGIs $75k-100k, 4.7% for AGIs over 100k)
IRA payment deduction: $2,578 (reported on 1.9% of returns)
91103:
$2,578
California:
$3,192
(% of AGI for various income ranges: 0.1% for AGIs $10k-25k, 0.1% for AGIs $25k-50k, 0.1% for AGIs $50k-75k, 0.2% for AGIs $75k-100k, 0.0% for AGIs over 100k)
Self-employed pension: $26,028 (reported on 1.8% of returns)
Here:
$26,028
California:
$17,688
(% of AGI for various income ranges: 0.2% for AGIs $25k-50k, 0.2% for AGIs $50k-75k, 0.6% for AGIs $75k-100k, 1.1% for AGIs over 100k)
Total itemized deductions: $33,434 (24% of AGI, reported on 34.9% of returns)
Here:
$33,434
State:
$28,113
Here:
24.3% of AGI
State:
25.3% of AGI
(% of AGI for various income ranges: 19.3% for AGIs below $10k, 10.0% for AGIs $10k-25k, 22.1% for AGIs $25k-50k, 24.7% for AGIs $50k-75k, 26.8% for AGIs $75k-100k, 18.0% for AGIs over 100k)
Charity contributions deductions: $4,910 (3% of AGI, reported on 31.3% of returns)
Here:
$4,910
State:
$3,923
Here:
3.3% of AGI
State:
3.3% of AGI
(% of AGI for various income ranges: 0.9% for AGIs below $10k, 0.8% for AGIs $10k-25k, 2.0% for AGIs $25k-50k, 2.9% for AGIs $50k-75k, 3.4% for AGIs $75k-100k, 2.7% for AGIs over 100k)
Total tax: $14,240 (reported on 65.8% of returns)
91103:
$14,240
State:
$10,761
(% of AGI for various income ranges: 5.1% for AGIs below $10k, 3.3% for AGIs $10k-25k, 5.3% for AGIs $25k-50k, 8.9% for AGIs $50k-75k, 10.5% for AGIs $75k-100k, 20.9% for AGIs over 100k)
Earned income credit: $2,076 (reported on 27.0% of returns)
Here:
$2,076
State:
$1,763
Percentage of individuals using paid preparers for their 2004 taxes: 72.8%
Here:
73%
State:
66%
(% for various income ranges: 65.1% for AGIs below $10k, 74.4% for AGIs $10k-25k, 75.0% for AGIs $25k-50k, 74.8% for AGIs $50k-75k, 71.0% for AGIs $75k-100k, 76.7% for AGIs over 100k)
Likely homosexual households (counted as self-reported same-sex unmarried-partner households)
Lesbian couples: 0.3% of all households
Gay men: 0.5% of all households
Household received Food Stamps/SNAP in the past 12 months: 1,690 Household did not receive Food Stamps/SNAP in the past 12 months: 7,357
Women who had a birth in the past 12 months: 354 (172 now married, 184 unmarried) Women who did not have a birth in the past 12 months: 6,314 (2,116 now married, 4,214 unmarried)
Housing units in zip code 91103 with a mortgage: 2,788 (321 second mortgage, 271 both second mortgage and home equity loan) Houses without a mortgage: 84
Median monthly owner costs for units with a mortgage: $3,155 Median monthly owner costs for units without a mortgage: $824
Residents with income below the poverty level in 2022:
This zip code:
19.6%
Whole state:
12.2%
Residents with income below 50% of the poverty level in 2022:
This zip code:
8.9%
Whole state:
6.2%
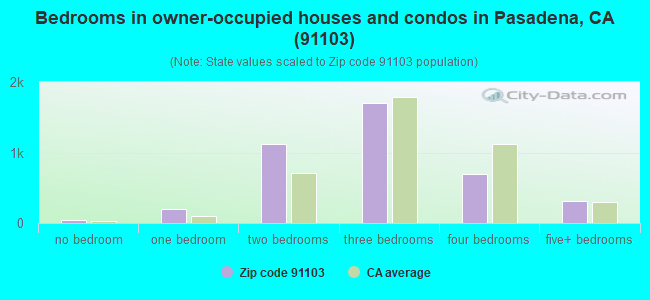
Median number of rooms in houses and condos:
Here:
5.7
State:
6.0
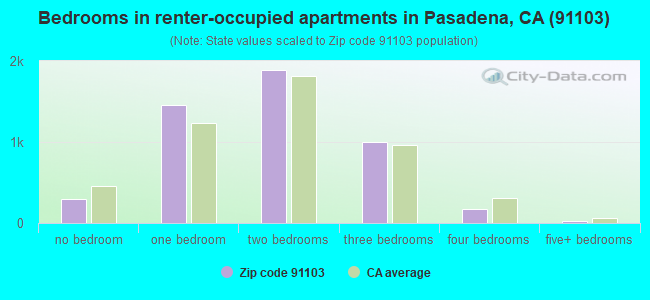
Median number of rooms in apartments:
Here:
3.9
State:
3.9
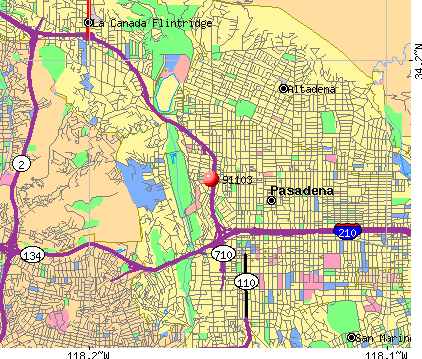
Notable locations in this zip code not listed on our city pages
Notable locations in zip code 91103: Rose Bowl (A), Oak Grove Ranger Station (B), Brookside Golf Course (C), Linda Vista Branch Pasadena Public Library (D), Rosemont Pavilion (E), Pasadena Historical Society Museum (F), Armory Center for the Arts (G), La Pintoresca Branch Pasadena Public Library (H), Cal - Care Ambulance Service (I), NASA Jet Propulsion Lab Fire Department (J), Pasadena Fire Department Station 38 (K), Pasadena Fire Department Station 36 (L), David B Gamble House (M). Display/hide their locations on the map
Churches in zip code 91103 include: Lincoln Avenue Presbyterian Church (A), Saint Andrews Roman Catholic Church (B), Church of Christ (C), Grace United Methodist Church (D), Lincoln Avenue Baptist Church (E), Lincoln Avenue Celestial Temple (F). Display/hide their locations on the map
Parks in zip code 91103 include: Brookside Park (1), Oak Grove Park (2), Brenner Park (3), La Pintoresca Park (4), Pasadena Memorial Park (5), Howard Park (6), Jackie Robinson Park (7), Rose Bowl Aquatic Center (8), Old Pasadena Historic District (9). Display/hide their locations on the map
2,643 married couples with children.
1,739 single-parent households (469 men, 1,270 women).
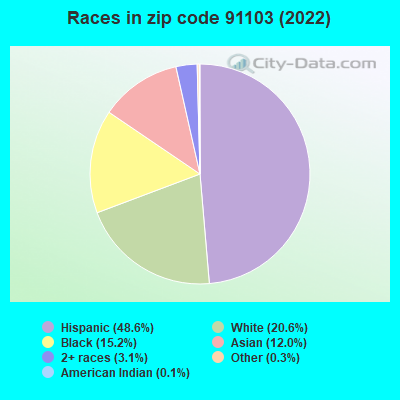
46.6% of residents of 91103 zip code speak English at home.
42.2% of residents speak Spanish at home (60% very well, 14% well, 19% not well, 7% not at all).
3.1% of residents speak other Indo-European language at home (79% very well, 11% well, 8% not well, 3% not at all).
7.8% of residents speak Asian or Pacific Island language at home (59% very well, 17% well, 17% not well, 7% not at all).
0.3% of residents speak other language at home (65% very well, 8% not well, 27% not at all).
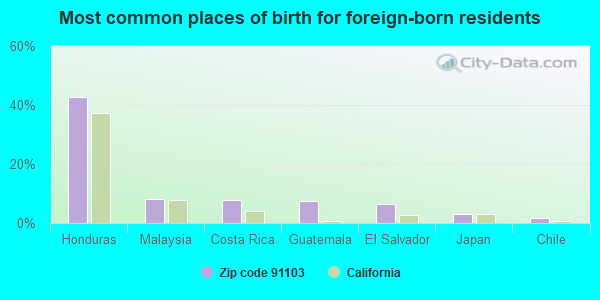
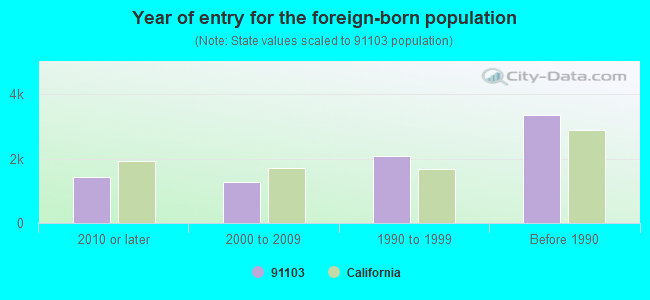
Foreign born population: 8,062 (29.9%) (51.4% of them are naturalized citizens)
Major facilities with environmental interests located in this zip code:
GROVER CLEVELAND ELEMENTARY SCHOOL (524 PALISADE ST in PASADENA, CA)
STATE MASTER (California - Hazardous Waste Tracking) - HAZARDOU WASTE PROGRAM (National Center for Education Statistics) - STATE ID-6021547 Small Quantity Generators, between 100 kg and 1000 kg of hazardous waste/month (Resource Conservation and Recovery Act (tracking hazardous waste)) - notification Organizations: PASADENA UNIFIED SCHOOL DIST (CONTACT/OWNER)
, PASADENA UNIFIED (SCHOOL DISTRICT)
EQUILON ENTERPRISES (200 N FAIR OAKS in PASADENA, CA) . Federal Facility
STATE MASTER (California - Hazardous Waste Tracking) - HAZARDOU WASTE PROGRAM Large Quantity Generators, more that 1000 kg of hazardous waste/month (Resource Conservation and Recovery Act (tracking hazardous waste)) Organizations: SHELL OIL PRODUCTS US (CONTACT/OPERATOR)
, EQUILON ENTERPRISES LLC (CONTACT/OWNER)
Alternative names: SHELL OIL CO
L A STEELCRAFT PRODUCTS INCORPORATED (1974 LINCOLN AVENUE in PASADENA, CA)
AIR MAJOR (AIRS/AFS) (Integrated Compliance Information System) - ICIS-09-1999-0098, FORMAL ENFORCEMENT ACTION, ICIS-09-2000-0378, COMPLIANCE ACTIVITY (Tracking inspections of insecticide, fungicide, and rodenticide, and toxic substances) CRITERIA AND HAZARDOUS AIR POLLUTANT INVENTORY (Inventory of air pollution sources) TRI REPORTER (Tracking of toxic chemicals releasing facilities) Business SIC classification: METAL HOUSEHOLD FURNITURE; SPORTING AND ATHLETIC GOODS Alternative names: L.A. STEELCRAFTS PRODUCTS, LA STEELCRAFT PRODUCTS
LINDA VISTA ELEMENTARY (1259 LINDA VISTA AVE. in PASADENA, CA)
(National Center for Education Statistics) - STATE ID-6021653 Organizations: PASADENA UNIFIED (SCHOOL DISTRICT)
MUIR HIGH (1905 LINCOLN AVE. in PASADENA, CA)
(National Center for Education Statistics) - STATE ID-1936103 Organizations: PASADENA UNIFIED (SCHOOL DISTRICT)
F D DANCY YOUTH ACADEMY (1840 N RAYMOND AVE in PASADENA, CA)
COMPLIANCE ACTIVITY (Tracking inspections of insecticide, fungicide, and rodenticide, and toxic substances)
HAMPTON VIRGIL L TRUCKING (262 MACDONALD ST in PASADENA, CA)
TRANSPORTER (Resource Conservation and Recovery Act (tracking hazardous waste)) Organizations: VIRGIL L HAMPTON (CONTACT/OWNER)
KGS ELECTRONICS (2029 LINCOLN AVE in PASADENA, CA)
Small Quantity Generators, between 100 kg and 1000 kg of hazardous waste/month (Resource Conservation and Recovery Act (tracking hazardous waste)) Organizations: GEORGE K SUGIMOTO (CONTACT/OWNER)
MORGAN'S REFINISHING (880 N FAIR OAKS AVE in PASADENA, CA)
Small Quantity Generators, between 100 kg and 1000 kg of hazardous waste/month (Resource Conservation and Recovery Act (tracking hazardous waste)) - notification Organizations: MOUNTAIN FAIR ASSOC (CONTACT/OWNER)
EMBREE BUSES (1600 LINCOLN AVE in PASADENA, CA)
Small Quantity Generators, between 100 kg and 1000 kg of hazardous waste/month (Resource Conservation and Recovery Act (tracking hazardous waste)) - notification Organizations: JAY F MANNINO (CONTACT/OWNER)
FOOTHILL WORKSHOP (789 NORTH FAIR OAKS AVE in PASADENA, CA)
Small Quantity Generators, between 100 kg and 1000 kg of hazardous waste/month (Resource Conservation and Recovery Act (tracking hazardous waste))
LINCOLN INSTRUMENTS INC (456 W MONTANA ST in PASADENA, CA)
Small Quantity Generators, between 100 kg and 1000 kg of hazardous waste/month (Resource Conservation and Recovery Act (tracking hazardous waste)) Business NAICS classification: OTHER ELECTRONIC COMPONENT MANUFACTURING.
NORTHWEST COMMUNITY SCHOOL (1415 N RAYMOND AVE in PASADENA, CA)
COMPLIANCE ACTIVITY (Tracking inspections of insecticide, fungicide, and rodenticide, and toxic substances)
Housing units lacking complete plumbing facilities: 0.4% Housing units lacking complete kitchen facilities: 1.6%
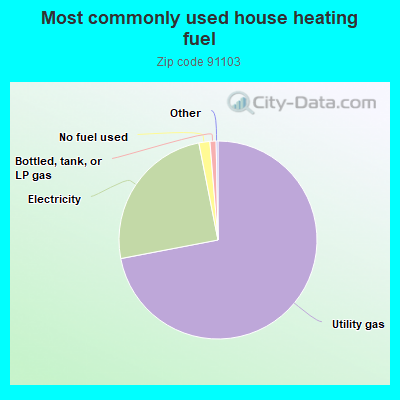
72.0%Utility gas
24.9%Electricity
1.8%No fuel used
1.0%Bottled, tank, or LP gas
Population in 1990: 26,641. Population change in the 1990s: +1,246 (+4.7%).
Place of birth for U.S.-born residents:
This state: 14,991
Northeast: 691
Midwest: 912
South: 1,480
West: 594
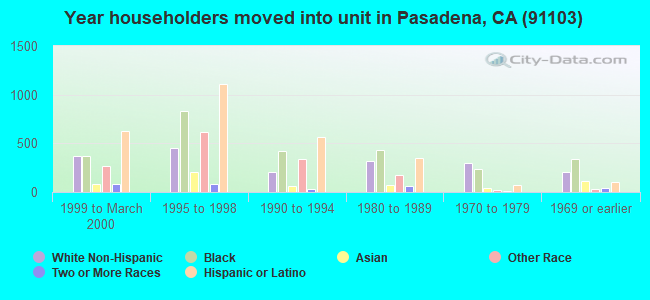
60% of the 91103 zip code residents lived in the same house 5 years ago. Out of people who lived in different houses, 86% lived in this county. Out of people who lived in different counties, 50% lived in California.
91% of the 91103 zip code residents lived in the same house 1 year ago. Out of people who lived in different houses, 68% moved from this county. Out of people who lived in different houses, 7% moved from different county within same state. Out of people who lived in different houses, 12% moved from different state. Out of people who lived in different houses, 14% moved from abroad.
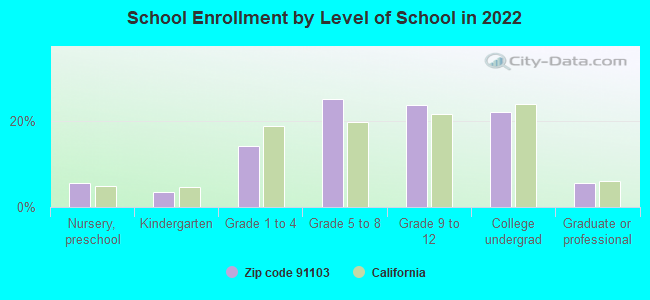
Private vs. public school enrollment:
Students in private schools in grades 1 to 8 (elementary and middle school): 582
Here:
22.2%
California:
10.5%
Students in private schools in grades 9 to 12 (high school): 150
Here:
9.7%
California:
8.5%
Students in private undergraduate colleges: 314
Here:
21.7%
California:
15.9%
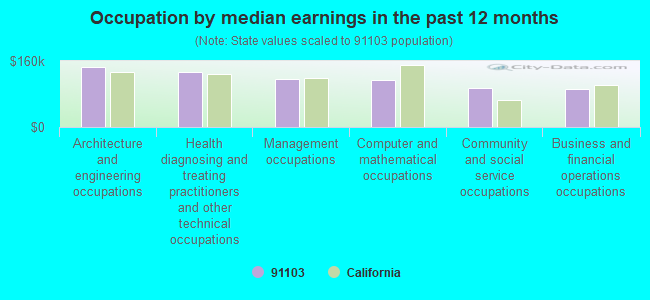
Occupation by median earnings in the past 12 months ($)
146,150Architecture and engineering occupations
133,703Health diagnosing and treating practitioners and other technical occupations
115,497Management occupations
114,510Computer and mathematical occupations
95,090Community and social service occupations
91,004Business and financial operations occupations
Companies with federal contracts located in this zip code (PASADENA, CA):
ALLIANCE SPACESYSTEMS INC (1250 LINCOLN AVE , SUITE 1; small business) : $576,920 in 9 contractsfrom 2005 to 2006
Contracts for Aeronautics and Space Technology -- Basic Research (R&D), Aeronautic/Space Studies by NASA, Navy Signed by year:2000: $0; 2001: $0; 2002: $0; 2003: $0; 2004: $0; 2005: $331,920; 2006: $245,000.
Biggest contracts:
$190,000 with NASA for Aeronautics and Space Technology -- Basic Research (R&D). Signed on 2005-09-20. Completion date: 2006-01-22.
$125,000, same as above.Signed on 2006-02-17. Completion date: 2007-02-22.
$81,920, same as above.Signed on 2005-06-13. Completion date: 2006-01-22.
$60,000, same as above.Signed on 2005-03-23. Completion date: 2006-01-22.
GEORGE L THROOP CO (444 N FAIR OAKS AVE; small business) : $248,619 in 6 contractsfrom 2004 to 2005
Contracts for Miscellaneous Construction Materials, Miscellaneous Construction Equipment by Army Signed by year:2000: $0; 2001: $0; 2002: $0; 2003: $0; 2004: $242,737; 2005: $5,882; 2006: $0.
Biggest contracts:
$91,037 with Army for Miscellaneous Construction Materials. Signed on 2004-07-02. Completion date: 2004-07-12.
$65,780 with Army for Miscellaneous Construction Equipment. Signed on 2004-09-28. Completion date: 2004-11-27.
$45,755, same as above.Signed on 2004-10-08. Completion date: 2004-10-29.
$40,165, same as above.Signed on 2004-12-17. Completion date: 2004-12-03.
DIAMOND CONTRACT SERVICES, INC (898 NORTH FAIR OAKS AVENUE; small business) : $65,107 in 3 contractsfrom 2004 to 2006
$22,061 with Navy for Custodial Janitorial Services. Signed on 2006-02-16. Completion date: 2004-10-01.
$21,523, same as above.Signed on 2004-12-02. Completion date: 2004-10-01.
$21,523, same as above.Signed on 2004-09-13. Completion date: 2004-10-01.
MODELS AND PROPS, INC (1725 N MARENGO AVE; small business) : $54,396 in 3 contractsfrom 2005 to 2006
$32,678 with Navy for Restoration. Signed on 2006-02-22. Completion date: 2005-12-12.
$21,718, same as above.Signed on 2005-12-08. Completion date: 2005-12-12.
$0, same as above.Signed on 2005-12-08. Completion date: 2005-12-12.
MANDEL & ADRIANO (35 NORTH ARROYO PARKWAY; small business)
$33,000 with Department of Veterans Affairs for Patent and Trademark Services. Signed on 2003-11-28. Completion date: 2004-09-30.
Top industries in this zip code by the number of employees in 2005:
2005 - 2018 National Fire Incident Reporting System (NFIRS) incidents
Based on the data from the years 2005 - 2018 the average number of fires per year is 58. The highest number of reported fires - 80 took place in 2005, and the least - 44 in 2018. The data has a dropping trend.
When looking into fire subcategories, the most reports belonged to: Structure Fires (44.0%), and Outside Fires (27.7%).
Fire incident types reported to NFIRS in Zip Code 91103


 Nearest zip codes: 91105, 91101, 91001, 91104, 91106, 91206.


 Based on the data from the years 2005 - 2018 the average number of fires per year is 58. The highest number of reported fires - 80 took place in 2005, and the least - 44 in 2018. The data has a dropping trend.
 When looking into fire subcategories, the most reports belonged to: Structure Fires (44.0%), and Outside Fires (27.7%).