Estimated zip code population in 2022: 20,737 Zip code population in 2010: 20,372 Zip code population in 2000: 18,748
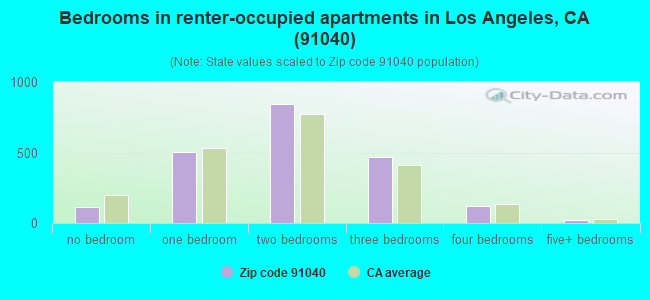
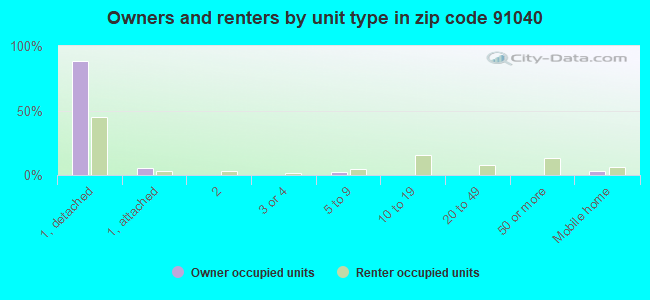
Houses and condos: 8,120 Renter-occupied apartments: 2,074
% of renters here:
28%
State:
44%
March 2022 cost of living index in zip code 91040: 132.9 (high, U.S. average is 100)
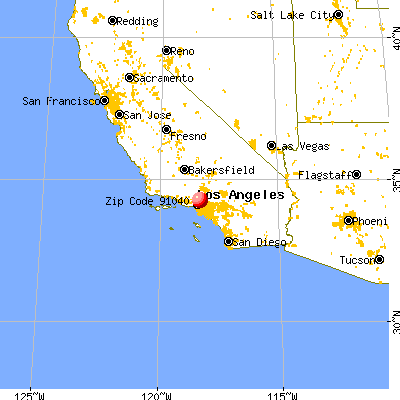
Land area: 8.2 sq. mi. Water area: 0.0 sq. mi.
Population density: 2,528 people per square mile
(average).
OSM Map
General Map
Google Map
MSN Map
OSM Map
General Map
Google Map
MSN Map
OSM Map
General Map
Google Map
MSN Map
OSM Map
General Map
Google Map
MSN Map
Please wait while loading the map...
Real estate property taxes paid for housing units in 2022:
This zip code:
0.7% ($5,406)
California:
0.7% ($4,831)
Median real estate property taxes paid for housing units with mortgages in 2022: $6,044 (0.8%) Median real estate property taxes paid for housing units with no mortgage in 2022: $3,617 (0.4%)
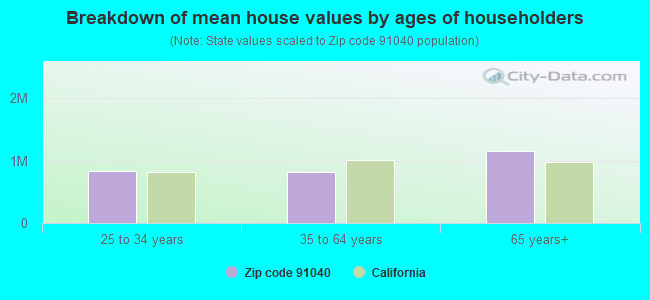
Estimated median house/condo value in 2022: $802,334
91040:
$802,334
California:
$715,900
According to our research of California and other state lists, there were 15 registered sex offenders living in 91040 zip code as of May 04, 2024. The ratio of all residents to sex offenders in zip code 91040 is 1,324 to 1. The ratio of registered sex offenders to all residents in this zip code is lower than the state average.
Median resident age:
This zip code:
44.3 years
California median age:
37.9 years
Average household size:
This zip code:
2.7 people
California:
2.8 people
Averages for the 2020 tax year for zip code 91040, filed in 2021:
Average Adjusted Gross Income (AGI) in 2020: $73,991 (Individual Income Tax Returns)
Here:
$73,991
State:
$95,910
Salary/wage: $66,151 (reported on 77.5% of returns)
Here:
$66,151
State:
$77,331
(% of AGI for various income ranges: 1199.8% for AGIs below $25k, 3984.9% for AGIs $25k-50k, 7598.8% for AGIs $50k-75k, 11262.3% for AGIs $75k-100k, 21939.6% for AGIs $100k-200k, 76134.4% for AGIs over 200k)
Taxable interest for individuals: $1,069 (reported on 40.3% of returns)
This zip code:
$1,069
California:
$2,294
(% of AGI for various income ranges: 22.1% for AGIs below $25k, 26.8% for AGIs $25k-50k, 69.7% for AGIs $50k-75k, 81.3% for AGIs $75k-100k, 114.7% for AGIs $100k-200k, 955.0% for AGIs over 200k)
Ordinary dividends: $4,554 (reported on 18.1% of returns)
Here:
$4,554
State:
$10,949
(% of AGI for various income ranges: 28.2% for AGIs below $25k, 27.9% for AGIs $25k-50k, 63.3% for AGIs $50k-75k, 102.1% for AGIs $75k-100k, 278.8% for AGIs $100k-200k, 2486.2% for AGIs over 200k)
Net capital gain/loss in AGI: +$13,305 (reported on 18.2% of returns)
Here:
+$13,305
State:
+$49,306
(% of AGI for various income ranges: 7.7% for AGIs below $25k, 43.6% for AGIs $25k-50k, 89.3% for AGIs $50k-75k, 233.9% for AGIs $75k-100k, 511.8% for AGIs $100k-200k, 10878.8% for AGIs over 200k)
Profit/loss from business: +$11,918 (reported on 26.2% of returns)
Here:
+$11,918
State:
+$15,671
(% of AGI for various income ranges: 305.6% for AGIs below $25k, 365.6% for AGIs $25k-50k, 371.6% for AGIs $50k-75k, 560.7% for AGIs $75k-100k, 1196.4% for AGIs $100k-200k, 2771.2% for AGIs over 200k)
Taxable individual retirement arrangement distribution: $18,170 (reported on 6.6% of returns)
91040:
$18,170
California:
$23,505
(% of AGI for various income ranges: 46.3% for AGIs below $25k, 101.8% for AGIs $25k-50k, 188.2% for AGIs $50k-75k, 261.3% for AGIs $75k-100k, 482.4% for AGIs $100k-200k, 1581.2% for AGIs over 200k)
Self-employed (Keogh) retirement plans: $18,250 (reported on 0.4% of returns)
91040:
$18,250
California:
$30,163
(% of AGI for various income ranges: 85.9% for AGIs $100k-200k)
Total itemized deductions: $33,134 (reported on 22.2% of returns)
Here:
$33,134
State:
$39,517
(% of AGI for various income ranges: 173.5% for AGIs below $25k, 385.4% for AGIs $25k-50k, 1015.3% for AGIs $50k-75k, 1670.3% for AGIs $75k-100k, 3522.4% for AGIs $100k-200k, 10878.8% for AGIs over 200k)
Charity contributions: $6,670 (reported on 18.2% of returns)
Here:
$6,670
State:
$12,598
(% of AGI for various income ranges: 7.8% for AGIs below $25k, 34.5% for AGIs $25k-50k, 101.2% for AGIs $50k-75k, 208.5% for AGIs $75k-100k, 514.1% for AGIs $100k-200k, 3262.5% for AGIs over 200k)
Taxes paid: $8,727 (reported on 22.2% of returns)
91040:
$8,727
State:
$8,807
(% of AGI for various income ranges: 33.3% for AGIs below $25k, 101.4% for AGIs $25k-50k, 279.5% for AGIs $50k-75k, 525.7% for AGIs $75k-100k, 1006.9% for AGIs $100k-200k, 2183.1% for AGIs over 200k)
Earned income credit: $1,547 (reported on 12.3% of returns)
Here:
$1,547
State:
$2,074
(% of AGI for various income ranges: 68.2% for AGIs below $25k, 55.1% for AGIs $25k-50k)
Percentage of individuals using paid preparers for their 2020 taxes: 92.8%
Here:
93%
State:
92%
(% for various income ranges: 91.3% for AGIs below $25k, 92.8% for AGIs $25k-50k, 94.0% for AGIs $50k-75k, 94.3% for AGIs $75k-100k, 93.0% for AGIs $100k-200k, 93.2% for AGIs over 200k)
Averages for the 2012 tax year for zip code 91040, filed in 2013:
Average Adjusted Gross Income (AGI) in 2012: $61,762 (Individual Income Tax Returns)
Here:
$61,762
State:
$72,726
Salary/wage: $56,764 (reported on 81.4% of returns)
Here:
$56,764
State:
$59,079
(% of AGI for various income ranges: 67.3% for AGIs below $25k, 76.0% for AGIs $25k-50k, 76.6% for AGIs $50k-75k, 80.4% for AGIs $75k-100k, 80.2% for AGIs $100k-200k, 61.9% for AGIs over 200k)
Taxable interest for individuals: $1,344 (reported on 39.5% of returns)
This zip code:
$1,344
California:
$2,146
(% of AGI for various income ranges: 1.2% for AGIs below $25k, 0.6% for AGIs $25k-50k, 0.6% for AGIs $50k-75k, 0.8% for AGIs $75k-100k, 0.5% for AGIs $100k-200k, 1.7% for AGIs over 200k)
Ordinary dividends: $4,087 (reported on 16.4% of returns)
Here:
$4,087
State:
$9,308
(% of AGI for various income ranges: 1.1% for AGIs below $25k, 0.8% for AGIs $25k-50k, 0.8% for AGIs $50k-75k, 0.6% for AGIs $75k-100k, 0.6% for AGIs $100k-200k, 2.7% for AGIs over 200k)
Net capital gain/loss in AGI: +$4,489 (reported on 14.3% of returns)
Here:
+$4,489
State:
+$30,460
(% of AGI for various income ranges: 0.2% for AGIs $50k-75k, 0.6% for AGIs $100k-200k, 4.7% for AGIs over 200k)
Profit/loss from business: +$13,523 (reported on 23.1% of returns)
Here:
+$13,523
State:
+$17,064
(% of AGI for various income ranges: 15.6% for AGIs below $25k, 6.9% for AGIs $25k-50k, 5.3% for AGIs $50k-75k, 3.7% for AGIs $75k-100k, 3.1% for AGIs $100k-200k, 4.0% for AGIs over 200k)
Taxable individual retirement arrangement distribution: $13,987 (reported on 7.9% of returns)
91040:
$13,987
California:
$19,557
(% of AGI for various income ranges: 2.5% for AGIs below $25k, 2.3% for AGIs $25k-50k, 2.3% for AGIs $50k-75k, 1.3% for AGIs $75k-100k, 1.7% for AGIs $100k-200k, 1.3% for AGIs over 200k)
Self-employment retirement plans: $19,250 (reported on 0.6% of returns)
91040:
$19,250
California:
$24,530
Total itemized deductions: $27,648 (27% of AGI, reported on 45.2% of returns)
Here:
$27,648
State:
$34,004
Here:
27.4% of AGI
State:
22.7% of AGI
(% of AGI for various income ranges: 17.0% for AGIs below $25k, 17.1% for AGIs $25k-50k, 20.7% for AGIs $50k-75k, 22.9% for AGIs $75k-100k, 21.9% for AGIs $100k-200k, 18.3% for AGIs over 200k)
Charity contributions: $3,490 (reported on 36.8% of returns)
Here:
$3,490
State:
$4,659
(% of AGI for various income ranges: 1.1% for AGIs below $25k, 1.2% for AGIs $25k-50k, 1.9% for AGIs $50k-75k, 2.0% for AGIs $75k-100k, 2.3% for AGIs $100k-200k, 2.8% for AGIs over 200k)
Taxes paid: $9,784 (reported on 44.8% of returns)
91040:
$9,784
State:
$14,448
(% of AGI for various income ranges: 3.7% for AGIs below $25k, 4.1% for AGIs $25k-50k, 5.9% for AGIs $50k-75k, 7.0% for AGIs $75k-100k, 8.1% for AGIs $100k-200k, 9.7% for AGIs over 200k)
Earned income credit: $1,900 (reported on 15.2% of returns)
Here:
$1,900
State:
$2,286
(% of AGI for various income ranges: 5.0% for AGIs below $25k, 0.9% for AGIs $25k-50k)
Percentage of individuals using paid preparers for their 2012 taxes: 70.1%
Here:
70%
State:
64%
(% for various income ranges: 65.3% for AGIs below $25k, 71.4% for AGIs $25k-50k, 70.8% for AGIs $50k-75k, 72.4% for AGIs $75k-100k, 74.6% for AGIs $100k-200k, 85.2% for AGIs over 200k)
Averages for the 2004 tax year for zip code 91040, filed in 2005:
Average Adjusted Gross Income (AGI) in 2004: $53,345 (Individual Income Tax Returns)
Here:
$53,345
State:
$58,600
Salary/wage: $49,805 (reported on 81.9% of returns)
Here:
$49,805
State:
$49,455
(% of AGI for various income ranges: 155.9% for AGIs below $10k, 70.0% for AGIs $10k-25k, 79.9% for AGIs $25k-50k, 81.7% for AGIs $50k-75k, 84.0% for AGIs $75k-100k, 69.0% for AGIs over 100k)
Taxable interest for individuals: $1,435 (reported on 51.8% of returns)
This zip code:
$1,435
California:
$2,365
(% of AGI for various income ranges: 10.1% for AGIs below $10k, 2.1% for AGIs $10k-25k, 1.1% for AGIs $25k-50k, 0.9% for AGIs $50k-75k, 0.9% for AGIs $75k-100k, 1.6% for AGIs over 100k)
Taxable dividends: $1,992 (reported on 21.8% of returns)
Here:
$1,992
State:
$4,746
(% of AGI for various income ranges: 5.0% for AGIs below $10k, 1.2% for AGIs $10k-25k, 0.6% for AGIs $25k-50k, 0.6% for AGIs $50k-75k, 0.6% for AGIs $75k-100k, 1.0% for AGIs over 100k)
Net capital gain/loss: +$13,647 (reported on 18.2% of returns)
Here:
+$13,647
State:
+$23,418
(% of AGI for various income ranges: -1.6% for AGIs below $10k, 0.1% for AGIs $10k-25k, 0.3% for AGIs $25k-50k, 0.8% for AGIs $50k-75k, 0.9% for AGIs $75k-100k, 10.6% for AGIs over 100k)
Profit/loss from business: +$12,546 (reported on 23.6% of returns)
Here:
+$12,546
State:
+$16,826
(% of AGI for various income ranges: 24.2% for AGIs below $10k, 12.4% for AGIs $10k-25k, 7.6% for AGIs $25k-50k, 4.7% for AGIs $50k-75k, 4.6% for AGIs $75k-100k, 4.1% for AGIs over 100k)
IRA payment deduction: $3,335 (reported on 3.1% of returns)
91040:
$3,335
California:
$3,192
(% of AGI for various income ranges: 0.2% for AGIs $10k-25k, 0.2% for AGIs $25k-50k, 0.2% for AGIs $50k-75k, 0.2% for AGIs $75k-100k, 0.2% for AGIs over 100k)
Self-employed pension: $12,881 (reported on 1.2% of returns)
Here:
$12,881
California:
$17,688
(% of AGI for various income ranges: 0.2% for AGIs $25k-50k, 0.2% for AGIs $50k-75k, 0.3% for AGIs $75k-100k, 0.5% for AGIs over 100k)
Total itemized deductions: $24,789 (30% of AGI, reported on 49.7% of returns)
Here:
$24,789
State:
$28,113
Here:
29.7% of AGI
State:
25.3% of AGI
(% of AGI for various income ranges: 57.9% for AGIs below $10k, 17.8% for AGIs $10k-25k, 22.7% for AGIs $25k-50k, 28.1% for AGIs $50k-75k, 25.5% for AGIs $75k-100k, 20.1% for AGIs over 100k)
Charity contributions deductions: $3,574 (4% of AGI, reported on 43.7% of returns)
Here:
$3,574
State:
$3,923
Here:
4.1% of AGI
State:
3.3% of AGI
(% of AGI for various income ranges: 1.7% for AGIs below $10k, 1.6% for AGIs $10k-25k, 2.3% for AGIs $25k-50k, 2.7% for AGIs $50k-75k, 3.0% for AGIs $75k-100k, 3.5% for AGIs over 100k)
Total tax: $7,677 (reported on 80.7% of returns)
91040:
$7,677
State:
$10,761
(% of AGI for various income ranges: 7.9% for AGIs below $10k, 5.2% for AGIs $10k-25k, 7.1% for AGIs $25k-50k, 8.8% for AGIs $50k-75k, 10.0% for AGIs $75k-100k, 16.5% for AGIs over 100k)
Earned income credit: $1,485 (reported on 11.8% of returns)
Here:
$1,485
State:
$1,763
Percentage of individuals using paid preparers for their 2004 taxes: 71.0%
Here:
71%
State:
66%
(% for various income ranges: 62.6% for AGIs below $10k, 67.4% for AGIs $10k-25k, 71.9% for AGIs $25k-50k, 75.0% for AGIs $50k-75k, 75.2% for AGIs $75k-100k, 78.3% for AGIs over 100k)
Likely homosexual households (counted as self-reported same-sex unmarried-partner households)
Lesbian couples: 0.2% of all households
Gay men: 0.3% of all households
Household received Food Stamps/SNAP in the past 12 months: 631 Household did not receive Food Stamps/SNAP in the past 12 months: 6,812
Women who had a birth in the past 12 months: 381 (375 now married, 4 unmarried) Women who did not have a birth in the past 12 months: 3,813 (1,512 now married, 2,300 unmarried)
Housing units in zip code 91040 with a mortgage: 3,745 (433 second mortgage, 2 home equity loan, 390 both second mortgage and home equity loan) Houses without a mortgage: 54
Median monthly owner costs for units with a mortgage: $2,958 Median monthly owner costs for units without a mortgage: $902
Residents with income below the poverty level in 2022:
This zip code:
6.8%
Whole state:
12.2%
Residents with income below 50% of the poverty level in 2022:
This zip code:
2.8%
Whole state:
6.2%
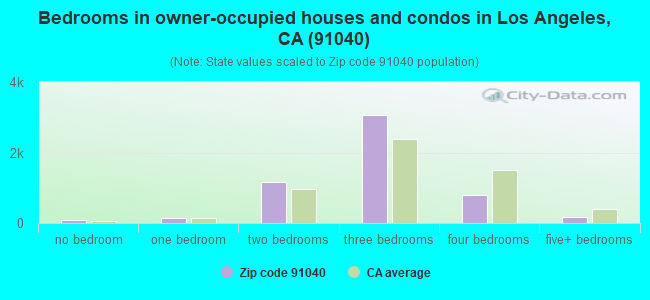
Median number of rooms in houses and condos:
Here:
5.7
State:
6.0
Median number of rooms in apartments:
Here:
4.2
State:
3.9
Notable locations in this zip code not listed on our city pages
Churches in zip code 91040 include: Shadow Hills Gospel Hall (A), Church of Jesus Christ of Latter Day Saints (B), First Baptist Church of Sunland (C), Shadow Hills Presbyterian Church (D), Wesleyan Church (E). Display/hide their locations on the map
In group quarters: 481 (-1 institutionalized population)
Size of family households: 1,924 2-persons, 1,626 3-persons, 987 4-persons, 415 5-persons, 261 6-persons, 53 7-or-more-persons
Size of nonfamily households: 1,824 1-person, 412 2-persons, 6 3-persons
2,791 married couples with children.
597 single-parent households (222 men, 375 women).
57.6% of residents of 91040 zip code speak English at home.
14.3% of residents speak Spanish at home (65% very well, 24% well, 8% not well, 3% not at all).
23.1% of residents speak other Indo-European language at home (63% very well, 18% well, 15% not well, 3% not at all).
5.2% of residents speak Asian or Pacific Island language at home (48% very well, 29% well, 18% not well, 4% not at all).
0.5% of residents speak other language at home (71% very well, 10% well, 4% not well, 15% not at all).
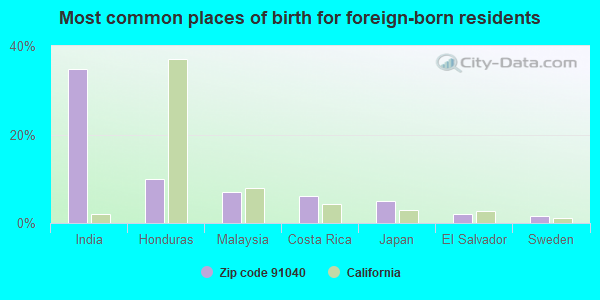
Foreign born population: 6,403 (30.9%) (80.1% of them are naturalized citizens)
This zip code:
30.9%
Whole state:
26.7%
35%India
10%Honduras
7%Malaysia
6%Costa Rica
5%Japan
2%El Salvador
2%Sweden
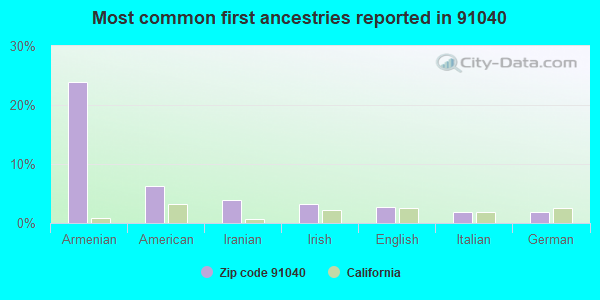
24%Armenian
6%American
4%Iranian
3%Irish
3%English
2%Italian
2%German
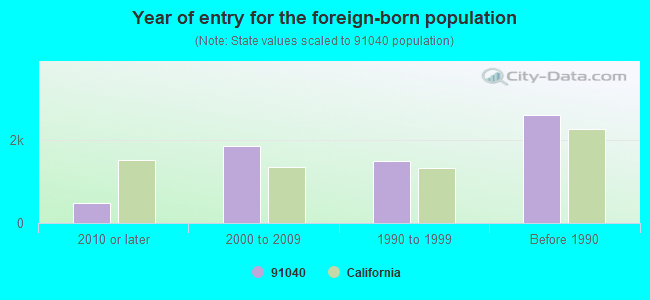
Year of entry for the foreign-born population
4722010 or later
1,8652000 to 2009
1,5101990 to 1999
2,612Before 1990
Facilities with environmental interests located in this zip code:
KENNYS CLEANERS (8427 FOOTHILL BLVD in SUNLAND, CA)
STATE MASTER (California - Hazardous Waste Tracking) - HAZARDOU WASTE PROGRAM Small Quantity Generators, between 100 kg and 1000 kg of hazardous waste/month (Resource Conservation and Recovery Act (tracking hazardous waste)) - notification Organizations: SUNG YUL PARK (CONTACT/OWNER)
Alternative names: KENNEYS CLEANERS
LA FIRE STATION 24 (9411 WENTWORTH ST in SUNLAND, CA)
STATE MASTER (California - Hazardous Waste Tracking) - HAZARDOU WASTE PROGRAM Small Quantity Generators, between 100 kg and 1000 kg of hazardous waste/month (Resource Conservation and Recovery Act (tracking hazardous waste)) - notification Organizations: CITY OF LA (CONTACT/OWNER)
Alternative names: CITY OF LA GENERAL SERVICES
LA SUNLAND TUJUNGA ST MAINT YARD (9401 WENTWORTH ST in SUNLAND, CA)
STATE MASTER (California - Hazardous Waste Tracking) - HAZARDOU WASTE PROGRAM Small Quantity Generators, between 100 kg and 1000 kg of hazardous waste/month (Resource Conservation and Recovery Act (tracking hazardous waste)) - notification Organizations: CITY OF LOS ANGELES (CONTACT/OWNER)
Alternative names: CITY OF LA SUNLAND JUJUNGA ST MAIN YARD
CHEVRON STATION NO 94108 (8404 FOOTHILL BLVD in SUNLAND, CA)
STATE MASTER (California - Hazardous Waste Tracking) - HAZARDOU WASTE PROGRAM Small Quantity Generators, between 100 kg and 1000 kg of hazardous waste/month (Resource Conservation and Recovery Act (tracking hazardous waste)) - notification Organizations: CHEVRON PRODUCTS CO (CONTACT/OWNER)
MT. GLEASON MIDDLE (10965 MT. GLEASON AVE. in SUNLAND, CA)
(National Center for Education Statistics) - STATE ID-6058168 Organizations: LOS ANGELES UNIFIED (SCHOOL DISTRICT)
CAROLYNS CROWN CLEANERS (8660 FOOTHILL BLVD in SUNLAND, CA)
Small Quantity Generators, between 100 kg and 1000 kg of hazardous waste/month (Resource Conservation and Recovery Act (tracking hazardous waste)) Small Quantity Generators, between 100 kg and 1000 kg of hazardous waste/month (Resource Conservation and Recovery Act (tracking hazardous waste)) Organizations: CAROLYN VARIAN (CONTACT/OWNER)
LAUSD--APPERSON ST. ES (10233 WOODWARD AVE. in SUNLAND, CA)
Large Quantity Generators, more that 1000 kg of hazardous waste/month (Resource Conservation and Recovery Act (tracking hazardous waste)) Alternative names: APPERSON STREET ELEMENTARY
KMART NO 3274 (8040 FOOTHILL BLVD in SUNLAND, CA)
Small Quantity Generators, between 100 kg and 1000 kg of hazardous waste/month (Resource Conservation and Recovery Act (tracking hazardous waste)) - notification Organizations: KMART CORP (CONTACT/OWNER)
MARIOS AUTO BODY CENTER (8220 FOOTHILL BLVD in SUNLAND, CA)
Small Quantity Generators, between 100 kg and 1000 kg of hazardous waste/month (Resource Conservation and Recovery Act (tracking hazardous waste)) - notification Organizations: CHARLES ROMAN (CONTACT/OWNER)
CHAPEL OF THE HILLS MONTESSORI (P O BOX 488 in SUNLAND, CA)
COMPLIANCE ACTIVITY (Tracking inspections of insecticide, fungicide, and rodenticide, and toxic substances)
Housing units lacking complete plumbing facilities: 1.3% Housing units lacking complete kitchen facilities: 1.3%
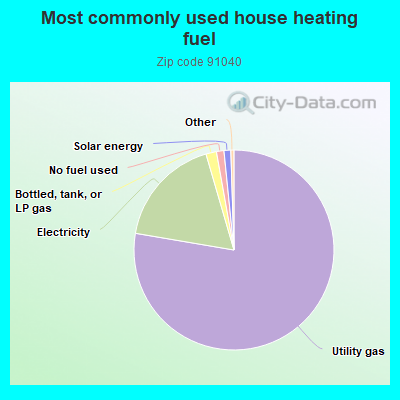
77.6%Utility gas
17.8%Electricity
1.7%Bottled, tank, or LP gas
1.2%No fuel used
1.1%Solar energy
Population in 1990: 18,303. Population change in the 1990s: +445 (+2.4%).
Place of birth for U.S.-born residents:
This state: 11,184
Northeast: 764
Midwest: 1,014
South: 664
West: 468
58% of the 91040 zip code residents lived in the same house 5 years ago. Out of people who lived in different houses, 87% lived in this county. Out of people who lived in different counties, 50% lived in California.
93% of the 91040 zip code residents lived in the same house 1 year ago. Out of people who lived in different houses, 78% moved from this county. Out of people who lived in different houses, 8% moved from different county within same state. Out of people who lived in different houses, 11% moved from different state. Out of people who lived in different houses, 3% moved from abroad.
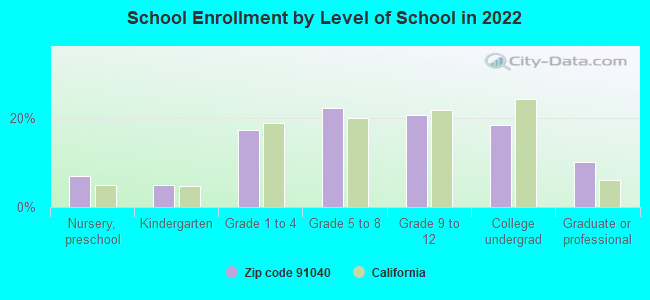
Private vs. public school enrollment:
Students in private schools in grades 1 to 8 (elementary and middle school): 433
Here:
25.9%
California:
10.5%
Students in private schools in grades 9 to 12 (high school): 212
Here:
24.7%
California:
8.5%
Students in private undergraduate colleges: 163
Here:
21.2%
California:
15.9%
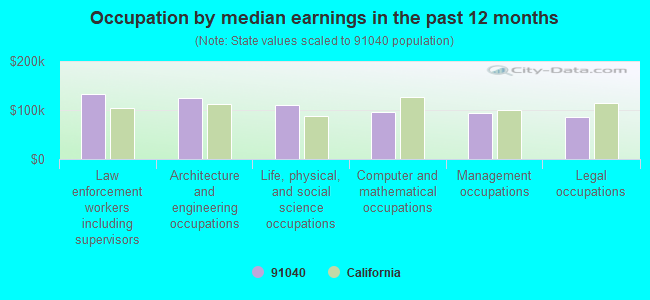
Occupation by median earnings in the past 12 months ($)
133,891Law enforcement workers including supervisors
125,276Architecture and engineering occupations
111,181Life, physical, and social science occupations
95,302Computer and mathematical occupations
94,478Management occupations
86,803Legal occupations
Companies with federal contracts located in this zip code:
AMERICAN EAGLE CONTRACTING INC (8226 DAY ST in SUNLAND, CA; small business) : $227,350 in 5 contractsfrom 2002 to 2003
Contracts for Maintenance, Repair or Alteration of Real Property -- Dining Facilities, Installation of Equipment -- Miscellaneous, Building Components, Prefabricated by Air Force, Drug Enforcement Administration, National Park Service Signed by year:2000: $0; 2001: $0; 2002: $117,000; 2003: $110,350; 2004: $0; 2005: $0; 2006: $0.
Biggest contracts:
$96,440 with Air Force for Maintenance, Repair or Alteration of Real Property -- Dining Facilities. Taking place in NM. Signed on 2003-03-07. Completion date: 2003-06-16.
$85,000 with Drug Enforcement Administration for Installation of Equipment -- Miscellaneous. Taking place in TN. Signed on 2002-07-15. Completion date: 2002-09-15.
$25,000 with National Park Service for Building Components, Prefabricated. Signed on 2002-07-15. Completion date: 2002-08-15.
$13,910 with Air Force for Maintenance, Repair or Alteration of Real Property -- Dining Facilities. Taking place in NM. Signed on 2003-07-29. Completion date: 2003-07-30.
INDEPENDENT STUDIO SERVICES IN (9545 WENTWORTH ST in SUNLAND, CA; small business)
$22,326 with Navy for Ammunition, through 30 mm. Signed on 2005-03-11. Completion date: 2005-03-18.
Top industries in this zip code by the number of employees in 2005:
Health Care and Social Assistance: Nursing Care Facilities (100-249 employees: 1 establishment, 50-99 employees: 2 establishments)
2005 - 2018 National Fire Incident Reporting System (NFIRS) incidents
Based on the data from the years 2005 - 2018 the average number of fires per year is 46. The highest number of reported fire incidents - 68 took place in 2009, and the least - 29 in 2012. The data has a dropping trend.
When looking into fire subcategories, the most incidents belonged to: Outside Fires (35.6%), and Structure Fires (30.1%).
Fire incident types reported to NFIRS in Zip Code 91040


 Nearest zip codes: 91352, 91504, 91501, 91342, 91605, 91331.


 Based on the data from the years 2005 - 2018 the average number of fires per year is 46. The highest number of reported fire incidents - 68 took place in 2009, and the least - 29 in 2012. The data has a dropping trend.
 When looking into fire subcategories, the most incidents belonged to: Outside Fires (35.6%), and Structure Fires (30.1%).