Estimated zip code population in 2022: 7,446 Zip code population in 2010: 8,415 Zip code population in 2000: 7,515
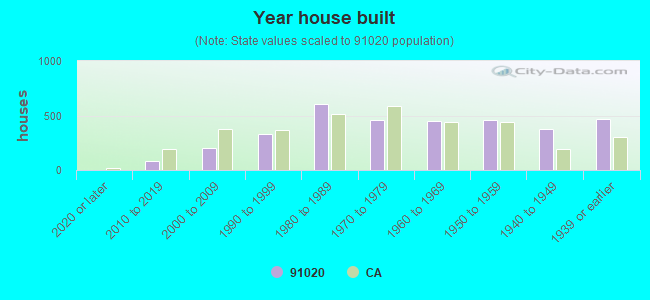
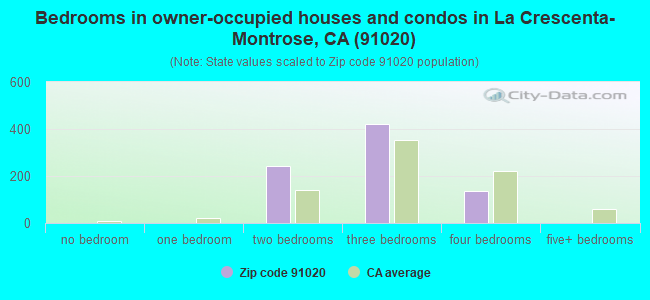
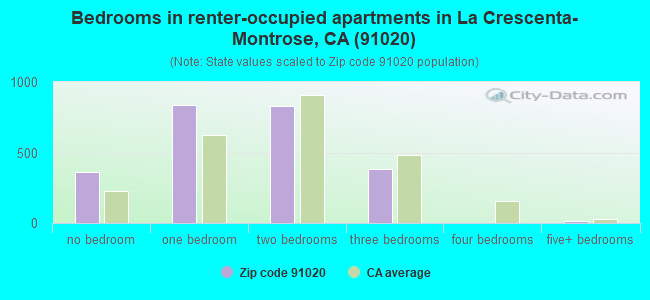
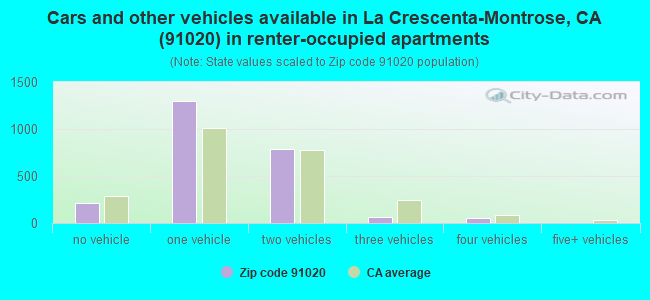
Houses and condos: 3,501 Renter-occupied apartments: 2,422
% of renters here:
75%
State:
44%
March 2022 cost of living index in zip code 91020: 146.5 (very high, U.S. average is 100)
Land area: 0.8 sq. mi. Water area: 0.0 sq. mi.
Population density: 9,897 people per square mile
(high).
OSM Map
General Map
Google Map
MSN Map
OSM Map
General Map
Google Map
MSN Map
OSM Map
General Map
Google Map
MSN Map
OSM Map
General Map
Google Map
MSN Map
Please wait while loading the map...
Real estate property taxes paid for housing units in 2022:
This zip code:
0.6% ($6,275)
California:
0.7% ($4,831)
Median real estate property taxes paid for housing units with mortgages in 2022: $6,414 (0.7%) Median real estate property taxes paid for housing units with no mortgage in 2022: $6,120 (0.6%)
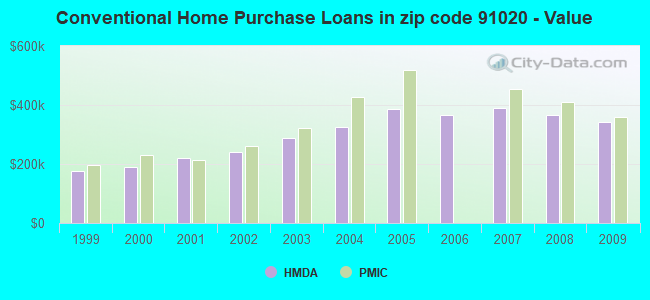
Estimated median house/condo value in 2022: $969,120
91020:
$969,120
California:
$715,900
According to our research of California and other state lists, there were 3 registered sex offenders living in 91020 zip code as of May 18, 2024. The ratio of all residents to sex offenders in zip code 91020 is 2,856 to 1. The ratio of registered sex offenders to all residents in this zip code is much lower than the state average.
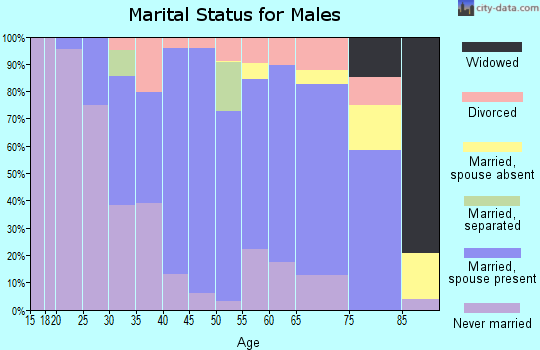
Median resident age:
This zip code:
42.2 years
California median age:
37.9 years
Average household size:
This zip code:
2.2 people
California:
2.8 people
Averages for the 2020 tax year for zip code 91020, filed in 2021:
Average Adjusted Gross Income (AGI) in 2020: $76,241 (Individual Income Tax Returns)
Here:
$76,241
State:
$95,910
Salary/wage: $72,042 (reported on 79.8% of returns)
Here:
$72,042
State:
$77,331
(% of AGI for various income ranges: 1153.4% for AGIs below $25k, 3826.9% for AGIs $25k-50k, 7915.6% for AGIs $50k-75k, 11651.1% for AGIs $75k-100k, 22445.6% for AGIs $100k-200k, 71250.0% for AGIs over 200k)
Taxable interest for individuals: $1,249 (reported on 35.8% of returns)
This zip code:
$1,249
California:
$2,294
(% of AGI for various income ranges: 20.5% for AGIs below $25k, 33.7% for AGIs $25k-50k, 69.2% for AGIs $50k-75k, 65.6% for AGIs $75k-100k, 122.5% for AGIs $100k-200k, 721.2% for AGIs over 200k)
Ordinary dividends: $2,826 (reported on 20.5% of returns)
Here:
$2,826
State:
$10,949
(% of AGI for various income ranges: 20.5% for AGIs below $25k, 33.1% for AGIs $25k-50k, 56.7% for AGIs $50k-75k, 63.3% for AGIs $75k-100k, 221.1% for AGIs $100k-200k, 985.0% for AGIs over 200k)
Net capital gain/loss in AGI: +$9,684 (reported on 21.2% of returns)
Here:
+$9,684
State:
+$49,306
(% of AGI for various income ranges: 14.2% for AGIs below $25k, 33.7% for AGIs $25k-50k, 104.4% for AGIs $50k-75k, 237.8% for AGIs $75k-100k, 409.7% for AGIs $100k-200k, 6601.2% for AGIs over 200k)
Profit/loss from business: +$10,298 (reported on 25.1% of returns)
Here:
+$10,298
State:
+$15,671
(% of AGI for various income ranges: 212.3% for AGIs below $25k, 536.3% for AGIs $25k-50k, 436.1% for AGIs $50k-75k, 393.0% for AGIs $75k-100k, 581.4% for AGIs $100k-200k, 1566.2% for AGIs over 200k)
Taxable individual retirement arrangement distribution: $16,560 (reported on 5.1% of returns)
91020:
$16,560
California:
$23,505
(% of AGI for various income ranges: 47.2% for AGIs below $25k, 48.0% for AGIs $25k-50k, 166.7% for AGIs $50k-75k, 188.5% for AGIs $75k-100k, 458.6% for AGIs $100k-200k)
Total itemized deductions: $32,791 (reported on 14.6% of returns)
Here:
$32,791
State:
$39,517
(% of AGI for various income ranges: 91.7% for AGIs below $25k, 220.8% for AGIs $25k-50k, 492.8% for AGIs $50k-75k, 866.7% for AGIs $75k-100k, 1981.4% for AGIs $100k-200k, 7152.5% for AGIs over 200k)
Charity contributions: $6,517 (reported on 12.3% of returns)
Here:
$6,517
State:
$12,598
(% of AGI for various income ranges: 23.1% for AGIs $25k-50k, 69.4% for AGIs $50k-75k, 134.1% for AGIs $75k-100k, 332.2% for AGIs $100k-200k, 1502.5% for AGIs over 200k)
Taxes paid: $8,698 (reported on 14.6% of returns)
91020:
$8,698
State:
$8,807
(% of AGI for various income ranges: 21.2% for AGIs below $25k, 45.5% for AGIs $25k-50k, 122.2% for AGIs $50k-75k, 244.8% for AGIs $75k-100k, 586.1% for AGIs $100k-200k, 1721.2% for AGIs over 200k)
Earned income credit: $1,813 (reported on 12.0% of returns)
Here:
$1,813
State:
$2,074
(% of AGI for various income ranges: 71.8% for AGIs below $25k, 75.5% for AGIs $25k-50k)
Percentage of individuals using paid preparers for their 2020 taxes: 92.1%
Here:
92%
State:
92%
(% for various income ranges: 89.1% for AGIs below $25k, 93.7% for AGIs $25k-50k, 93.2% for AGIs $50k-75k, 93.5% for AGIs $75k-100k, 91.7% for AGIs $100k-200k, 96.0% for AGIs over 200k)
Averages for the 2012 tax year for zip code 91020, filed in 2013:
Average Adjusted Gross Income (AGI) in 2012: $58,717 (Individual Income Tax Returns)
Here:
$58,717
State:
$72,726
Salary/wage: $55,044 (reported on 81.7% of returns)
Here:
$55,044
State:
$59,079
(% of AGI for various income ranges: 61.7% for AGIs below $25k, 78.4% for AGIs $25k-50k, 81.4% for AGIs $50k-75k, 82.4% for AGIs $75k-100k, 82.3% for AGIs $100k-200k, 58.8% for AGIs over 200k)
Taxable interest for individuals: $953 (reported on 35.7% of returns)
This zip code:
$953
California:
$2,146
(% of AGI for various income ranges: 1.4% for AGIs below $25k, 0.5% for AGIs $25k-50k, 0.6% for AGIs $50k-75k, 0.3% for AGIs $75k-100k, 0.3% for AGIs $100k-200k, 1.0% for AGIs over 200k)
Ordinary dividends: $2,325 (reported on 15.7% of returns)
Here:
$2,325
State:
$9,308
(% of AGI for various income ranges: 1.1% for AGIs below $25k, 0.6% for AGIs $25k-50k, 0.5% for AGIs $50k-75k, 0.7% for AGIs $75k-100k, 0.6% for AGIs $100k-200k, 0.4% for AGIs over 200k)
Net capital gain/loss in AGI: +$5,371 (reported on 14.0% of returns)
Here:
+$5,371
State:
+$30,460
(% of AGI for various income ranges: 0.5% for AGIs $100k-200k, 7.6% for AGIs over 200k)
Profit/loss from business: +$12,535 (reported on 25.1% of returns)
Here:
+$12,535
State:
+$17,064
(% of AGI for various income ranges: 22.1% for AGIs below $25k, 7.9% for AGIs $25k-50k, 3.6% for AGIs $50k-75k, 2.6% for AGIs $75k-100k, 4.1% for AGIs $100k-200k, 2.8% for AGIs over 200k)
Taxable individual retirement arrangement distribution: $11,591 (reported on 6.3% of returns)
91020:
$11,591
California:
$19,557
(% of AGI for various income ranges: 3.5% for AGIs below $25k, 1.0% for AGIs $25k-50k, 1.2% for AGIs $50k-75k, 1.5% for AGIs $75k-100k, 1.3% for AGIs $100k-200k)
Total itemized deductions: $27,375 (27% of AGI, reported on 35.4% of returns)
Here:
$27,375
State:
$34,004
Here:
27.0% of AGI
State:
22.7% of AGI
(% of AGI for various income ranges: 12.3% for AGIs below $25k, 11.2% for AGIs $25k-50k, 12.5% for AGIs $50k-75k, 16.4% for AGIs $75k-100k, 19.2% for AGIs $100k-200k, 23.7% for AGIs over 200k)
Charity contributions: $3,485 (reported on 29.1% of returns)
Here:
$3,485
State:
$4,659
(% of AGI for various income ranges: 0.9% for AGIs below $25k, 0.9% for AGIs $25k-50k, 1.3% for AGIs $50k-75k, 2.1% for AGIs $75k-100k, 2.4% for AGIs $100k-200k, 1.9% for AGIs over 200k)
Taxes paid: $9,367 (reported on 35.4% of returns)
91020:
$9,367
State:
$14,448
(% of AGI for various income ranges: 3.2% for AGIs below $25k, 2.4% for AGIs $25k-50k, 3.2% for AGIs $50k-75k, 5.5% for AGIs $75k-100k, 7.1% for AGIs $100k-200k, 10.3% for AGIs over 200k)
Earned income credit: $2,003 (reported on 16.6% of returns)
Here:
$2,003
State:
$2,286
(% of AGI for various income ranges: 5.7% for AGIs below $25k, 1.2% for AGIs $25k-50k)
Percentage of individuals using paid preparers for their 2012 taxes: 67.1%
Here:
67%
State:
64%
(% for various income ranges: 64.6% for AGIs below $25k, 66.3% for AGIs $25k-50k, 70.5% for AGIs $50k-75k, 64.9% for AGIs $75k-100k, 70.5% for AGIs $100k-200k, 77.8% for AGIs over 200k)
Averages for the 2004 tax year for zip code 91020, filed in 2005:
Average Adjusted Gross Income (AGI) in 2004: $46,234 (Individual Income Tax Returns)
Here:
$46,234
State:
$58,600
Salary/wage: $45,454 (reported on 82.1% of returns)
Here:
$45,454
State:
$49,455
(% of AGI for various income ranges: 128.1% for AGIs below $10k, 71.4% for AGIs $10k-25k, 82.2% for AGIs $25k-50k, 84.7% for AGIs $50k-75k, 87.2% for AGIs $75k-100k, 75.0% for AGIs over 100k)
Taxable interest for individuals: $1,132 (reported on 46.4% of returns)
This zip code:
$1,132
California:
$2,365
(% of AGI for various income ranges: 8.9% for AGIs below $10k, 2.5% for AGIs $10k-25k, 1.0% for AGIs $25k-50k, 0.9% for AGIs $50k-75k, 0.6% for AGIs $75k-100k, 1.0% for AGIs over 100k)
Taxable dividends: $1,431 (reported on 20.7% of returns)
Here:
$1,431
State:
$4,746
(% of AGI for various income ranges: 5.4% for AGIs below $10k, 1.5% for AGIs $10k-25k, 0.7% for AGIs $25k-50k, 0.6% for AGIs $50k-75k, 0.3% for AGIs $75k-100k, 0.5% for AGIs over 100k)
Net capital gain/loss: +$5,703 (reported on 16.2% of returns)
Here:
+$5,703
State:
+$23,418
(% of AGI for various income ranges: 8.0% for AGIs below $10k, -0.4% for AGIs $10k-25k, 0.0% for AGIs $25k-50k, 0.3% for AGIs $50k-75k, -0.1% for AGIs $75k-100k, 5.9% for AGIs over 100k)
Profit/loss from business: +$13,649 (reported on 23.7% of returns)
Here:
+$13,649
State:
+$16,826
(% of AGI for various income ranges: 34.1% for AGIs below $10k, 15.5% for AGIs $10k-25k, 8.9% for AGIs $25k-50k, 5.8% for AGIs $50k-75k, 2.8% for AGIs $75k-100k, 5.5% for AGIs over 100k)
IRA payment deduction: $2,830 (reported on 3.3% of returns)
91020:
$2,830
California:
$3,192
(% of AGI for various income ranges: 0.3% for AGIs $10k-25k, 0.3% for AGIs $25k-50k, 0.2% for AGIs $50k-75k, 0.2% for AGIs $75k-100k, 0.1% for AGIs over 100k)
Self-employed pension: $11,219 (reported on 1.0% of returns)
Here:
$11,219
California:
$17,688
Total itemized deductions: $22,295 (29% of AGI, reported on 37.4% of returns)
Here:
$22,295
State:
$28,113
Here:
28.5% of AGI
State:
25.3% of AGI
(% of AGI for various income ranges: 33.4% for AGIs below $10k, 12.0% for AGIs $10k-25k, 15.7% for AGIs $25k-50k, 17.2% for AGIs $50k-75k, 20.9% for AGIs $75k-100k, 19.9% for AGIs over 100k)
Charity contributions deductions: $3,459 (4% of AGI, reported on 32.5% of returns)
Here:
$3,459
State:
$3,923
Here:
4.2% of AGI
State:
3.3% of AGI
(% of AGI for various income ranges: 1.8% for AGIs below $10k, 0.9% for AGIs $10k-25k, 1.5% for AGIs $25k-50k, 2.2% for AGIs $50k-75k, 3.1% for AGIs $75k-100k, 3.3% for AGIs over 100k)
Total tax: $6,543 (reported on 81.1% of returns)
91020:
$6,543
State:
$10,761
(% of AGI for various income ranges: 7.6% for AGIs below $10k, 5.7% for AGIs $10k-25k, 8.0% for AGIs $25k-50k, 10.5% for AGIs $50k-75k, 11.4% for AGIs $75k-100k, 16.2% for AGIs over 100k)
Earned income credit: $1,417 (reported on 13.9% of returns)
Here:
$1,417
State:
$1,763
Percentage of individuals using paid preparers for their 2004 taxes: 66.1%
Here:
66%
State:
66%
(% for various income ranges: 62.5% for AGIs below $10k, 65.8% for AGIs $10k-25k, 66.4% for AGIs $25k-50k, 68.0% for AGIs $50k-75k, 65.2% for AGIs $75k-100k, 70.3% for AGIs over 100k)
Likely homosexual households (counted as self-reported same-sex unmarried-partner households)
Lesbian couples: 0.5% of all households
Gay men: 0.0% of all households
Household received Food Stamps/SNAP in the past 12 months: 327 Household did not receive Food Stamps/SNAP in the past 12 months: 2,891
Women who had a birth in the past 12 months: 16 (16 now married, 0 unmarried) Women who did not have a birth in the past 12 months: 1,600 (741 now married, 854 unmarried)
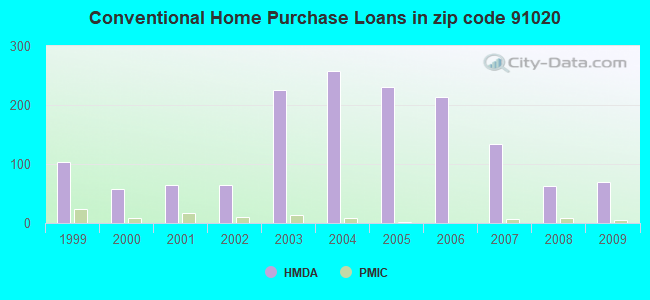
Housing units in zip code 91020 with a mortgage: 666 (113 second mortgage, 62 home equity loan, 56 both second mortgage and home equity loan) Median monthly owner costs for units with a mortgage: $3,079 Median monthly owner costs for units without a mortgage: $824
Residents with income below the poverty level in 2022:
This zip code:
15.7%
Whole state:
12.2%
Residents with income below 50% of the poverty level in 2022:
This zip code:
6.8%
Whole state:
6.2%
Median number of rooms in houses and condos:
Here:
5.4
State:
6.0
Median number of rooms in apartments:
Here:
3.5
State:
3.9
Notable locations in this zip code not listed on our city pages
Notable locations in zip code 91020: Montrose-Crescenta Branch Glendale Public Library (A), City of Glendale Fire Department Station 29 (B). Display/hide their locations on the map
Churches in zip code 91020 include: Church of the Nazarene (A), First Baptist Church (B), Holy Redeemer Catholic Church (C), Crescenta Valley United Methodist Church (D). Display/hide their locations on the map
Tourist attraction (not listed on the city page) : A Night On the Town Ticket Service (Amusement & Theme Parks; 4148 Ocean View Boulevard).
In group quarters: 211 (-1 institutionalized population)
Size of family households: 600 2-persons, 365 3-persons, 538 4-persons, 49 5-persons, 22 6-persons, 55 7-or-more-persons
Size of nonfamily households: 1,477 1-person, 138 2-persons
1,224 married couples with children.
411 single-parent households (123 men, 288 women).
49.9% of residents of 91020 zip code speak English at home.
8.7% of residents speak Spanish at home (75% very well, 14% well, 6% not well, 4% not at all).
20.5% of residents speak other Indo-European language at home (60% very well, 17% well, 13% not well, 9% not at all).
20.6% of residents speak Asian or Pacific Island language at home (59% very well, 17% well, 24% not well).
0.8% of residents speak other language at home (55% very well, 45% well).
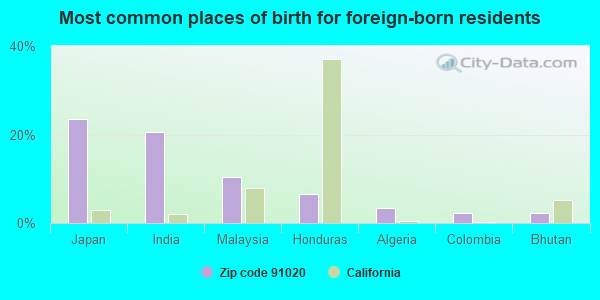
Foreign born population: 2,888 (38.8%) (79.2% of them are naturalized citizens)
This zip code:
38.8%
Whole state:
26.7%
23%Japan
21%India
10%Malaysia
7%Honduras
3%Algeria
2%Colombia
2%Bhutan
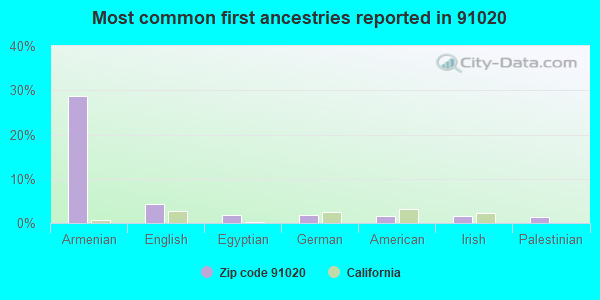
29%Armenian
4%English
2%Egyptian
2%German
2%American
1%Irish
1%Palestinian
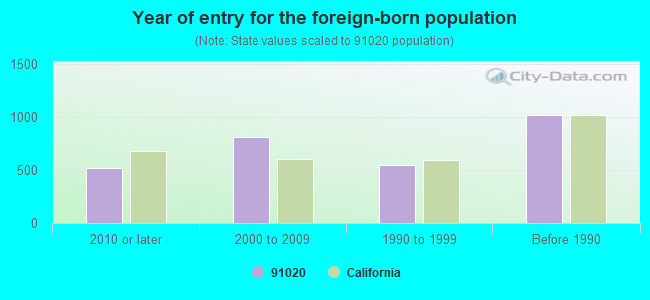
Year of entry for the foreign-born population
5222010 or later
8082000 to 2009
5421990 to 1999
1,016Before 1990
Facilities with environmental interests located in this zip code:
MALCO PLASTICS WEST (3717 PARK PL in MONTROSE, CA)
Small Quantity Generators, between 100 kg and 1000 kg of hazardous waste/month (Resource Conservation and Recovery Act (tracking hazardous waste)) - notification (Resource Conservation and Recovery Act (tracking hazardous waste)) Organizations: MALCO PLASTICS INC (CONTACT/OWNER)
, MALCO PLASTICS INC OF CAL (CONTACT/OWNER)
Alternative names: MALCO PLASTICS INC OF CAL
EXXONMOBIL OIL CORP. (2114 VERDUGO BLVD in MONTROSE, CA)
HAZARDOUS WASTE BIENNIAL REPORTER (Resource Conservation and Recovery Act (tracking hazardous waste)) Large Quantity Generators, more that 1000 kg of hazardous waste/month (Resource Conservation and Recovery Act (tracking hazardous waste)) Organizations: EXXONMOBIL OIL CORPORATION (CONTACT/OWNER)
GOLDEN WEST CLEANERS (2033 VERDUGO BLVD 1210 FWY in MONTROSE, CA)
Small Quantity Generators, between 100 kg and 1000 kg of hazardous waste/month (Resource Conservation and Recovery Act (tracking hazardous waste)) - notification Organizations: CHUNG KYI SUK (CONTACT/OWNER)
GRAPHIC CONNECTION (3824 OCEANVIEW BLVD in MONTROSE, CA)
Small Quantity Generators, between 100 kg and 1000 kg of hazardous waste/month (Resource Conservation and Recovery Act (tracking hazardous waste)) - notification Organizations: SCOTT HARDYMAN (CONTACT/OWNER)
GRAPHIX CONNECTION (4105 OCEAN VIEW BLVD STE D in MONTROSE, CA)
Small Quantity Generators, between 100 kg and 1000 kg of hazardous waste/month (Resource Conservation and Recovery Act (tracking hazardous waste)) Organizations: SCOTT HARDYMAN (CONTACT/OWNER)
HOLIDAY CLEANERS (2136 VERDUGO in MONTROSE, CA)
Small Quantity Generators, between 100 kg and 1000 kg of hazardous waste/month (Resource Conservation and Recovery Act (tracking hazardous waste)) - notification Organizations: HELEN HONG (CONTACT/OWNER)
MONTROSE AUTO BODY (3715 CLIFTON PL in MONTROSE, CA)
Small Quantity Generators, between 100 kg and 1000 kg of hazardous waste/month (Resource Conservation and Recovery Act (tracking hazardous waste)) - notification Organizations: ROBERTO FERNANDEZ (CONTACT/OWNER)
AMERICAN ALLIANCE MEDICAL INC (2444 HONOLULU AVE in MONTROSE, CA)
TRANSPORTER (Resource Conservation and Recovery Act (tracking hazardous waste)) Organizations: JENSEN PAUL (CONTACT/OWNER)
MONTROSE AUTO PARTS (2662 HONOLULU AVE in MONTROSE, CA)
Small Quantity Generators, between 100 kg and 1000 kg of hazardous waste/month (Resource Conservation and Recovery Act (tracking hazardous waste)) - notification Organizations: JOHN HERZER (CONTACT/OWNER)
MONTROSE TRANSMISSION (2737 HONOLULU AVE in MONTROSE, CA)
Small Quantity Generators, between 100 kg and 1000 kg of hazardous waste/month (Resource Conservation and Recovery Act (tracking hazardous waste)) - notification Organizations: TYLER LEDFORD (CONTACT/OWNER)
Housing units lacking complete plumbing facilities: 1.4% Housing units lacking complete kitchen facilities: 5.5%
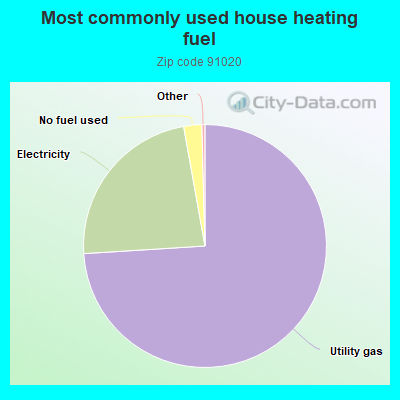
74.0%Utility gas
23.2%Electricity
2.4%No fuel used
Population in 1990: 6,536. Population change in the 1990s: +979 (+15.0%).
Place of birth for U.S.-born residents:
This state: 3,555
Northeast: 310
Midwest: 315
South: 145
West: 214
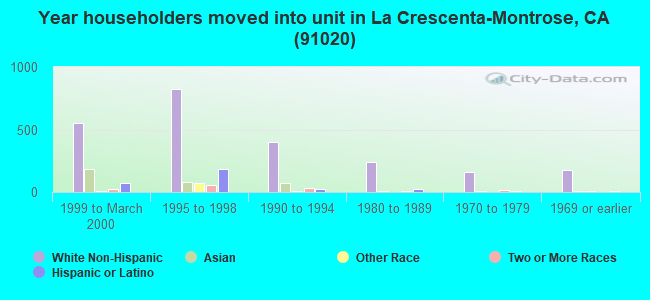
50% of the 91020 zip code residents lived in the same house 5 years ago. Out of people who lived in different houses, 83% lived in this county. Out of people who lived in different counties, 50% lived in California.
90% of the 91020 zip code residents lived in the same house 1 year ago. Out of people who lived in different houses, 75% moved from this county. Out of people who lived in different houses, 4% moved from different county within same state. Out of people who lived in different houses, 19% moved from different state.
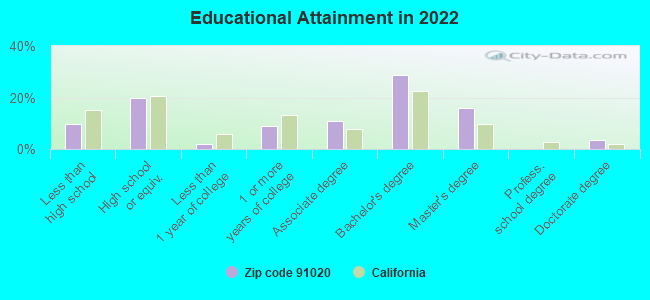
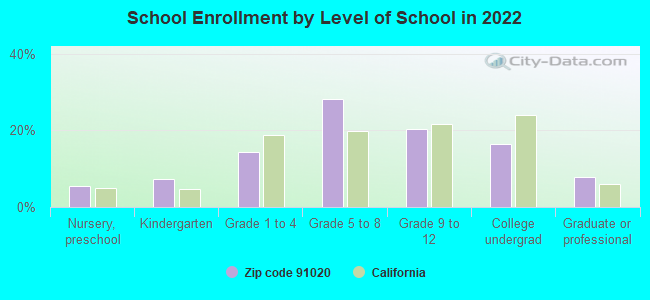
Private vs. public school enrollment:
Students in private schools in grades 1 to 8 (elementary and middle school): 16
Here:
2.0%
California:
10.5%
Students in private schools in grades 9 to 12 (high school): 31
Here:
7.8%
California:
8.5%
Students in private undergraduate colleges: 12
Here:
4.0%
California:
15.9%
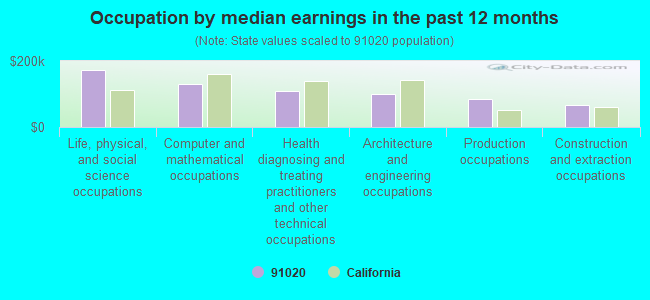
Occupation by median earnings in the past 12 months ($)
172,462Life, physical, and social science occupations
131,768Computer and mathematical occupations
109,627Health diagnosing and treating practitioners and other technical occupations
100,824Architecture and engineering occupations
85,857Production occupations
65,994Construction and extraction occupations
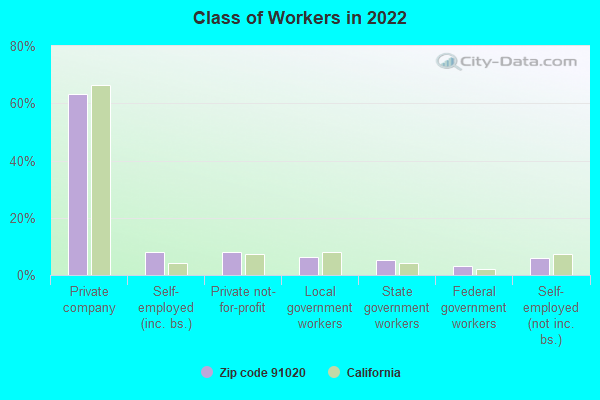
Top industries in this zip code by the number of employees in 2005:
Health Care and Social Assistance: Nursing Care Facilities (100-249 employees: 1 establishment, 50-99 employees: 3 establishments)
Administrative and Support and Waste Management and Remediation Services: Travel Agencies (100-249: 1, 20-49: 1, 1-4: 2)

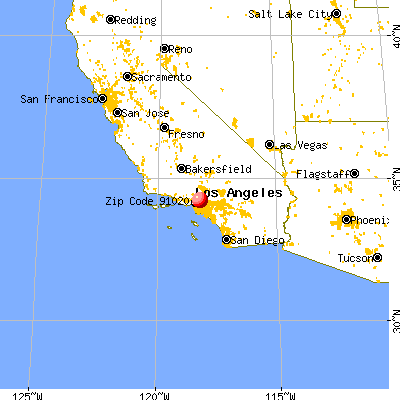


 Nearest zip codes: 91046, 91208, 91011, 91214, 91207, 91206.