Estimated zip code population in 2022: 43,912 Zip code population in 2010: 44,383 Zip code population in 2000: 41,970
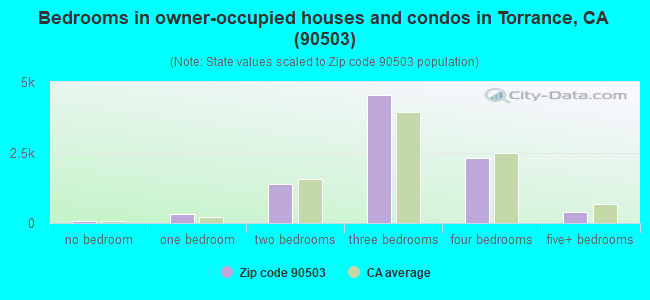
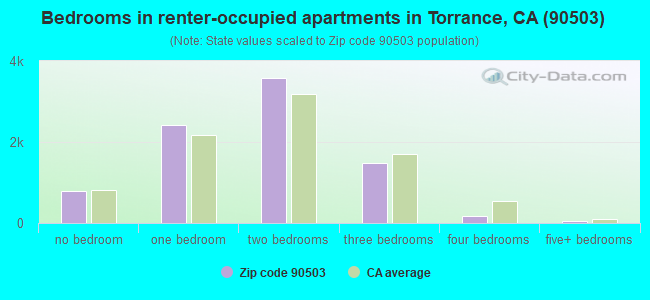
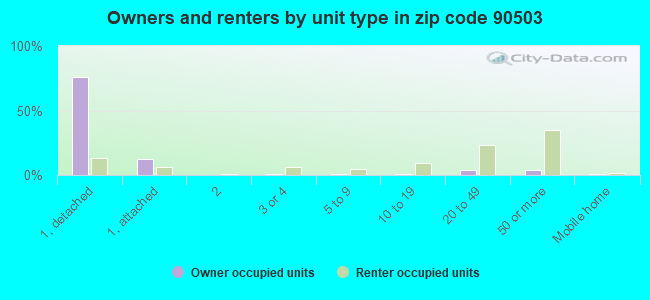
Houses and condos: 18,541 Renter-occupied apartments: 8,512
% of renters here:
49%
State:
44%
March 2022 cost of living index in zip code 90503: 136.7 (high, U.S. average is 100)
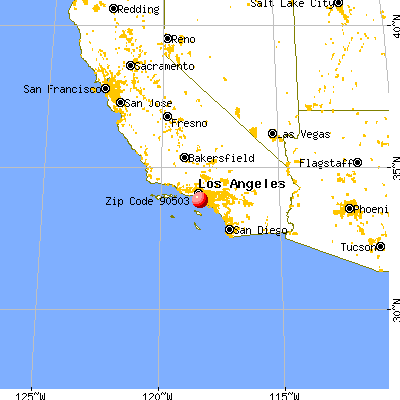
Land area: 5.3 sq. mi. Water area: 0.0 sq. mi.
Population density: 8,290 people per square mile
(high).
OSM Map
General Map
Google Map
MSN Map
OSM Map
General Map
Google Map
MSN Map
OSM Map
General Map
Google Map
MSN Map
OSM Map
General Map
Google Map
MSN Map
Please wait while loading the map...
Real estate property taxes paid for housing units in 2022:
This zip code:
0.6% ($6,944)
California:
0.7% ($4,831)
Median real estate property taxes paid for housing units with mortgages in 2022: $7,882 (0.7%) Median real estate property taxes paid for housing units with no mortgage in 2022: $5,208 (0.5%)
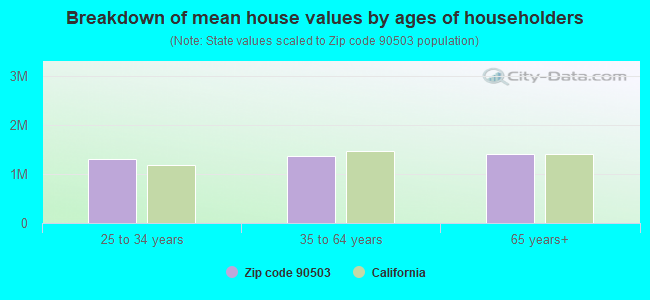
Estimated median house/condo value in 2022: $1,076,510
90503:
$1,076,510
California:
$715,900
According to our research of California and other state lists, there were 13 registered sex offenders living in 90503 zip code as of May 05, 2024. The ratio of all residents to sex offenders in zip code 90503 is 3,477 to 1. The ratio of registered sex offenders to all residents in this zip code is much lower than the state average.
Median resident age:
This zip code:
41.8 years
California median age:
37.9 years
Average household size:
This zip code:
2.5 people
California:
2.8 people
Averages for the 2020 tax year for zip code 90503, filed in 2021:
Average Adjusted Gross Income (AGI) in 2020: $103,809 (Individual Income Tax Returns)
Here:
$103,809
State:
$95,910
Salary/wage: $93,146 (reported on 77.9% of returns)
Here:
$93,146
State:
$77,331
(% of AGI for various income ranges: 1179.1% for AGIs below $25k, 3822.9% for AGIs $25k-50k, 6903.0% for AGIs $50k-75k, 10513.9% for AGIs $75k-100k, 21036.2% for AGIs $100k-200k, 82292.6% for AGIs over 200k)
Taxable interest for individuals: $1,988 (reported on 46.2% of returns)
This zip code:
$1,988
California:
$2,294
(% of AGI for various income ranges: 45.9% for AGIs below $25k, 62.3% for AGIs $25k-50k, 107.4% for AGIs $50k-75k, 119.9% for AGIs $75k-100k, 221.3% for AGIs $100k-200k, 997.1% for AGIs over 200k)
Ordinary dividends: $5,218 (reported on 32.6% of returns)
Here:
$5,218
State:
$10,949
(% of AGI for various income ranges: 53.4% for AGIs below $25k, 93.1% for AGIs $25k-50k, 170.5% for AGIs $50k-75k, 229.0% for AGIs $75k-100k, 444.6% for AGIs $100k-200k, 1982.8% for AGIs over 200k)
Net capital gain/loss in AGI: +$20,881 (reported on 31.2% of returns)
Here:
+$20,881
State:
+$49,306
(% of AGI for various income ranges: 35.0% for AGIs below $25k, 68.5% for AGIs $25k-50k, 135.0% for AGIs $50k-75k, 233.7% for AGIs $75k-100k, 630.4% for AGIs $100k-200k, 14678.1% for AGIs over 200k)
Profit/loss from business: +$13,116 (reported on 18.4% of returns)
Here:
+$13,116
State:
+$15,671
(% of AGI for various income ranges: 187.9% for AGIs below $25k, 283.9% for AGIs $25k-50k, 335.2% for AGIs $50k-75k, 283.6% for AGIs $75k-100k, 566.4% for AGIs $100k-200k, 1959.1% for AGIs over 200k)
Taxable individual retirement arrangement distribution: $27,921 (reported on 10.5% of returns)
90503:
$27,921
California:
$23,505
(% of AGI for various income ranges: 80.2% for AGIs below $25k, 176.8% for AGIs $25k-50k, 303.9% for AGIs $50k-75k, 490.3% for AGIs $75k-100k, 971.6% for AGIs $100k-200k, 2615.5% for AGIs over 200k)
Self-employed (Keogh) retirement plans: $21,781 (reported on 1.0% of returns)
90503:
$21,781
California:
$30,163
(% of AGI for various income ranges: 26.3% for AGIs $50k-75k, 48.3% for AGIs $100k-200k, 363.1% for AGIs over 200k)
Total itemized deductions: $36,619 (reported on 19.5% of returns)
Here:
$36,619
State:
$39,517
(% of AGI for various income ranges: 127.2% for AGIs below $25k, 282.7% for AGIs $25k-50k, 565.4% for AGIs $50k-75k, 971.4% for AGIs $75k-100k, 2120.3% for AGIs $100k-200k, 8567.2% for AGIs over 200k)
Charity contributions: $6,891 (reported on 16.7% of returns)
Here:
$6,891
State:
$12,598
(% of AGI for various income ranges: 6.0% for AGIs below $25k, 27.9% for AGIs $25k-50k, 70.3% for AGIs $50k-75k, 138.1% for AGIs $75k-100k, 332.6% for AGIs $100k-200k, 1597.1% for AGIs over 200k)
Taxes paid: $9,008 (reported on 19.4% of returns)
90503:
$9,008
State:
$8,807
(% of AGI for various income ranges: 24.3% for AGIs below $25k, 60.8% for AGIs $25k-50k, 140.9% for AGIs $50k-75k, 288.8% for AGIs $75k-100k, 616.1% for AGIs $100k-200k, 1757.1% for AGIs over 200k)
Earned income credit: $1,613 (reported on 7.9% of returns)
Here:
$1,613
State:
$2,074
(% of AGI for various income ranges: 55.1% for AGIs below $25k, 44.5% for AGIs $25k-50k, 0.5% for AGIs $50k-75k)
Percentage of individuals using paid preparers for their 2020 taxes: 91.9%
Here:
92%
State:
92%
(% for various income ranges: 89.3% for AGIs below $25k, 92.8% for AGIs $25k-50k, 93.5% for AGIs $50k-75k, 92.2% for AGIs $75k-100k, 92.4% for AGIs $100k-200k, 93.2% for AGIs over 200k)
Averages for the 2012 tax year for zip code 90503, filed in 2013:
Average Adjusted Gross Income (AGI) in 2012: $79,330 (Individual Income Tax Returns)
Here:
$79,330
State:
$72,726
Salary/wage: $73,163 (reported on 80.5% of returns)
Here:
$73,163
State:
$59,079
(% of AGI for various income ranges: 69.2% for AGIs below $25k, 75.2% for AGIs $25k-50k, 75.4% for AGIs $50k-75k, 74.7% for AGIs $75k-100k, 80.7% for AGIs $100k-200k, 65.1% for AGIs over 200k)
Taxable interest for individuals: $1,335 (reported on 48.4% of returns)
This zip code:
$1,335
California:
$2,146
(% of AGI for various income ranges: 2.0% for AGIs below $25k, 1.0% for AGIs $25k-50k, 1.0% for AGIs $50k-75k, 0.8% for AGIs $75k-100k, 0.7% for AGIs $100k-200k, 0.7% for AGIs over 200k)
Ordinary dividends: $4,223 (reported on 28.4% of returns)
Here:
$4,223
State:
$9,308
(% of AGI for various income ranges: 2.6% for AGIs below $25k, 1.4% for AGIs $25k-50k, 1.4% for AGIs $50k-75k, 1.3% for AGIs $75k-100k, 1.3% for AGIs $100k-200k, 1.8% for AGIs over 200k)
Net capital gain/loss in AGI: +$10,653 (reported on 23.3% of returns)
Here:
+$10,653
State:
+$30,460
(% of AGI for various income ranges: 0.1% for AGIs $50k-75k, 0.3% for AGIs $75k-100k, 0.7% for AGIs $100k-200k, 10.8% for AGIs over 200k)
Profit/loss from business: +$17,393 (reported on 17.5% of returns)
Here:
+$17,393
State:
+$17,064
(% of AGI for various income ranges: 13.3% for AGIs below $25k, 6.0% for AGIs $25k-50k, 4.1% for AGIs $50k-75k, 3.2% for AGIs $75k-100k, 2.5% for AGIs $100k-200k, 3.6% for AGIs over 200k)
Taxable individual retirement arrangement distribution: $19,231 (reported on 11.9% of returns)
90503:
$19,231
California:
$19,557
(% of AGI for various income ranges: 4.1% for AGIs below $25k, 3.6% for AGIs $25k-50k, 3.4% for AGIs $50k-75k, 3.9% for AGIs $75k-100k, 2.7% for AGIs $100k-200k, 2.0% for AGIs over 200k)
Self-employment retirement plans: $17,885 (reported on 1.0% of returns)
90503:
$17,885
California:
$24,530
(% of AGI for various income ranges: 0.2% for AGIs below $25k, 0.2% for AGIs $50k-75k, 0.2% for AGIs $100k-200k, 0.5% for AGIs over 200k)
Total itemized deductions: $29,751 (23% of AGI, reported on 44.4% of returns)
Here:
$29,751
State:
$34,004
Here:
22.9% of AGI
State:
22.7% of AGI
(% of AGI for various income ranges: 14.5% for AGIs below $25k, 12.1% for AGIs $25k-50k, 14.1% for AGIs $50k-75k, 16.9% for AGIs $75k-100k, 19.1% for AGIs $100k-200k, 16.4% for AGIs over 200k)
Charity contributions: $3,548 (reported on 37.6% of returns)
Here:
$3,548
State:
$4,659
(% of AGI for various income ranges: 0.8% for AGIs below $25k, 1.2% for AGIs $25k-50k, 1.6% for AGIs $50k-75k, 1.8% for AGIs $75k-100k, 2.0% for AGIs $100k-200k, 1.6% for AGIs over 200k)
Taxes paid: $12,329 (reported on 44.3% of returns)
90503:
$12,329
State:
$14,448
(% of AGI for various income ranges: 3.2% for AGIs below $25k, 2.9% for AGIs $25k-50k, 3.9% for AGIs $50k-75k, 5.8% for AGIs $75k-100k, 7.9% for AGIs $100k-200k, 9.3% for AGIs over 200k)
Earned income credit: $1,812 (reported on 9.5% of returns)
Here:
$1,812
State:
$2,286
(% of AGI for various income ranges: 3.8% for AGIs below $25k, 0.7% for AGIs $25k-50k)
Percentage of individuals using paid preparers for their 2012 taxes: 62.4%
Here:
62%
State:
64%
(% for various income ranges: 57.4% for AGIs below $25k, 62.3% for AGIs $25k-50k, 64.2% for AGIs $50k-75k, 65.1% for AGIs $75k-100k, 64.5% for AGIs $100k-200k, 67.4% for AGIs over 200k)
Averages for the 2004 tax year for zip code 90503, filed in 2005:
Average Adjusted Gross Income (AGI) in 2004: $64,009 (Individual Income Tax Returns)
Here:
$64,009
State:
$58,600
Salary/wage: $60,238 (reported on 79.9% of returns)
Here:
$60,238
State:
$49,455
(% of AGI for various income ranges: 250.9% for AGIs below $10k, 66.3% for AGIs $10k-25k, 77.1% for AGIs $25k-50k, 78.0% for AGIs $50k-75k, 78.7% for AGIs $75k-100k, 72.5% for AGIs over 100k)
Taxable interest for individuals: $1,669 (reported on 59.6% of returns)
This zip code:
$1,669
California:
$2,365
(% of AGI for various income ranges: 26.6% for AGIs below $10k, 3.8% for AGIs $10k-25k, 1.8% for AGIs $25k-50k, 1.6% for AGIs $50k-75k, 1.2% for AGIs $75k-100k, 1.2% for AGIs over 100k)
Taxable dividends: $2,666 (reported on 32.2% of returns)
Here:
$2,666
State:
$4,746
(% of AGI for various income ranges: 17.4% for AGIs below $10k, 2.3% for AGIs $10k-25k, 1.2% for AGIs $25k-50k, 1.1% for AGIs $50k-75k, 1.1% for AGIs $75k-100k, 1.3% for AGIs over 100k)
Net capital gain/loss: +$9,934 (reported on 27.6% of returns)
Here:
+$9,934
State:
+$23,418
(% of AGI for various income ranges: -6.1% for AGIs below $10k, -0.3% for AGIs $10k-25k, 0.2% for AGIs $25k-50k, 0.4% for AGIs $50k-75k, 1.2% for AGIs $75k-100k, 7.7% for AGIs over 100k)
Profit/loss from business: +$16,420 (reported on 17.5% of returns)
Here:
+$16,420
State:
+$16,826
(% of AGI for various income ranges: 10.2% for AGIs below $10k, 10.0% for AGIs $10k-25k, 6.0% for AGIs $25k-50k, 4.4% for AGIs $50k-75k, 4.5% for AGIs $75k-100k, 3.7% for AGIs over 100k)
Profit/loss from farming: +$3,462 (reported on 0.1% of returns)
Here:
+$3,462
State:
-$7,562
IRA payment deduction: $3,455 (reported on 4.3% of returns)
90503:
$3,455
California:
$3,192
(% of AGI for various income ranges: 1.4% for AGIs below $10k, 0.3% for AGIs $10k-25k, 0.4% for AGIs $25k-50k, 0.3% for AGIs $50k-75k, 0.3% for AGIs $75k-100k, 0.1% for AGIs over 100k)
Self-employed pension: $16,583 (reported on 1.4% of returns)
Here:
$16,583
California:
$17,688
(% of AGI for various income ranges: 0.1% for AGIs $10k-25k, 0.1% for AGIs $25k-50k, 0.2% for AGIs $50k-75k, 0.3% for AGIs $75k-100k, 0.5% for AGIs over 100k)
Total itemized deductions: $25,291 (24% of AGI, reported on 45.3% of returns)
Here:
$25,291
State:
$28,113
Here:
24.1% of AGI
State:
25.3% of AGI
(% of AGI for various income ranges: 62.5% for AGIs below $10k, 13.6% for AGIs $10k-25k, 14.4% for AGIs $25k-50k, 17.4% for AGIs $50k-75k, 19.8% for AGIs $75k-100k, 18.5% for AGIs over 100k)
Charity contributions deductions: $3,430 (3% of AGI, reported on 40.2% of returns)
Here:
$3,430
State:
$3,923
Here:
3.2% of AGI
State:
3.3% of AGI
(% of AGI for various income ranges: 3.1% for AGIs below $10k, 1.4% for AGIs $10k-25k, 1.6% for AGIs $25k-50k, 2.1% for AGIs $50k-75k, 2.4% for AGIs $75k-100k, 2.3% for AGIs over 100k)
Total tax: $10,093 (reported on 83.5% of returns)
90503:
$10,093
State:
$10,761
(% of AGI for various income ranges: 11.4% for AGIs below $10k, 5.2% for AGIs $10k-25k, 8.1% for AGIs $25k-50k, 10.2% for AGIs $50k-75k, 10.9% for AGIs $75k-100k, 16.5% for AGIs over 100k)
Earned income credit: $1,447 (reported on 8.0% of returns)
Here:
$1,447
State:
$1,763
Percentage of individuals using paid preparers for their 2004 taxes: 63.6%
Here:
64%
State:
66%
(% for various income ranges: 56.4% for AGIs below $10k, 65.2% for AGIs $10k-25k, 64.3% for AGIs $25k-50k, 65.5% for AGIs $50k-75k, 65.5% for AGIs $75k-100k, 64.5% for AGIs over 100k)
Likely homosexual households (counted as self-reported same-sex unmarried-partner households)
Lesbian couples: 0.0% of all households
Gay men: 0.2% of all households
Household received Food Stamps/SNAP in the past 12 months: 827 Household did not receive Food Stamps/SNAP in the past 12 months: 16,359
Women who had a birth in the past 12 months: 197 (179 now married, 17 unmarried) Women who did not have a birth in the past 12 months: 9,131 (4,562 now married, 4,530 unmarried)
Housing units in zip code 90503 with a mortgage: 5,542 (495 second mortgage, 22 home equity loan, 368 both second mortgage and home equity loan) Houses without a mortgage: 45
Median monthly owner costs for units with a mortgage: $3,373 Median monthly owner costs for units without a mortgage: $868
Residents with income below the poverty level in 2022:
This zip code:
5.9%
Whole state:
12.2%
Residents with income below 50% of the poverty level in 2022:
This zip code:
1.9%
Whole state:
6.2%
Median number of rooms in houses and condos:
Here:
5.8
State:
6.0
Median number of rooms in apartments:
Here:
3.5
State:
3.9
Notable locations in this zip code not listed on our city pages
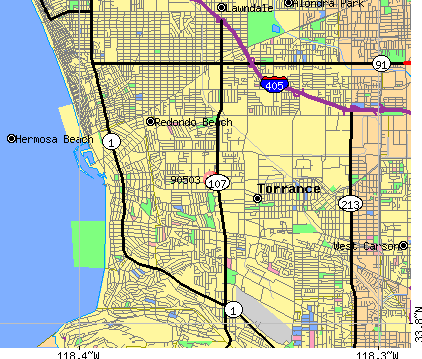
Notable locations in zip code 90503: Del Amo Fashion Center (A), South Bay Industrial Park (B), Del Amo Financial Center (C), Torrance Public Library (D), Torrance Cultural Arts Center (E), Torrance City Hall (F), Isabel Henderson Branch Torrance Public Library (G), Gerber Ambulance Service (H), Torrance Fire Department Fire Station 6 (I), Torrance Fire Department Fire Station 5 (J), Torrance Fire Department Fire Station 1 Headquarters (K). Display/hide their locations on the map
Shopping Centers: Village Del Amo Shopping Center (1), Torrance Promenade Shopping Center (2), Plaza Del Amo Shopping Center (3), North Torrance Shopping Center (4). Display/hide their locations on the map
Parks in zip code 90503 include: Entradero Park (1), Victor Park (2), Delthorne Park (3), Greenwood Park (4), La Romeria Park (5), Madrona Marsh Nature Preserve (6), Paradise Park (7), Sunnyglen Park (8). Display/hide their locations on the map
7,000 married couples with children.
1,276 single-parent households (396 men, 880 women).
57.2% of residents of 90503 zip code speak English at home.
7.2% of residents speak Spanish at home (68% very well, 18% well, 12% not well, 2% not at all).
8.0% of residents speak other Indo-European language at home (64% very well, 26% well, 7% not well, 3% not at all).
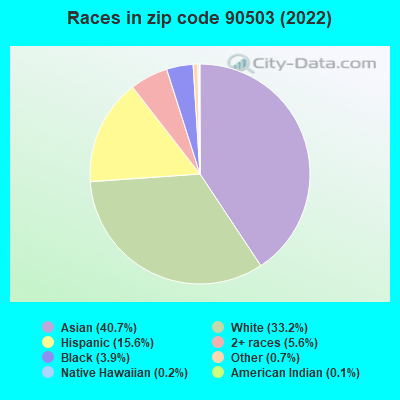
25.4% of residents speak Asian or Pacific Island language at home (48% very well, 33% well, 17% not well, 2% not at all).
2.5% of residents speak other language at home (80% very well, 9% well, 11% not well).
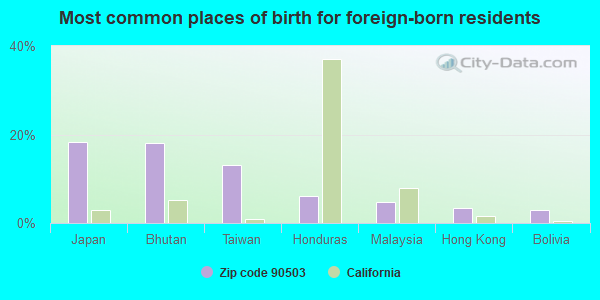
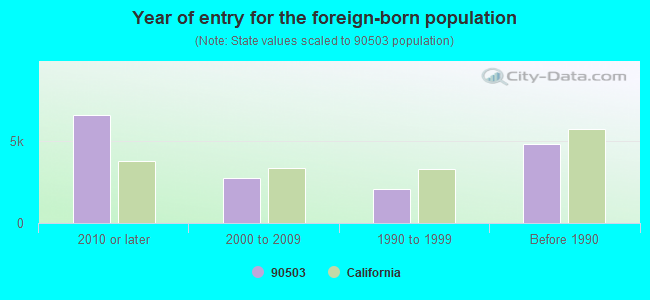
Foreign born population: 14,827 (33.8%) (50.2% of them are naturalized citizens)
Major facilities with environmental interests located in this zip code:
MOTORCAR PARTS AND ACCESSORIES INC (2929 CALIFORNIA ST in TORRANCE, CA)
STATE MASTER (California - Hazardous Waste Tracking) - HAZARDOU WASTE PROGRAM HAZARDOUS WASTE BIENNIAL REPORTER (Resource Conservation and Recovery Act (tracking hazardous waste)) - ICIS-, ENFORCEMENT/COMPLIANCE ACTIVITY Large Quantity Generators, more that 1000 kg of hazardous waste/month (Resource Conservation and Recovery Act (tracking hazardous waste)) - ICIS-, ENFORCEMENT/COMPLIANCE ACTIVITY Organizations: SELWYN JOFFEE (CONTACT/OPERATOR)
, MPA (CONTACT/OWNER)
BALL METAL BEVERAGE CONTAINER CORPORATION (500 CRENSHAW BOULEVARD in TORRANCE, CA)
AIR MAJOR (AIRS/AFS) STATE MASTER (California - Hazardous Waste Tracking) - HAZARDOU WASTE PROGRAM COMPLIANCE ACTIVITY (Tracking inspections of insecticide, fungicide, and rodenticide, and toxic substances) CRITERIA AND HAZARDOUS AIR POLLUTANT INVENTORY (Inventory of air pollution sources) HAZARDOUS WASTE BIENNIAL REPORTER (Resource Conservation and Recovery Act (tracking hazardous waste)) Large Quantity Generators, more that 1000 kg of hazardous waste/month (Resource Conservation and Recovery Act (tracking hazardous waste)) - notification TRI REPORTER (Tracking of toxic chemicals releasing facilities) Business SIC classification: METAL CANS Alternative names: BALL METAL BAVERAGE CONTAINER CORP., BALL METALS, REYNOLDS METAL COMPANY
CELESTRON INTERNATIONAL (2835 COLUMBIA STREET in TORRANCE, CA)
AIR MINOR (AIRS/AFS) STATE MASTER (California - Hazardous Waste Tracking) - HAZARDOU WASTE PROGRAM COMPLIANCE ACTIVITY (Tracking inspections of insecticide, fungicide, and rodenticide, and toxic substances) Small Quantity Generators, between 100 kg and 1000 kg of hazardous waste/month (Resource Conservation and Recovery Act (tracking hazardous waste)) Business SIC classification: OPTICAL INSTRUMENTS AND LENSES Organizations: CELESTRON LLC (CONTACT/OWNER)
Alternative names: CELESTRON LLC
ELM ST WATER YARD (1001 ELM ST in TORRANCE, CA)
STATE MASTER (California - Hazardous Waste Tracking) - HAZARDOU WASTE PROGRAM Large Quantity Generators, more that 1000 kg of hazardous waste/month (Resource Conservation and Recovery Act (tracking hazardous waste)) Organizations: CITY OF TORRANCE (CONTACT/OPERATOR)
EQUILON ENTERPRISES LLC (20305 ANZA in TORRANCE, CA) . Federal Facility
STATE MASTER (California - Hazardous Waste Tracking) - HAZARDOU WASTE PROGRAM Small Quantity Generators, between 100 kg and 1000 kg of hazardous waste/month (Resource Conservation and Recovery Act (tracking hazardous waste)) - notification Small Quantity Generators, between 100 kg and 1000 kg of hazardous waste/month (Resource Conservation and Recovery Act (tracking hazardous waste)) - notification Organizations: ROGER BULLOCK (CONTACT/OWNER)
Alternative names: BULLOCKS SHELL SVC, SHELL OIL CO, SHELL SERVICE STATION
EDELBROCK CORPORATION (2700 CALIFORNIA ST in TORRANCE, CA)
STATE MASTER (California - Hazardous Waste Tracking) - HAZARDOU WASTE PROGRAM Small Quantity Generators, between 100 kg and 1000 kg of hazardous waste/month (Resource Conservation and Recovery Act (tracking hazardous waste)) - notification TRI REPORTER (Tracking of toxic chemicals releasing facilities) Business SIC classification: MOTOR VEHICLE PARTS AND ACCESSORIES Business NAICS classification: ALL OTHER MOTOR VEHICLE PARTS MANUFACTURING.
KIDDIE KANDIDS (20120 HAWTHORNE BLVD in TORRANCE, CA)
STATE MASTER (California - Hazardous Waste Tracking) - HAZARDOU WASTE PROGRAM Small Quantity Generators, between 100 kg and 1000 kg of hazardous waste/month (Resource Conservation and Recovery Act (tracking hazardous waste)) Business NAICS classification: PHOTOGRAPHY STUDIOS, PORTRAIT. Organizations: RWS ENTERPRISES (CONTACT/OPERATOR)
EAST WEST CHIROPRACTIC CLINIC (1757 W CARSON ST STE G in TORRANCE, CA)
STATE MASTER (California - Hazardous Waste Tracking) - HAZARDOU WASTE PROGRAM Small Quantity Generators, between 100 kg and 1000 kg of hazardous waste/month (Resource Conservation and Recovery Act (tracking hazardous waste)) - notification Organizations: ROBERT JO (CONTACT/OWNER)
NATURALIFE ECO VITE LABS. INC. (20433 EARL ST. in TORRANCE, CA)
AIR MAJOR (AIRS/AFS) FORMAL ENFORCEMENT ACTION (Integrated Compliance Information System) COMPLIANCE ACTIVITY (Tracking inspections of insecticide, fungicide, and rodenticide, and toxic substances) CRITERIA AND HAZARDOUS AIR POLLUTANT INVENTORY (Inventory of air pollution sources) Small Quantity Generators, between 100 kg and 1000 kg of hazardous waste/month (Resource Conservation and Recovery Act (tracking hazardous waste)) TRI REPORTER (Tracking of toxic chemicals releasing facilities) Business SIC classification: DRY, CONDENSED, AND EVAPORATED DAIRY PRODUCTS; CANNED FRUITS, VEGETABLES, PRESERVES, JAMS, AND JELLIES; INDUSTRIAL ORGANIC CHEMICALS Organizations: NATURALIFE ECO VITE LABS DBA PARAGON LAB (CONTACT/OPERATOR)
Alternative names: NATURALIFE ECO VITE LABS. DBA PARAGON, NATURALIFE LAB, PARAGON LABORATORIES INC
EQUILON ENTERPRISES (23215 HAWTHORNE in TORRANCE, CA) . Federal Facility
STATE MASTER (California - Hazardous Waste Tracking) - HAZARDOU WASTE PROGRAM Small Quantity Generators, between 100 kg and 1000 kg of hazardous waste/month (Resource Conservation and Recovery Act (tracking hazardous waste)) - notification Organizations: EQUILON ENTERPRISES, LLC (CONTACT/OWNER)
Alternative names: SHELL OIL CO
KOLIBRI ART STUDIOS (2908 OREGON CT UNIT H3 in TORRANCE, CA)
STATE MASTER (California - Hazardous Waste Tracking) - HAZARDOU WASTE PROGRAM Small Quantity Generators, between 100 kg and 1000 kg of hazardous waste/month (Resource Conservation and Recovery Act (tracking hazardous waste)) - notification Organizations: WAYNE HEADRICK (CONTACT/OWNER)
GARDNER AND GARCIA PROF DENT INC (21350 HAWTHORNE BLVD SUITE 155 in TORRANCE, CA)
STATE MASTER (California - Hazardous Waste Tracking) - HAZARDOU WASTE PROGRAM Small Quantity Generators, between 100 kg and 1000 kg of hazardous waste/month (Resource Conservation and Recovery Act (tracking hazardous waste)) - notification Alternative names: GARDNER & GARCIA A PROF DENTAL CORP.
ANZA ELEMENTARY (21400 ELLINWOOD DR. in TORRANCE, CA)
(National Center for Education Statistics) - STATE ID-6022982 Organizations: TORRANCE UNIFIED (SCHOOL DISTRICT)
Housing units lacking complete plumbing facilities: 0.2% Housing units lacking complete kitchen facilities: 4.0%
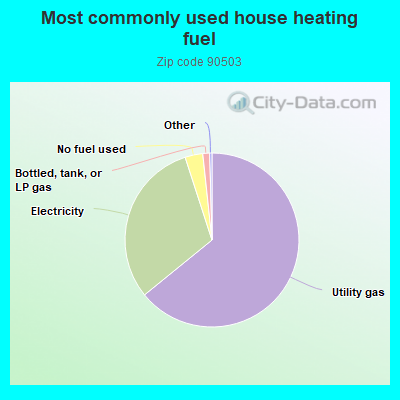
64.2%Utility gas
30.9%Electricity
3.3%No fuel used
1.3%Bottled, tank, or LP gas
Population in 1990: 40,351. Population change in the 1990s: +1,619 (+4.0%).
Place of birth for U.S.-born residents:
This state: 21,626
Northeast: 1,913
Midwest: 1,861
South: 1,574
West: 1,220
55% of the 90503 zip code residents lived in the same house 5 years ago. Out of people who lived in different houses, 81% lived in this county. Out of people who lived in different counties, 50% lived in California.
87% of the 90503 zip code residents lived in the same house 1 year ago. Out of people who lived in different houses, 69% moved from this county. Out of people who lived in different houses, 10% moved from different county within same state. Out of people who lived in different houses, 7% moved from different state. Out of people who lived in different houses, 12% moved from abroad.
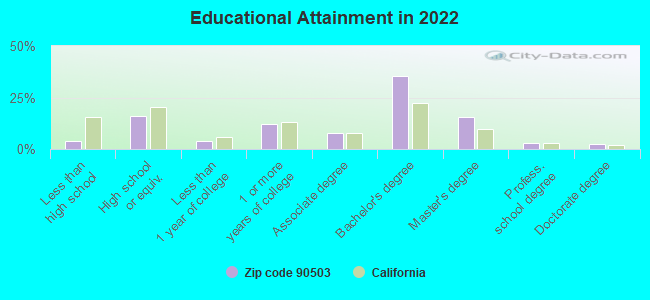
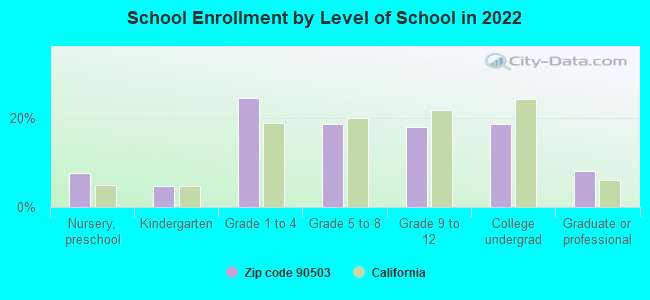
Private vs. public school enrollment:
Students in private schools in grades 1 to 8 (elementary and middle school): 580
Here:
13.6%
California:
10.5%
Students in private schools in grades 9 to 12 (high school): 59
Here:
3.4%
California:
8.5%
Students in private undergraduate colleges: 403
Here:
21.8%
California:
15.9%
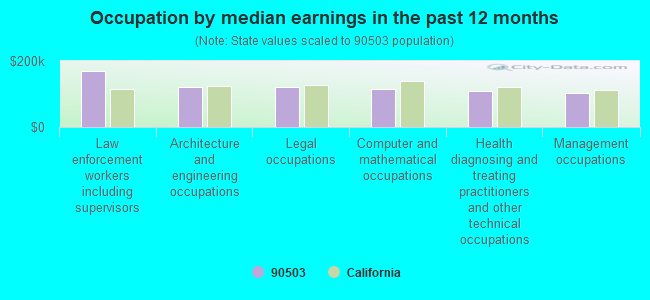
Occupation by median earnings in the past 12 months ($)
170,833Law enforcement workers including supervisors
119,937Architecture and engineering occupations
119,862Legal occupations
116,641Computer and mathematical occupations
108,435Health diagnosing and treating practitioners and other technical occupations
101,968Management occupations
Companies with biggest federal contracts located in this zip code (TORRANCE, CA):
SYSTEMS DRS SENSOR INC (3500 TORRANCE BLVD) : $150,623,193 in 107 contractsfrom 1999 to 2006
Contracts for Electrical and Electronic assemblies, Boards, Cards, and Associated Hardware, Night Vision Equipment, Emitted and Reflected Radiation, Other Research and Development -- Basic Research (R&D), Specialized Shipping and Storage Containers, and moreby Army, Navy, Defense Advanced Research Projects Agency, Air Force, and others Signed by year:2000: $86,302,846; 2001: $23,658,305; 2002: $7,433,723; 2003: $10,985,978; 2004: $5,004,996; 2005: $2,945,035; 2006: $1,628,508.
Biggest contracts:
$38,940,770 with Army for Electrical and Electronic assemblies, Boards, Cards, and Associated Hardware. Signed on 2000-11-30. Completion date: 2002-12-31.
$24,930,229, same as above.Signed on 2000-02-14. Completion date: 2002-12-31.
$12,488,426 with Army for Night Vision Equipment, Emitted and Reflected Radiation. Signed on 1999-12-21. Completion date: 2001-12-31.
$7,835,889 with Army for Electrical and Electronic assemblies, Boards, Cards, and Associated Hardware. Signed on 2000-09-29. Completion date: 2002-12-31.
F A SYSTEMS INC (326 MAPLE AVE; small business) : $9,394,505 in 553 contractsfrom 2001 to 2006
Contracts for ADP Central Processing Unit (CPU, Computer), Hybrid, ADP Support Equipment, Other ADP and Telecommunications Services (includes data storage on tapes, compact disks, etc.), ADP Central Processing Unit (CPU, Computer), Analog, and moreby Virginia Contracting Activity, Centers for Disease Control and Prevention, Department of Defense, Defense Information Systems Agency, and others Signed by year:2000: $0; 2001: $188,650; 2002: $107,145; 2003: $1,058,334; 2004: $4,261,112; 2005: $2,664,973; 2006: $1,114,291.
Biggest contracts:
$819,975 with Virginia Contracting Activity for ADP Central Processing Unit (CPU, Computer), Hybrid. Taking place in AL. Signed on 2004-09-09. Completion date: 2004-10-10.
$488,013, same as above.Signed on 2004-09-09. Completion date: 2004-10-10.
$212,303 with Centers for Disease Control and Prevention for ADP Support Equipment. Taking place in GA. Signed on 2004-06-17. Completion date: 2004-07-02.
$171,448 with Department of Defense for Other ADP and Telecommunications Services (includes data storage on tapes, compact disks, etc.). Taking place in DC. Signed on 2005-09-20. Completion date: 2005-10-20.
MARK RESOURCES, INC (3878 W CARSON ST STE 210; small business) : $6,244,972 in 37 contractsfrom 1999 to 2006
Contracts for Defense Missile and Space Systems -- Advanced Development (R&D), Other Research and Development -- Basic Research (R&D), Services -- Advanced Development (R&D), Defense Electronics and Communication Equipment -- Advanced Development (R&D), and moreby Army, Air Force, Navy, Missile Defense Agency, and others Signed by year:2000: -$327,008; 2001: $773,026; 2002: $440,000; 2003: $1,675,161; 2004: $1,633,085; 2005: $1,235,708; 2006: $270,000.
Biggest contracts:
$750,000 with Army for Defense Missile and Space Systems -- Advanced Development (R&D). Signed on 2005-05-12. Completion date: 2007-05-12.
$650,000, same as above.Signed on 2004-07-22. Completion date: 2006-07-21.
$500,000 with Army for Other Research and Development -- Basic Research (R&D). Signed on 2001-12-12. Completion date: 2002-12-31.
$400,000 with Air Force for Services -- Advanced Development (R&D). Signed on 2003-05-02. Completion date: 2005-06-17.
A & P DEVELOPMENT & CONSTRUCTI (3555 VOYAGER ST STE B; small business) : $6,201,069 in 24 contractsfrom 2003 to 2006
Contracts for Maintenance, Repair or Alteration of Real Property -- Other Non-Building Facilities, Maintenance, Repair or Alteration of Real Property -- Other Conservation and Development Facilities, Maintenance, Repair or Alteration of Real Property -- Office Buildings, Maintenance, Repair or Alteration of Real Property -- Other Administrative Facilities and Service Buildings, and moreby Navy, Air Force, Public Buildings Service Signed by year:2000: $0; 2001: $0; 2002: $0; 2003: $2,328,244; 2004: $3,315,323; 2005: $517,711; 2006: $39,791.
Biggest contracts:
$2,049,748 with Navy for Maintenance, Repair or Alteration of Real Property -- Other Non-Building Facilities. Signed on 2003-06-25. Completion date: 2004-02-05.
$1,049,999 with Air Force for Maintenance, Repair or Alteration of Real Property -- Other Conservation and Development Facilities. Signed on 2004-09-30. Completion date: 2005-03-29.
$642,402, same as above.Signed on 2004-09-30. Completion date: 2005-03-29.
$498,439 with Air Force for Maintenance, Repair or Alteration of Real Property -- Office Buildings. Signed on 2005-09-30. Completion date: 2005-11-30.
DKD INC (3500 TORRANCE BLVD; small business) : $5,098,835 in 10 contractsfrom 2000 to 2003
Contracts for Other Research and Development -- Basic Research (R&D), Night Vision Equipment, Emitted and Reflected Radiation by Army, Air Force Signed by year:2000: $200,000; 2001: $1,064,743; 2002: $2,585,092; 2003: $1,249,000; 2004: $0; 2005: $0; 2006: $0.
Biggest contracts:
$1,630,092 with Army for Other Research and Development -- Basic Research (R&D). Signed on 2002-06-10. Completion date: 2004-08-30.
$989,743, same as above.Signed on 2001-07-02. Completion date: 2002-04-15.
$949,000, same as above.Signed on 2003-03-13. Completion date: 2001-01-30.
$390,000, same as above.Signed on 2002-12-12. Completion date: 2001-01-30.
FISCHER CUSTOM COMMUNICATION I (20603 EARL ST; small business) : $4,776,110 in 74 contractsfrom 1999 to 2006
Contracts for ADP Telecommunications and Transmission Services, Other Defense -- Applied Research and Exploratory Development (R&D), Other Defense -- Engineering Development (R&D), Electrical and Electronic Properties Measuring and Testing Instruments, and moreby Navy, Department of Defense, Air Force, Federal Technology Service, and others Signed by year:2000: $536,336; 2001: $903,017; 2002: $817,490; 2003: $711,365; 2004: $329,678; 2005: $1,070,016; 2006: $118,177.
Biggest contracts:
$568,237 with Navy for ADP Telecommunications and Transmission Services. Signed on 2001-05-07. Completion date: 2001-09-18.
$492,740 with Department of Defense for Other Defense -- Applied Research and Exploratory Development (R&D). Signed on 2002-07-30. Completion date: 2003-03-31.
$350,000 with Department of Defense for Other Defense -- Engineering Development (R&D). Signed on 2000-05-02. Completion date: 2001-11-01.
$350,000 with Air Force for Electrical and Electronic Properties Measuring and Testing Instruments. Signed on 2005-05-19. Completion date: 2006-02-19.
THINKOM SOLUTIONS, INC (3825 DEL AMO BLVD ,; small business) 50 employees, $0 revenue. : $3,531,630 in 14 contractsfrom 2002 to 2006
Contracts for Other Defense -- Basic Research (R&D), Defense Electronics and Communication Equipment -- Basic Research (R&D), Radar Equipment, Except Airborne, Other Defense -- Applied Research and Exploratory Development (R&D), and moreby Air Force, Navy, Army Signed by year:2000: $0; 2001: $0; 2002: $139,811; 2003: $196,480; 2004: $750,846; 2005: $1,839,493; 2006: $605,000.
Biggest contracts:
$1,196,714 with Air Force for Other Defense -- Basic Research (R&D). Signed on 2005-09-27. Completion date: 2007-05-23.
$375,846, same as above.Signed on 2004-05-25. Completion date: 2006-08-23.
$375,000, same as above.Signed on 2006-06-12. Completion date: 2008-05-15.
$375,000 with Air Force for Defense Electronics and Communication Equipment -- Basic Research (R&D). Signed on 2004-08-25. Completion date: 2006-08-14.
C V B COMPANY (JOINT VENTURE) (2730 MONTEREY ST STE 108) : $2,959,160 in 44 contractsfrom 1999 to 2006
Contracts for Aircraft Maintenance and Repair Shop Specialized Equipment, Gas Generating and Dispensing Systems, Fixed or Mobile, Commercial and Industrial Gas Cylinders, Other Special Studies and Analyses, and moreby Air Force, Defense Logistics Agency, Navy, Army, and others Signed by year:2000: $474,071; 2001: $330,000; 2002: $662,175; 2003: $417,054; 2004: $623,650; 2005: $263,827; 2006: $108,208.
Biggest contracts:
$345,000 with Air Force for Aircraft Maintenance and Repair Shop Specialized Equipment. Signed on 2000-05-24. Completion date: 2001-05-23.
$330,000 with Defense Logistics Agency for Gas Generating and Dispensing Systems, Fixed or Mobile. Signed on 2001-04-20. Completion date: 2001-08-18.
$175,500 with Navy for Gas Generating and Dispensing Systems, Fixed or Mobile. Signed on 2004-07-13. Completion date: 2004-11-30.
$161,360 with Army for Commercial and Industrial Gas Cylinders. Signed on 2002-09-21. Completion date: 2002-10-31.
MANAGEMENT HEALTHCARE PDTS (2720 MONTEREY ST STE 404; small business) : $685,908 in 9 contractsfrom 2000 to 2002
Contracts for Medical and Surgical Instruments, Equipment, and Supplies, Miscellaneous Communication Equipment, Construction of Structures and Facilities -- Other Hospital Buildings, Construction of Structures and Facilities -- Other Administrative Facilities and Service Buildings by Department of Veterans Affairs, Navy, Army Signed by year:2000: $131,975; 2001: $452,000; 2002: $101,933; 2003: $0; 2004: $0; 2005: $0; 2006: $0.
Biggest contracts:
$300,000 with Department of Veterans Affairs for Medical and Surgical Instruments, Equipment, and Supplies. Signed on 2001-08-15. Completion date: 2001-09-15.
$105,000 with Navy for Medical and Surgical Instruments, Equipment, and Supplies. Signed on 2001-02-21. Completion date: 2001-04-03.
$101,000 with Department of Veterans Affairs for Medical and Surgical Instruments, Equipment, and Supplies. Signed on 2000-06-15. Completion date: 2000-09-15.
$47,000 with Army for Miscellaneous Communication Equipment. Signed on 2001-07-13. Completion date: 2001-08-27.
A-AZTEC RENTS & SELLS INC (540 HAWAII AVENUE; small business) : $363,084 in 25 contractsfrom 2002 to 2006
Contracts for Tents and Tarpaulins, Individual Equipment, Textile Fabrics, Miscellaneous Items, and moreby Army, Navy, National Park Service, Department of Veterans Affairs, and others Signed by year:2000: $0; 2001: $0; 2002: $111,945; 2003: $39,448; 2004: $42,976; 2005: $96,067; 2006: $72,648.
Biggest contracts:
$52,510 with Army for Tents and Tarpaulins. Signed on 2005-09-26. Completion date: 2005-11-15.
$44,612 with Navy for Tents and Tarpaulins. Signed on 2002-09-17. Completion date: 2002-09-20.
$41,280 with Army for Tents and Tarpaulins. Signed on 2006-05-03. Completion date: 2006-06-26.
$41,000 with National Park Service for Tents and Tarpaulins. Signed on 2002-08-15. Completion date: 2004-08-15.
Top industries in this zip code by the number of employees in 2005:
Administrative and Support and Waste Management and Remediation Services: Temporary Help Services (250-499 employees: 3 establishments, 100-249 employees: 5 establishments, 50-99 employees: 2 establishments, 20-49 employees: 1 establishment, 10-19 employees: 1 establishment, 1-4 employees: 7 establishments)
Health Care and Social Assistance: General Medical and Surgical Hospitals (over 1000: 1, 1-4: 1)
Management of Companies and Enterprises: Corporate, Subsidiary, and Regional Managing Offices (250-499: 2, 100-249: 2, 20-49: 1, 10-19: 3, 5-9: 2, 1-4: 2)
Health Care and Social Assistance: Offices of Physicians (except Mental Health Specialists) (100-249: 2, 50-99: 1, 20-49: 6, 10-19: 9, 5-9: 30, 1-4: 99)
Administrative and Support and Waste Management and Remediation Services: Security Guards and Patrol Services (250-499: 2, 100-249: 1, 20-49: 1)
People in group quarters in 2010:
395 people in nursing facilities/skilled-nursing facilities
79 people in group homes intended for adults
15 people in workers' group living quarters and job corps centers
13 people in residential treatment centers for adults
4 people in other noninstitutional facilities
3 people in group homes for juveniles (non-correctional)
People in group quarters in 2000:
463 people in nursing homes
97 people in other group homes
71 people in hospitals/wards and hospices for chronically ill
71 people in other hospitals or wards for chronically ill
12 people in other noninstitutional group quarters
9 people in other nonhousehold living situations
8 people in religious group quarters
7 people in homes or halfway houses for drug/alcohol abuse
Fatal accident statistics in 2014:
Fatal accident count: 1
Vehicles involved in fatal accidents: 1
Fatal accidents caused by drunken drivers: 0
Fatalities: 1
Persons involved in fatal accidents: 1
Pedestrians involved in fatal accidents: 1
Fatal accident statistics in 2013:
Fatal accident count: 3
Vehicles involved in fatal accidents: 3
Fatal accidents caused by drunken drivers: 0
Fatalities: 3
Persons involved in fatal accidents: 3
Pedestrians involved in fatal accidents: 2
Home Mortgage Disclosure Act Aggregated Statistics For Year 2009 (Based on 13 full and 2 partial tracts)
A) FHA, FSA/RHS & VA Home Purchase Loans
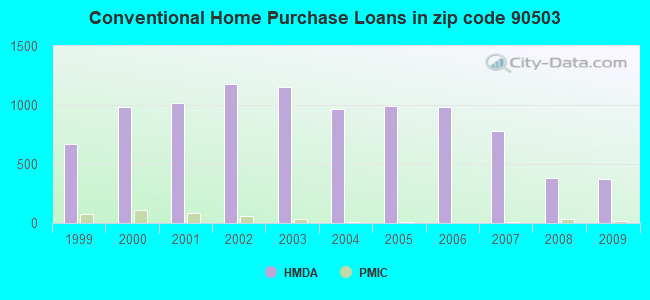
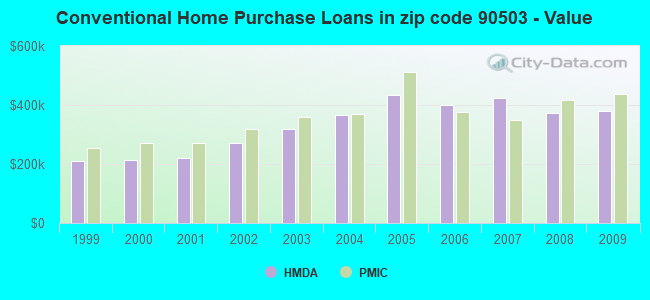
B) Conventional Home Purchase Loans
C) Refinancings
D) Home Improvement Loans
E) Loans on Dwellings For 5+ Families
F) Non-occupant Loans on < 5 Family Dwellings (A B C & D)
G) Loans On Manufactured Home Dwelling (A B C & D)
Number
Average Value
Number
Average Value
Number
Average Value
Number
Average Value
Number
Average Value
Number
Average Value
Number
Average Value
LOANS ORIGINATED
78
$551,743
374
$379,810
2,044
$332,448
115
$244,732
1
$910,000
142
$314,604
4
$87,000
APPLICATIONS APPROVED, NOT ACCEPTED
2
$405,740
45
$396,871
222
$371,557
10
$138,818
0
$0
19
$288,970
2
$111,500
APPLICATIONS DENIED
2
$661,055
51
$395,147
393
$392,106
18
$362,118
1
$965,000
45
$305,845
1
$113,000
APPLICATIONS WITHDRAWN
9
$464,580
57
$375,015
272
$361,954
15
$222,883
0
$0
30
$306,825
0
$0
FILES CLOSED FOR INCOMPLETENESS
1
$270,980
15
$431,619
84
$381,082
7
$161,183
0
$0
5
$427,200
1
$118,000
Aggregated Statistics For Year 2008 (Based on 13 full and 2 partial tracts)
A) FHA, FSA/RHS & VA Home Purchase Loans
B) Conventional Home Purchase Loans
C) Refinancings
D) Home Improvement Loans
E) Loans on Dwellings For 5+ Families
F) Non-occupant Loans on < 5 Family Dwellings (A B C & D)
G) Loans On Manufactured Home Dwelling (A B C & D)
Number
Average Value
Number
Average Value
Number
Average Value
Number
Average Value
Number
Average Value
Number
Average Value
Number
Average Value
LOANS ORIGINATED
26
$529,557
384
$374,226
718
$354,416
56
$185,281
5
$3,188,000
105
$328,299
4
$98,250
APPLICATIONS APPROVED, NOT ACCEPTED
0
$0
81
$390,137
153
$399,365
11
$250,896
0
$0
35
$350,985
5
$117,788
APPLICATIONS DENIED
6
$456,333
77
$452,765
305
$431,058
22
$119,109
0
$0
23
$277,455
1
$166,000
APPLICATIONS WITHDRAWN
1
$551,000
69
$391,723
123
$397,325
15
$184,222
2
$15,833,600
14
$296,329
0
$0
FILES CLOSED FOR INCOMPLETENESS
2
$632,250
23
$406,647
44
$442,071
5
$43,830
0
$0
6
$304,807
0
$0
Aggregated Statistics For Year 2007 (Based on 13 full and 2 partial tracts)
B) Conventional Home Purchase Loans
C) Refinancings
D) Home Improvement Loans
E) Loans on Dwellings For 5+ Families
F) Non-occupant Loans on < 5 Family Dwellings (A B C & D)
G) Loans On Manufactured Home Dwelling (A B C & D)
Number
Average Value
Number
Average Value
Number
Average Value
Number
Average Value
Number
Average Value
Number
Average Value
LOANS ORIGINATED
776
$422,044
887
$367,215
89
$185,416
8
$4,680,625
165
$475,294
1
$114,000
APPLICATIONS APPROVED, NOT ACCEPTED
152
$410,979
167
$393,043
27
$267,827
1
$600,000
28
$316,313
3
$99,197
APPLICATIONS DENIED
141
$397,898
363
$425,575
41
$212,176
1
$645,000
48
$388,329
6
$114,913
APPLICATIONS WITHDRAWN
102
$349,615
196
$400,459
23
$306,377
2
$4,587,500
19
$321,345
1
$114,000
FILES CLOSED FOR INCOMPLETENESS
34
$504,629
67
$372,050
8
$183,600
0
$0
8
$288,118
0
$0
Aggregated Statistics For Year 2006 (Based on 13 full and 2 partial tracts)
B) Conventional Home Purchase Loans
C) Refinancings
D) Home Improvement Loans
E) Loans on Dwellings For 5+ Families
F) Non-occupant Loans on < 5 Family Dwellings (A B C & D)
G) Loans On Manufactured Home Dwelling (A B C & D)
Number
Average Value
Number
Average Value
Number
Average Value
Number
Average Value
Number
Average Value
Number
Average Value
LOANS ORIGINATED
983
$401,135
1,189
$388,057
156
$234,314
16
$2,923,188
218
$362,414
4
$58,000
APPLICATIONS APPROVED, NOT ACCEPTED
155
$388,582
197
$399,662
30
$177,717
0
$0
38
$344,197
2
$88,125
APPLICATIONS DENIED
277
$408,169
346
$390,888
48
$166,096
0
$0
70
$313,836
2
$76,500
APPLICATIONS WITHDRAWN
156
$416,812
300
$407,056
40
$278,065
1
$4,750,000
35
$312,232
0
$0
FILES CLOSED FOR INCOMPLETENESS
32
$372,440
67
$370,856
5
$408,386
0
$0
12
$265,887
0
$0
Aggregated Statistics For Year 2005 (Based on 13 full and 2 partial tracts)
B) Conventional Home Purchase Loans
C) Refinancings
D) Home Improvement Loans
E) Loans on Dwellings For 5+ Families
F) Non-occupant Loans on < 5 Family Dwellings (A B C & D)
G) Loans On Manufactured Home Dwelling (A B C & D)
Number
Average Value
Number
Average Value
Number
Average Value
Number
Average Value
Number
Average Value
Number
Average Value
LOANS ORIGINATED
995
$433,615
1,514
$355,991
199
$221,844
11
$2,064,182
211
$335,699
1
$104,000
APPLICATIONS APPROVED, NOT ACCEPTED
151
$447,096
210
$356,331
23
$191,532
0
$0
20
$429,918
4
$84,000
APPLICATIONS DENIED
243
$438,996
357
$366,933
56
$188,871
0
$0
36
$462,736
4
$81,250
APPLICATIONS WITHDRAWN
216
$453,949
384
$350,702
63
$222,815
0
$0
33
$390,805
0
$0
FILES CLOSED FOR INCOMPLETENESS
45
$371,856
62
$387,320
18
$119,841
0
$0
9
$453,644
0
$0
Aggregated Statistics For Year 2004 (Based on 13 full and 2 partial tracts)
A) FHA, FSA/RHS & VA Home Purchase Loans
B) Conventional Home Purchase Loans
C) Refinancings
D) Home Improvement Loans
E) Loans on Dwellings For 5+ Families
F) Non-occupant Loans on < 5 Family Dwellings (A B C & D)
G) Loans On Manufactured Home Dwelling (A B C & D)
Number
Average Value
Number
Average Value
Number
Average Value
Number
Average Value
Number
Average Value
Number
Average Value
Number
Average Value
LOANS ORIGINATED
0
$0
969
$367,445
2,278
$301,613
173
$227,995
13
$2,236,825
259
$292,841
3
$72,667
APPLICATIONS APPROVED, NOT ACCEPTED
0
$0
183
$358,029
325
$319,096
28
$179,169
1
$820,000
38
$278,388
0
$0
APPLICATIONS DENIED
0
$0
135
$358,483
399
$338,748
57
$115,920
0
$0
43
$367,898
1
$61,000
APPLICATIONS WITHDRAWN
0
$0
131
$380,472
439
$334,823
16
$251,923
0
$0
31
$261,218
0
$0
FILES CLOSED FOR INCOMPLETENESS
1
$306,160
35
$395,379
83
$301,577
6
$313,235
0
$0
6
$299,868
0
$0
Aggregated Statistics For Year 2003 (Based on 13 full and 2 partial tracts)
A) FHA, FSA/RHS & VA Home Purchase Loans
B) Conventional Home Purchase Loans
C) Refinancings
D) Home Improvement Loans
E) Loans on Dwellings For 5+ Families
F) Non-occupant Loans on < 5 Family Dwellings (A B C & D)
Number
Average Value
Number
Average Value
Number
Average Value
Number
Average Value
Number
Average Value
Number
Average Value
LOANS ORIGINATED
0
$0
1,150
$318,113
5,537
$248,779
66
$119,310
23
$3,775,713
413
$234,212
APPLICATIONS APPROVED, NOT ACCEPTED
0
$0
147
$333,066
756
$256,090
17
$79,694
0
$0
48
$209,848
APPLICATIONS DENIED
0
$0
159
$313,277
635
$269,526
30
$63,601
1
$10,313,000
54
$238,741
APPLICATIONS WITHDRAWN
1
$235,000
134
$308,850
690
$257,060
11
$101,745
0
$0
63
$222,104
FILES CLOSED FOR INCOMPLETENESS
2
$192,200
47
$366,877
193
$278,850
11
$70,876
3
$5,733,333
18
$227,504
Aggregated Statistics For Year 2002 (Based on 13 full and 2 partial tracts)
A) FHA, FSA/RHS & VA Home Purchase Loans
B) Conventional Home Purchase Loans
C) Refinancings
D) Home Improvement Loans
E) Loans on Dwellings For 5+ Families
F) Non-occupant Loans on < 5 Family Dwellings (A B C & D)
Number
Average Value
Number
Average Value
Number
Average Value
Number
Average Value
Number
Average Value
Number
Average Value
LOANS ORIGINATED
2
$20,780
1,175
$272,283
3,956
$231,802
38
$67,044
13
$2,019,880
293
$221,959
APPLICATIONS APPROVED, NOT ACCEPTED
2
$211,000
132
$286,093
522
$226,707
19
$49,241
0
$0
39
$221,832
APPLICATIONS DENIED
0
$0
109
$294,460
404
$244,757
23
$68,032
0
$0
36
$274,636
APPLICATIONS WITHDRAWN
0
$0
177
$301,001
501
$242,430
12
$83,557
1
$17,000,000
28
$236,247
FILES CLOSED FOR INCOMPLETENESS
0
$0
44
$343,530
169
$238,134
0
$0
2
$10,750,000
16
$244,584
Aggregated Statistics For Year 2001 (Based on 13 full and 2 partial tracts)
A) FHA, FSA/RHS & VA Home Purchase Loans
B) Conventional Home Purchase Loans
C) Refinancings
D) Home Improvement Loans
E) Loans on Dwellings For 5+ Families
F) Non-occupant Loans on < 5 Family Dwellings (A B C & D)
Number
Average Value
Number
Average Value
Number
Average Value
Number
Average Value
Number
Average Value
Number
Average Value
LOANS ORIGINATED
44
$231,389
1,020
$219,728
2,377
$216,581
73
$34,517
8
$2,726,690
195
$201,965
APPLICATIONS APPROVED, NOT ACCEPTED
6
$225,970
135
$225,592
305
$214,174
23
$51,009
0
$0
23
$246,360
APPLICATIONS DENIED
3
$257,333
110
$224,197
466
$214,001
40
$52,150
0
$0
30
$235,726
APPLICATIONS WITHDRAWN
4
$105,000
129
$204,643
410
$221,673
23
$46,650
1
$5,500,000
31
$189,882
FILES CLOSED FOR INCOMPLETENESS
0
$0
25
$307,083
113
$228,185
6
$104,568
10
$2,630,000
3
$327,753
Aggregated Statistics For Year 2000 (Based on 13 full and 2 partial tracts)
A) FHA, FSA/RHS & VA Home Purchase Loans
B) Conventional Home Purchase Loans
C) Refinancings
D) Home Improvement Loans
E) Loans on Dwellings For 5+ Families
F) Non-occupant Loans on < 5 Family Dwellings (A B C & D)
Number
Average Value
Number
Average Value
Number
Average Value
Number
Average Value
Number
Average Value
Number
Average Value
LOANS ORIGINATED
3
$181,787
986
$213,213
453
$174,634
85
$54,173
7
$1,563,129
79
$178,538
APPLICATIONS APPROVED, NOT ACCEPTED
1
$286,620
140
$241,575
75
$149,759
28
$36,563
0
$0
12
$219,083
APPLICATIONS DENIED
2
$62,500
120
$217,732
182
$165,957
40
$69,557
1
$2,175,000
17
$180,699
APPLICATIONS WITHDRAWN
0
$0
112
$180,269
96
$125,734
8
$42,926
1
$1,315,000
11
$143,599
FILES CLOSED FOR INCOMPLETENESS
2
$130,000
33
$200,472
54
$232,976
5
$25,702
0
$0
4
$186,838
Aggregated Statistics For Year 1999 (Based on 7 full and 3 partial tracts)
A) FHA, FSA/RHS & VA Home Purchase Loans
B) Conventional Home Purchase Loans
C) Refinancings
D) Home Improvement Loans
E) Loans on Dwellings For 5+ Families
F) Non-occupant Loans on < 5 Family Dwellings (A B C & D)
2005 - 2018 National Fire Incident Reporting System (NFIRS) incidents
According to the data from the years 2005 - 2018 the average number of fires per year is 33. The highest number of fire incidents - 75 took place in 2005, and the least - 1 in 2010. The data has a declining trend.
When looking into fire subcategories, the most reports belonged to: Outside Fires (41.6%), and Structure Fires (33.5%).
Fire incident types reported to NFIRS in Zip Code 90503


+$3,462
-$7,562
 Nearest zip codes: 90505, 90277, 90504, 90278, 90501, 90260.


 According to the data from the years 2005 - 2018 the average number of fires per year is 33. The highest number of fire incidents - 75 took place in 2005, and the least - 1 in 2010. The data has a declining trend.
 When looking into fire subcategories, the most reports belonged to: Outside Fires (41.6%), and Structure Fires (33.5%).