Estimated zip code population in 2022: 26,756 Zip code population in 2010: 27,186 Zip code population in 2000: 26,089
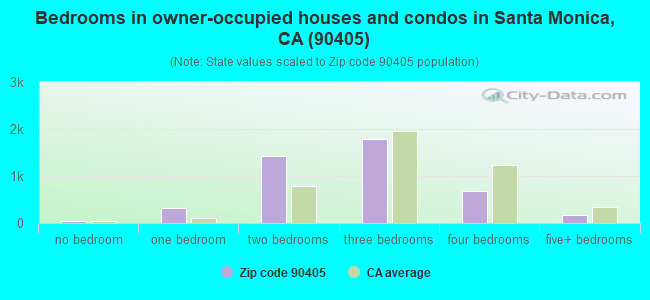
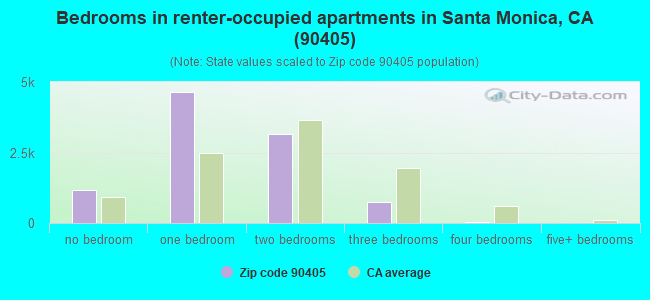
Houses and condos: 16,007 Renter-occupied apartments: 9,761
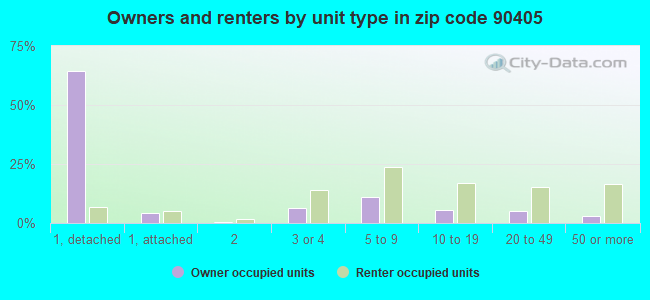
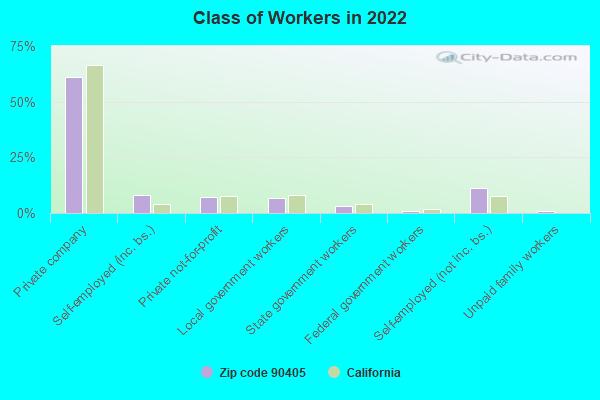
% of renters here:
69%
State:
44%
March 2022 cost of living index in zip code 90405: 150.3 (very high, U.S. average is 100)
Land area: 2.6 sq. mi. Water area: 0.2 sq. mi.
Population density: 10,109 people per square mile
(high).
OSM Map
General Map
Google Map
MSN Map
OSM Map
General Map
Google Map
MSN Map
OSM Map
General Map
Google Map
MSN Map
OSM Map
General Map
Google Map
MSN Map
Please wait while loading the map...
Real estate property taxes paid for housing units in 2022:
This zip code:
0.6% ($10,055)
California:
0.7% ($4,831)
Median real estate property taxes paid for housing units with mortgages in 2022: $10,330 (0.5%) Median real estate property taxes paid for housing units with no mortgage in 2022: $7,454 (0.5%)
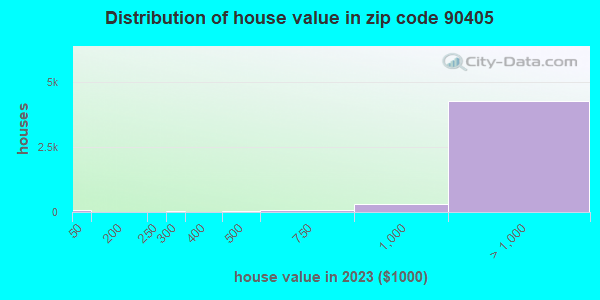
Estimated median house/condo value in 2022: $1,827,809
90405:
$1,827,809
California:
$715,900
According to our research of California and other state lists, there were 13 registered sex offenders living in 90405 zip code as of May 04, 2024. The ratio of all residents to sex offenders in zip code 90405 is 2,252 to 1. The ratio of registered sex offenders to all residents in this zip code is much lower than the state average.
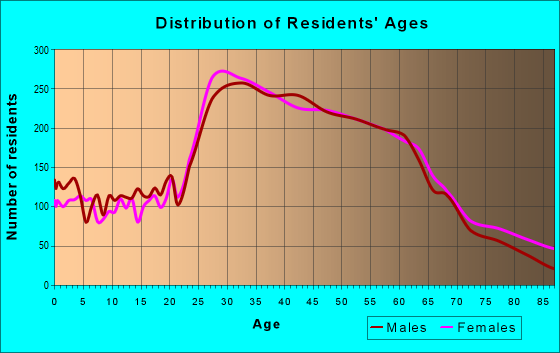
Median resident age:
This zip code:
42.0 years
California median age:
37.9 years
Average household size:
This zip code:
1.9 people
California:
2.8 people
Averages for the 2020 tax year for zip code 90405, filed in 2021:
Average Adjusted Gross Income (AGI) in 2020: $174,249 (Individual Income Tax Returns)
Here:
$174,249
State:
$95,910
Salary/wage: $140,516 (reported on 74.5% of returns)
Here:
$140,516
State:
$77,331
(% of AGI for various income ranges: 1109.7% for AGIs below $25k, 3877.8% for AGIs $25k-50k, 7436.4% for AGIs $50k-75k, 11504.6% for AGIs $75k-100k, 22324.2% for AGIs $100k-200k, 166148.2% for AGIs over 200k)
Taxable interest for individuals: $4,517 (reported on 48.0% of returns)
This zip code:
$4,517
California:
$2,294
(% of AGI for various income ranges: 61.1% for AGIs below $25k, 70.4% for AGIs $25k-50k, 131.4% for AGIs $50k-75k, 152.8% for AGIs $75k-100k, 416.3% for AGIs $100k-200k, 3599.5% for AGIs over 200k)
Ordinary dividends: $16,195 (reported on 41.8% of returns)
Here:
$16,195
State:
$10,949
(% of AGI for various income ranges: 109.9% for AGIs below $25k, 167.0% for AGIs $25k-50k, 317.0% for AGIs $50k-75k, 492.8% for AGIs $75k-100k, 955.0% for AGIs $100k-200k, 12431.3% for AGIs over 200k)
Net capital gain/loss in AGI: +$62,102 (reported on 39.7% of returns)
Here:
+$62,102
State:
+$49,306
(% of AGI for various income ranges: 35.6% for AGIs below $25k, 148.8% for AGIs $25k-50k, 344.2% for AGIs $50k-75k, 514.6% for AGIs $75k-100k, 1271.8% for AGIs $100k-200k, 54966.0% for AGIs over 200k)
Profit/loss from business: +$22,055 (reported on 29.3% of returns)
Here:
+$22,055
State:
+$15,671
(% of AGI for various income ranges: 310.3% for AGIs below $25k, 681.0% for AGIs $25k-50k, 740.6% for AGIs $50k-75k, 943.5% for AGIs $75k-100k, 1464.1% for AGIs $100k-200k, 7657.7% for AGIs over 200k)
Taxable individual retirement arrangement distribution: $29,173 (reported on 8.7% of returns)
90405:
$29,173
California:
$23,505
(% of AGI for various income ranges: 74.0% for AGIs below $25k, 177.7% for AGIs $25k-50k, 198.7% for AGIs $50k-75k, 426.8% for AGIs $75k-100k, 802.2% for AGIs $100k-200k, 2913.7% for AGIs over 200k)
Self-employed (Keogh) retirement plans: $29,402 (reported on 3.0% of returns)
90405:
$29,402
California:
$30,163
(% of AGI for various income ranges: 24.1% for AGIs $25k-50k, 37.9% for AGIs $50k-75k, 44.1% for AGIs $75k-100k, 137.4% for AGIs $100k-200k, 1625.6% for AGIs over 200k)
Total itemized deductions: $54,115 (reported on 20.1% of returns)
Here:
$54,115
State:
$39,517
(% of AGI for various income ranges: 235.7% for AGIs below $25k, 401.1% for AGIs $25k-50k, 669.9% for AGIs $50k-75k, 946.2% for AGIs $75k-100k, 2003.5% for AGIs $100k-200k, 18101.3% for AGIs over 200k)
Charity contributions: $13,811 (reported on 17.4% of returns)
Here:
$13,811
State:
$12,598
(% of AGI for various income ranges: 13.6% for AGIs below $25k, 31.6% for AGIs $25k-50k, 67.4% for AGIs $50k-75k, 113.8% for AGIs $75k-100k, 304.1% for AGIs $100k-200k, 4765.3% for AGIs over 200k)
Taxes paid: $8,879 (reported on 20.1% of returns)
90405:
$8,879
State:
$8,807
(% of AGI for various income ranges: 44.1% for AGIs below $25k, 78.6% for AGIs $25k-50k, 130.7% for AGIs $50k-75k, 230.0% for AGIs $75k-100k, 563.2% for AGIs $100k-200k, 2305.6% for AGIs over 200k)
Earned income credit: $1,273 (reported on 7.4% of returns)
Here:
$1,273
State:
$2,074
(% of AGI for various income ranges: 53.8% for AGIs below $25k, 33.8% for AGIs $25k-50k)
Percentage of individuals using paid preparers for their 2020 taxes: 92.8%
Here:
93%
State:
92%
(% for various income ranges: 89.3% for AGIs below $25k, 92.5% for AGIs $25k-50k, 92.7% for AGIs $50k-75k, 94.6% for AGIs $75k-100k, 94.2% for AGIs $100k-200k, 95.3% for AGIs over 200k)
Averages for the 2012 tax year for zip code 90405, filed in 2013:
Average Adjusted Gross Income (AGI) in 2012: $129,480 (Individual Income Tax Returns)
Here:
$129,480
State:
$72,726
Salary/wage: $102,990 (reported on 77.3% of returns)
Here:
$102,990
State:
$59,079
(% of AGI for various income ranges: 59.6% for AGIs below $25k, 71.3% for AGIs $25k-50k, 75.8% for AGIs $50k-75k, 74.6% for AGIs $75k-100k, 72.7% for AGIs $100k-200k, 54.2% for AGIs over 200k)
Taxable interest for individuals: $3,657 (reported on 48.2% of returns)
This zip code:
$3,657
California:
$2,146
(% of AGI for various income ranges: 2.7% for AGIs below $25k, 1.2% for AGIs $25k-50k, 1.0% for AGIs $50k-75k, 1.3% for AGIs $75k-100k, 1.0% for AGIs $100k-200k, 1.5% for AGIs over 200k)
Ordinary dividends: $13,315 (reported on 35.1% of returns)
Here:
$13,315
State:
$9,308
(% of AGI for various income ranges: 4.3% for AGIs below $25k, 2.3% for AGIs $25k-50k, 2.3% for AGIs $50k-75k, 2.6% for AGIs $75k-100k, 2.5% for AGIs $100k-200k, 4.3% for AGIs over 200k)
Net capital gain/loss in AGI: +$38,916 (reported on 32.0% of returns)
Here:
+$38,916
State:
+$30,460
(% of AGI for various income ranges: 0.4% for AGIs below $25k, 0.5% for AGIs $25k-50k, 1.0% for AGIs $50k-75k, 1.3% for AGIs $75k-100k, 1.6% for AGIs $100k-200k, 15.1% for AGIs over 200k)
Profit/loss from business: +$27,783 (reported on 29.7% of returns)
Here:
+$27,783
State:
+$17,064
(% of AGI for various income ranges: 19.8% for AGIs below $25k, 12.0% for AGIs $25k-50k, 7.7% for AGIs $50k-75k, 7.0% for AGIs $75k-100k, 6.5% for AGIs $100k-200k, 5.0% for AGIs over 200k)
Taxable individual retirement arrangement distribution: $24,713 (reported on 9.4% of returns)
90405:
$24,713
California:
$19,557
(% of AGI for various income ranges: 3.7% for AGIs below $25k, 2.3% for AGIs $25k-50k, 1.9% for AGIs $50k-75k, 2.2% for AGIs $75k-100k, 2.3% for AGIs $100k-200k, 1.5% for AGIs over 200k)
Self-employment retirement plans: $24,724 (reported on 3.0% of returns)
90405:
$24,724
California:
$24,530
(% of AGI for various income ranges: 0.3% for AGIs below $25k, 0.3% for AGIs $25k-50k, 0.3% for AGIs $50k-75k, 0.5% for AGIs $75k-100k, 0.7% for AGIs $100k-200k, 0.6% for AGIs over 200k)
Total itemized deductions: $44,389 (19% of AGI, reported on 48.0% of returns)
Here:
$44,389
State:
$34,004
Here:
19.2% of AGI
State:
22.7% of AGI
(% of AGI for various income ranges: 17.7% for AGIs below $25k, 14.1% for AGIs $25k-50k, 13.6% for AGIs $50k-75k, 16.5% for AGIs $75k-100k, 18.8% for AGIs $100k-200k, 16.2% for AGIs over 200k)
Charity contributions: $6,621 (reported on 39.8% of returns)
Here:
$6,621
State:
$4,659
(% of AGI for various income ranges: 0.9% for AGIs below $25k, 1.2% for AGIs $25k-50k, 1.2% for AGIs $50k-75k, 1.5% for AGIs $75k-100k, 1.6% for AGIs $100k-200k, 2.4% for AGIs over 200k)
Taxes paid: $23,192 (reported on 47.7% of returns)
90405:
$23,192
State:
$14,448
(% of AGI for various income ranges: 3.9% for AGIs below $25k, 3.2% for AGIs $25k-50k, 3.9% for AGIs $50k-75k, 6.4% for AGIs $75k-100k, 8.4% for AGIs $100k-200k, 10.0% for AGIs over 200k)
Earned income credit: $1,334 (reported on 9.4% of returns)
Here:
$1,334
State:
$2,286
(% of AGI for various income ranges: 3.1% for AGIs below $25k, 0.4% for AGIs $25k-50k)
Percentage of individuals using paid preparers for their 2012 taxes: 64.9%
Here:
65%
State:
64%
(% for various income ranges: 58.9% for AGIs below $25k, 60.4% for AGIs $25k-50k, 61.5% for AGIs $50k-75k, 63.1% for AGIs $75k-100k, 71.5% for AGIs $100k-200k, 82.2% for AGIs over 200k)
Averages for the 2004 tax year for zip code 90405, filed in 2005:
Average Adjusted Gross Income (AGI) in 2004: $92,480 (Individual Income Tax Returns)
Here:
$92,480
State:
$58,600
Salary/wage: $75,938 (reported on 76.6% of returns)
Here:
$75,938
State:
$49,455
(% of AGI for various income ranges: 65.1% for AGIs $10k-25k, 78.2% for AGIs $25k-50k, 78.8% for AGIs $50k-75k, 76.5% for AGIs $75k-100k, 56.0% for AGIs over 100k)
Taxable interest for individuals: $3,967 (reported on 56.0% of returns)
This zip code:
$3,967
California:
$2,365
(% of AGI for various income ranges: 3.3% for AGIs $10k-25k, 2.3% for AGIs $25k-50k, 1.7% for AGIs $50k-75k, 2.2% for AGIs $75k-100k, 2.3% for AGIs over 100k)
Taxable dividends: $5,398 (reported on 37.4% of returns)
Here:
$5,398
State:
$4,746
(% of AGI for various income ranges: 2.8% for AGIs $10k-25k, 1.8% for AGIs $25k-50k, 1.7% for AGIs $50k-75k, 1.7% for AGIs $75k-100k, 2.2% for AGIs over 100k)
Net capital gain/loss: +$25,691 (reported on 33.7% of returns)
Here:
+$25,691
State:
+$23,418
(% of AGI for various income ranges: -0.3% for AGIs $10k-25k, 0.7% for AGIs $25k-50k, 1.2% for AGIs $50k-75k, 1.6% for AGIs $75k-100k, 12.9% for AGIs over 100k)
Profit/loss from business: +$29,045 (reported on 30.2% of returns)
Here:
+$29,045
State:
+$16,826
(% of AGI for various income ranges: 18.3% for AGIs $10k-25k, 8.8% for AGIs $25k-50k, 6.9% for AGIs $50k-75k, 7.4% for AGIs $75k-100k, 9.5% for AGIs over 100k)
IRA payment deduction: $3,042 (reported on 4.6% of returns)
90405:
$3,042
California:
$3,192
(% of AGI for various income ranges: 0.5% for AGIs $10k-25k, 0.4% for AGIs $25k-50k, 0.2% for AGIs $50k-75k, 0.2% for AGIs $75k-100k, 0.1% for AGIs over 100k)
Self-employed pension: $18,474 (reported on 4.0% of returns)
Here:
$18,474
California:
$17,688
(% of AGI for various income ranges: 0.3% for AGIs $10k-25k, 0.4% for AGIs $25k-50k, 0.5% for AGIs $50k-75k, 0.9% for AGIs $75k-100k, 0.9% for AGIs over 100k)
Total itemized deductions: $36,805 (21% of AGI, reported on 45.7% of returns)
Here:
$36,805
State:
$28,113
Here:
21.5% of AGI
State:
25.3% of AGI
(% of AGI for various income ranges: 17.3% for AGIs $10k-25k, 14.3% for AGIs $25k-50k, 18.5% for AGIs $50k-75k, 21.2% for AGIs $75k-100k, 17.9% for AGIs over 100k)
Charity contributions deductions: $7,593 (4% of AGI, reported on 40.8% of returns)
Here:
$7,593
State:
$3,923
Here:
4.2% of AGI
State:
3.3% of AGI
(% of AGI for various income ranges: 1.4% for AGIs $10k-25k, 1.5% for AGIs $25k-50k, 1.9% for AGIs $50k-75k, 2.1% for AGIs $75k-100k, 4.0% for AGIs over 100k)
Total tax: $20,652 (reported on 84.6% of returns)
90405:
$20,652
State:
$10,761
(% of AGI for various income ranges: 6.9% for AGIs $10k-25k, 9.9% for AGIs $25k-50k, 12.5% for AGIs $50k-75k, 13.4% for AGIs $75k-100k, 21.9% for AGIs over 100k)
Earned income credit: $965 (reported on 8.5% of returns)
Here:
$965
State:
$1,763
Percentage of individuals using paid preparers for their 2004 taxes: 68.1%
Here:
68%
State:
66%
(% for various income ranges: 64.2% for AGIs below $10k, 66.7% for AGIs $10k-25k, 61.3% for AGIs $25k-50k, 67.1% for AGIs $50k-75k, 73.2% for AGIs $75k-100k, 79.4% for AGIs over 100k)
Likely homosexual households (counted as self-reported same-sex unmarried-partner households)
Lesbian couples: 0.0% of all households
Gay men: 0.1% of all households
Household received Food Stamps/SNAP in the past 12 months: 1,095 Household did not receive Food Stamps/SNAP in the past 12 months: 12,997
Women who had a birth in the past 12 months: 137 (126 now married, 10 unmarried) Women who did not have a birth in the past 12 months: 6,684 (2,237 now married, 4,464 unmarried)
Housing units in zip code 90405 with a mortgage: 2,723 (405 second mortgage, 391 both second mortgage and home equity loan) Houses without a mortgage: 20
Median monthly owner costs for units with a mortgage: $3,876 Median monthly owner costs for units without a mortgage: $1,052
Residents with income below the poverty level in 2022:
This zip code:
10.8%
Whole state:
12.2%
Residents with income below 50% of the poverty level in 2022:
This zip code:
3.0%
Whole state:
6.2%
Median number of rooms in houses and condos:
Here:
5.4
State:
6.0
Median number of rooms in apartments:
Here:
3.2
State:
3.9
Notable locations in this zip code not listed on our city pages
Notable locations in zip code 90405: Santa Monica Business Park (A), Ocean Park Pier (B), California Heritage Museum (C), Santa Monica Museum of Art (D), Santa Monica College Library (E), Ocean Park Branch Santa Monica Public Library (F), Museum of Flying (G), Joslyn Park Community Building (H), City of Santa Monica Fire Department Station 5 (I), Fairview Branch Santa Monica Public Library (J), City of Santa Monica Fire Department Station 2 (K). Display/hide their locations on the map
Churches in zip code 90405 include: Sunset Park Christian Church (A), Sermon on the Mountain Church (B), Saint Clements Roman Catholic Church (C), Phillips Chapel Christian Methodist Episcopal Church (D), Ocean Park United Methodist Church (E), Mount Olive Lutheran Church (F), First Southern Baptist Church (G), The Church of Jesus Christ of Latter Day Saints (H). Display/hide their locations on the map
Parks in zip code 90405 include: Corsair Stadium (1), Crescent Bay Park (2), Hotchkiss Park (3), Joslyn Park (4), Los Amigos Park (5), Marine Park (6), Clover Park (7), Ozone Park (8). Display/hide their locations on the map
2,615 married couples with children.
882 single-parent households (183 men, 699 women).
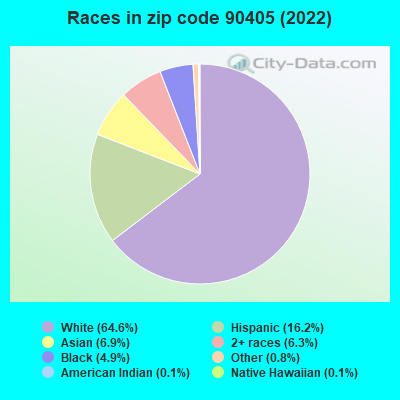
73.0% of residents of 90405 zip code speak English at home.
10.6% of residents speak Spanish at home (77% very well, 13% well, 8% not well, 3% not at all).
7.7% of residents speak other Indo-European language at home (76% very well, 18% well, 6% not well).
5.6% of residents speak Asian or Pacific Island language at home (67% very well, 17% well, 11% not well, 5% not at all).
3.1% of residents speak other language at home (81% very well, 7% well, 12% not well).
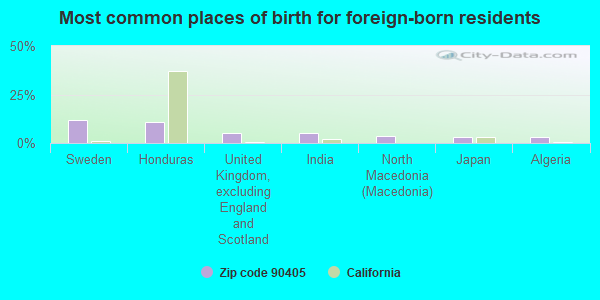
Foreign born population: 5,597 (20.9%) (70.4% of them are naturalized citizens)
Major facilities with environmental interests located in this zip code:
CHEVRON STATION 9 3779 (2328 PICO BLVD in SANTA MONICA, CA)
STATE MASTER (California - Hazardous Waste Tracking) - HAZARDOU WASTE PROGRAM Small Quantity Generators, between 100 kg and 1000 kg of hazardous waste/month (Resource Conservation and Recovery Act (tracking hazardous waste)) - notification Organizations: CHEVRON PRODUCTS CO (CONTACT/OWNER)
Alternative names: CHEVRON STATION NO 93779
ADAMS (JOHN) MIDDLE (2425 16TH ST. in SANTA MONICA, CA)
(National Center for Education Statistics) - STATE ID-6058531 Organizations: SANTA MONICA-MALIBU UNIFIED (SCHOOL DISTRICT)
GRANT ELEMENTARY (2368 PEARL ST. in SANTA MONICA, CA)
(National Center for Education Statistics) - STATE ID-6022560 Organizations: SANTA MONICA-MALIBU UNIFIED (SCHOOL DISTRICT)
MUIR (JOHN) ELEMENTARY (2526 SIXTH ST. in SANTA MONICA, CA)
(National Center for Education Statistics) - STATE ID-6022578 Organizations: SANTA MONICA-MALIBU UNIFIED (SCHOOL DISTRICT)
BAE SYSTEMS (3400 AIRPORT AVENUE in SANTA MONICA, CA)
CRITERIA AND HAZARDOUS AIR POLLUTANT INVENTORY (Inventory of air pollution sources) Small Quantity Generators, between 100 kg and 1000 kg of hazardous waste/month (Resource Conservation and Recovery Act (tracking hazardous waste)) - notification TRI REPORTER (Tracking of toxic chemicals releasing facilities) Business SIC classification: ELECTRONIC COMPONENTS Organizations: B A E SYSTEMS N AMERICA (CONTACT/OWNER)
Alternative names: B A E SYSTEMS AIRCRAFT CONTROLS, LEAR ASTRONICS CORPORATION
APARTMENT HOUSE (227 STRAND in SANTA MONICA, CA)
Large Quantity Generators, more that 1000 kg of hazardous waste/month (Resource Conservation and Recovery Act (tracking hazardous waste)) Organizations: HMH ASCIATES, INC. (CONTACT/OPERATOR)
, BRF PROPERTIES, LTD. (CONTACT/OWNER)
MODERN CLEANERS (3308 PICO BLVD in SANTA MONICA, CA)
(Resource Conservation and Recovery Act (tracking hazardous waste)) Organizations: YOUNG K YI (CONTACT/OWNER)
ERICK & SONS TRANSP INC (2313 32ND ST in SANTA MONICA, CA)
TRANSPORTER (Resource Conservation and Recovery Act (tracking hazardous waste)) Organizations: ERICKSON BRENDA & ROBERT (CONTACT/OWNER)
INSTA TUNE (2307 LINCOLN BLVD in SANTA MONICA, CA)
Small Quantity Generators, between 100 kg and 1000 kg of hazardous waste/month (Resource Conservation and Recovery Act (tracking hazardous waste)) - notification Business NAICS classification: OTHER AUTOMOTIVE MECHANICAL AND ELECTRICAL REPAIR AND MAINTENANCE. Organizations: PAULINE WILLHEMAEM (CONTACT/OWNER)
L A STORY INC (3000 ARRPORT AVE BLDG 2 in SANTA MONICA, CA)
Small Quantity Generators, between 100 kg and 1000 kg of hazardous waste/month (Resource Conservation and Recovery Act (tracking hazardous waste)) - notification
LINCOLN CLEANERS INC (2432 LINCOLN BLVD in SANTA MONICA, CA)
Small Quantity Generators, between 100 kg and 1000 kg of hazardous waste/month (Resource Conservation and Recovery Act (tracking hazardous waste)) - notification Organizations: ELIAHO DAVIDYAN (CONTACT/OWNER)
CHARLES CLEANERS (2611 LINCOLN BLVD in SANTA MONICA, CA)
Small Quantity Generators, between 100 kg and 1000 kg of hazardous waste/month (Resource Conservation and Recovery Act (tracking hazardous waste)) Organizations: CHARLES G REDICK (CONTACT/OWNER)
MODEL CLEANERS (1618 OCEAN PARK BLVD in SANTA MONICA, CA)
Small Quantity Generators, between 100 kg and 1000 kg of hazardous waste/month (Resource Conservation and Recovery Act (tracking hazardous waste)) Organizations: KUHARIK KAMBAN (CONTACT/OWNER)
Housing units lacking complete plumbing facilities: 0.5% Housing units lacking complete kitchen facilities: 2.8%
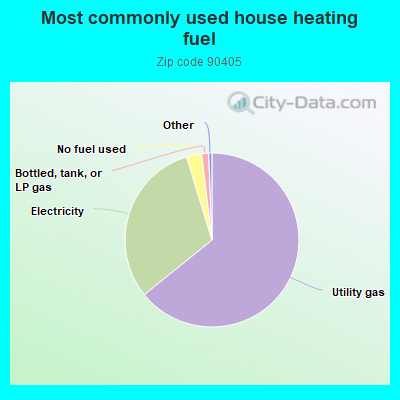
64.2%Utility gas
31.1%Electricity
2.8%No fuel used
1.3%Bottled, tank, or LP gas
Population in 1990: 26,081. Population change in the 1990s: +8 (+0.0%).
Place of birth for U.S.-born residents:
This state: 11,094
Northeast: 3,979
Midwest: 1,973
South: 2,144
West: 873
57% of the 90405 zip code residents lived in the same house 5 years ago. Out of people who lived in different houses, 70% lived in this county. Out of people who lived in different counties, 50% lived in California.
88% of the 90405 zip code residents lived in the same house 1 year ago. Out of people who lived in different houses, 66% moved from this county. Out of people who lived in different houses, 10% moved from different county within same state. Out of people who lived in different houses, 16% moved from different state. Out of people who lived in different houses, 7% moved from abroad.
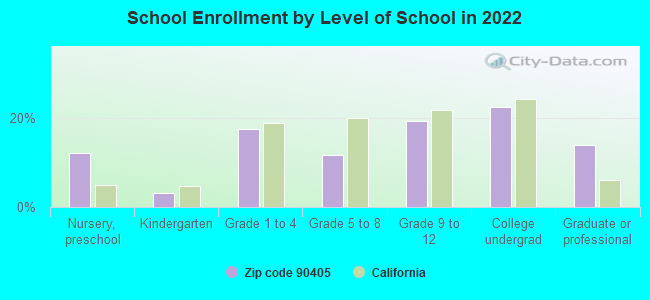
Private vs. public school enrollment:
Students in private schools in grades 1 to 8 (elementary and middle school): 335
Here:
23.9%
California:
10.5%
Students in private schools in grades 9 to 12 (high school): 154
Here:
17.0%
California:
8.5%
Students in private undergraduate colleges: 217
Here:
20.5%
California:
15.9%
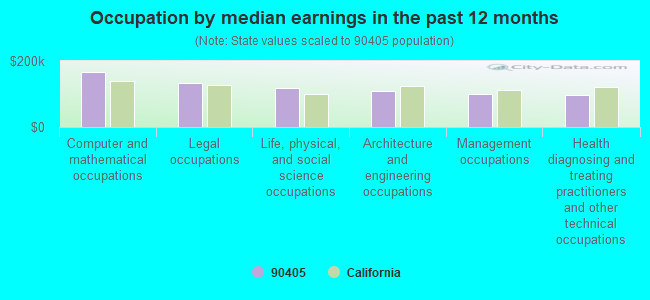
Occupation by median earnings in the past 12 months ($)
166,553Computer and mathematical occupations
132,191Legal occupations
117,176Life, physical, and social science occupations
110,027Architecture and engineering occupations
101,186Management occupations
97,845Health diagnosing and treating practitioners and other technical occupations
Companies with federal contracts located in this zip code (SANTA MONICA, CA):
INTELLIGENT SYSTEMS TECHNOLOGY (3250 OCEAN PARK BOULEVARD,; small business) : $13,054,054 in 60 contractsfrom 1999 to 2006
Contracts for Other Research and Development -- Management and Support (R&D), Training/Curriculum Development, Defense Electronics and Communication Equipment -- Basic Research (R&D), Other Defense -- Applied Research and Exploratory Development (R&D), and moreby Air Force, Navy, Army, National Institute of Standards and Technology, and others Signed by year:2000: $1,559,747; 2001: $1,393,012; 2002: $2,534,197; 2003: $2,510,363; 2004: $1,664,999; 2005: $2,701,974; 2006: $354,762.
Biggest contracts:
$750,000 with Air Force for Other Research and Development -- Management and Support (R&D). Signed on 2003-08-12. Completion date: 2005-07-29.
$622,000 with Navy for Training/Curriculum Development. Signed on 2005-09-26. Completion date: 2006-09-25.
$450,000, same as above.Signed on 2002-05-17. Completion date: 2003-09-30.
$400,000 with Army for Defense Electronics and Communication Equipment -- Basic Research (R&D). Signed on 2002-08-02. Completion date: 2004-01-21.
BERKUT ENGINEERING AND DESIGN, (3025 AIRPORT AVE; small business) : $1,275,676 in 3 contractsfrom 2004 to 2005
$582,034 with Air Force for Airframe Structural Components. Signed on 2005-04-15. Completion date: 2005-12-01.
$348,549, same as above.Signed on 2004-06-08. Completion date: 2004-10-08.
$345,093, same as above.Signed on 2004-09-28. Completion date: 2004-10-08.
LIVINGSTON STERN & ASSOCIATES (3101 OCEAN PARK BLVD STE 1; small business) 750 employees, $0 revenue. : $261,383 in 30 contractsfrom 2003 to 2006
Contracts for Food Cooking, Baking, and Serving Equipment, Drugs and Biologicals, Miscellaneous Items, Medical and Surgical Instruments, Equipment, and Supplies, and moreby Defense Logistics Agency, Forest Service, Army Signed by year:2000: $0; 2001: $0; 2002: $0; 2003: $5,195; 2004: $67,308; 2005: $136,240; 2006: $52,640.
Biggest contracts:
$64,800 with Defense Logistics Agency for Food Cooking, Baking, and Serving Equipment. Signed on 2004-02-20. Completion date: 2004-03-28.
$24,246 with Defense Logistics Agency for Drugs and Biologicals. Signed on 2005-07-20. Completion date: 2005-07-21.
$18,517 with Forest Service for Miscellaneous Items. Taking place in MT. Signed on 2006-06-30. Completion date: 2006-07-15.
$17,034 with Defense Logistics Agency for Medical and Surgical Instruments, Equipment, and Supplies. Signed on 2005-06-02. Completion date: 2005-06-10.
SMARTWEAR, LLC (1802 OCEAN PARK BLVD; small business) : $240,000 in 3 contractsfrom 2005 to 2006
$100,000 with Missile Defense Agency for Defense Missile and Space Systems -- Basic Research (R&D). Signed on 2006-04-20. Completion date: 2006-10-20.
$70,000 with Navy for Other Defense -- Applied Research and Exploratory Development (R&D). Signed on 2005-11-15. Completion date: 2006-08-14.
$70,000 with Army for Textiles, Clothing and Equipage -- Basic Research (R&D). Signed on 2005-11-14. Completion date: 2006-09-13.
STRUCTURAL RESEARCH & ANALYSIS (3000 OCEAN PARK BLVD STE 2) : $113,288 in 23 contractsfrom 2003 to 2006
Contracts for ADP Software, , Maintenance, Repair and Rebuilding of Equipment -- Miscellaneous, ADP System Acquisition Support Services. Includes preparation of statement of work, benchmarks, specifications, etc., and moreby Air Force, Navy, NASA, Army, and others Signed by year:2000: $0; 2001: $0; 2002: $0; 2003: $9,750; 2004: $31,538; 2005: $49,350; 2006: $22,650.
Biggest contracts:
$11,925 with Air Force for ADP Software. Signed on 2006-03-15. Completion date: 2007-03-31.
$11,460, same as above.Signed on 2005-03-15. Completion date: 2006-03-31.
$7,800 with Navy for ADP Software. Taking place in WA. Signed on 2005-07-28. Completion date: 2006-08-31.
$7,240 with Navy for ADP Software. Signed on 2005-06-20. Completion date: 2006-06-27.
NUVEX INC (2633 LINCOLN BLVD STE 410) : $38,013 in 2 contractsfrom 2002 to 2005
$29,213 with Navy for Cable, Cord, and Wire Assemblies: Communications Equipment. Signed on 2002-08-16. Completion date: 2002-09-20.
$8,800 with Defense Logistics Agency for Miscellaneous Items. Signed on 2005-09-12. Completion date: 2005-10-12.
AMERICAN ROGUE (3000 31ST ST)
$35,508 with Navy for Video Recording and Reproducing Equipment. Signed on 2003-09-30. Completion date: 2003-09-30.
STEVE BEAUREGARD CORPORATION (2112 PICO BLVD; small business) 500 employees, $0 revenue. Woman Owned Business: $27,021 in 2 contractsin 2004
$15,224 with Air Force for Telephone and/or Communications Services (includes Telegraph, Telex, and Cablevision Services). Taking place in MS. Signed on 2004-10-01. Completion date: 2005-09-30.
$11,797 with Army for ADP Input/Output and Storage Devices. Signed on 2004-09-22. Completion date: 2004-11-21.
ORGANIZATIONAL PERFORMACE DIME (2621 6TH STREET SUITE 2; small business)
$9,750 with Air Force for Data Analyses (other than scientific). Signed on 2003-09-12. Completion date: 2004-08-28.
Top industries in this zip code by the number of employees in 2005:
2005 - 2018 National Fire Incident Reporting System (NFIRS) incidents
According to the data from the years 2005 - 2018 the average number of fires per year is 36. The highest number of fire incidents - 64 took place in 2005, and the least - 0 in 2007. The data has a declining trend.
When looking into fire subcategories, the most reports belonged to: Structure Fires (52.0%), and Outside Fires (30.4%).
Fire incident types reported to NFIRS in Zip Code 90405


 Nearest zip codes: 90404, 90291, 90401, 90403, 90292, 90066.


 According to the data from the years 2005 - 2018 the average number of fires per year is 36. The highest number of fire incidents - 64 took place in 2005, and the least - 0 in 2007. The data has a declining trend.
 When looking into fire subcategories, the most reports belonged to: Structure Fires (52.0%), and Outside Fires (30.4%).