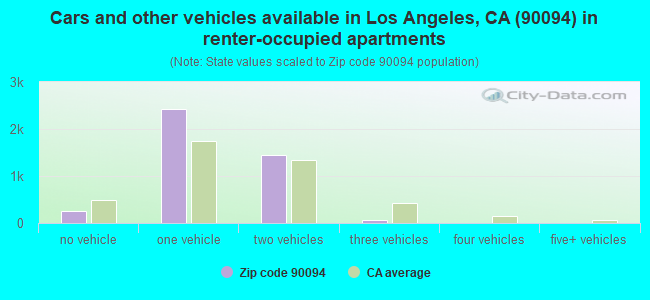
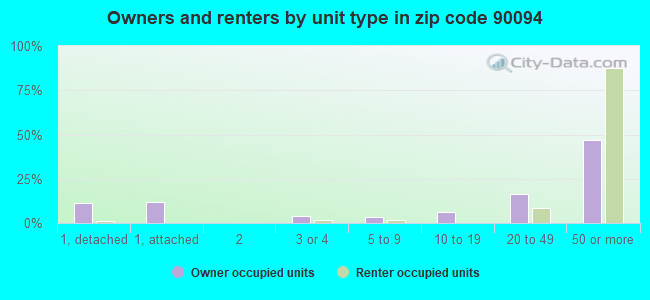
Houses and condos: 6,635 Renter-occupied apartments: 4,183
% of renters here:
70%
State:
44%
March 2022 cost of living index in zip code 90094: 129.1 (high, U.S. average is 100)
Land area: 0.6 sq. mi. Water area: 0.0 sq. mi.
Population density: 19,311 people per square mile
(very high).
OSM Map
Google Map
MSN Map
OSM Map
General Map
Google Map
MSN Map
OSM Map
Google Map
MSN Map
OSM Map
Google Map
MSN Map
Please wait while loading the map...
Real estate property taxes paid for housing units in 2022:
This zip code:
0.8% ($10,292)
California:
0.7% ($4,831)
Median real estate property taxes paid for housing units with mortgages in 2022: $10,330 (0.8%) Median real estate property taxes paid for housing units with no mortgage in 2022: $10,572 (0.6%)
Business Search- 14 Million verified businesses
Males: 5,541
(47.0%)
Females: 6,251
(53.0%)
For population 25 years and over in 90094:
High school or higher: 101.3%
Bachelor's degree or higher: 87.0%
Graduate or professional degree: 43.4%
Unemployed: 3.3%
Mean travel time to work (commute): 29.0 minutes
For population 15 years and over in 90094:
Never married: 34.8%
Now married: 51.9%
Separated: 0.7%
Widowed: 2.8%
Divorced: 9.7%
Zip code 90094 compared to state average:
Median household income above state average.
Median house value above state average.
Hispanic race population percentage below state average.
Renting percentage above state average.
Number of rooms per house below state average.
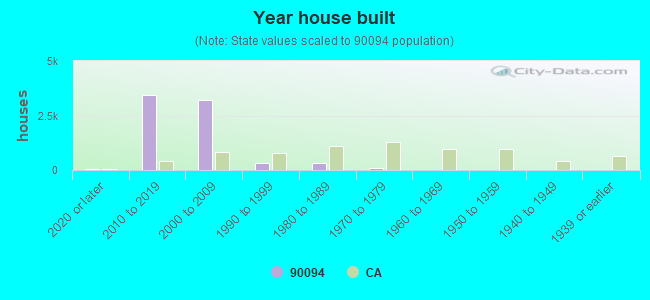
House age significantly below state average.
Percentage of population with a bachelor's degree or higher significantly above state average.
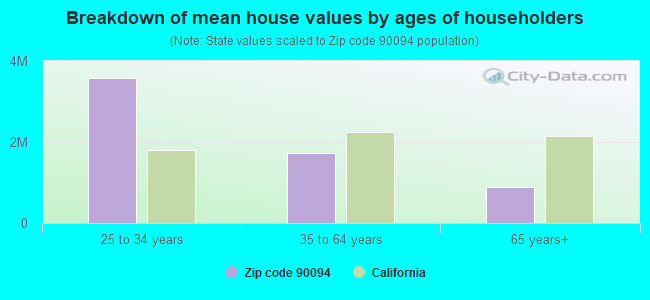
Estimated median house/condo value in 2022: $1,366,866
90094:
$1,366,866
California:
$715,900
According to our research of California and other state lists, there were 3 registered sex offenders living in 90094 zip code as of May 04, 2024. The ratio of all residents to sex offenders in zip code 90094 is 2,729 to 1. The ratio of registered sex offenders to all residents in this zip code is much lower than the state average.
Median resident age:
This zip code:
37.3 years
California median age:
37.9 years
Average household size:
This zip code:
2.0 people
California:
2.8 people
Averages for the 2020 tax year for zip code 90094, filed in 2021:
Average Adjusted Gross Income (AGI) in 2020: $202,061 (Individual Income Tax Returns)
Here:
$202,061
State:
$95,910
Salary/wage: $172,806 (reported on 81.0% of returns)
Here:
$172,806
State:
$77,331
(% of AGI for various income ranges: 1082.6% for AGIs below $25k, 4031.5% for AGIs $25k-50k, 7838.9% for AGIs $50k-75k, 10838.2% for AGIs $75k-100k, 23027.5% for AGIs $100k-200k, 121452.3% for AGIs over 200k)
Taxable interest for individuals: $3,324 (reported on 50.8% of returns)
This zip code:
$3,324
California:
$2,294
(% of AGI for various income ranges: 57.4% for AGIs below $25k, 75.8% for AGIs $25k-50k, 78.6% for AGIs $50k-75k, 80.3% for AGIs $75k-100k, 206.9% for AGIs $100k-200k, 1576.7% for AGIs over 200k)
Ordinary dividends: $9,091 (reported on 45.6% of returns)
Here:
$9,091
State:
$10,949
(% of AGI for various income ranges: 125.0% for AGIs below $25k, 152.4% for AGIs $25k-50k, 257.1% for AGIs $50k-75k, 280.9% for AGIs $75k-100k, 639.7% for AGIs $100k-200k, 3568.7% for AGIs over 200k)
Net capital gain/loss in AGI: +$58,461 (reported on 46.2% of returns)
Here:
+$58,461
State:
+$49,306
(% of AGI for various income ranges: 153.2% for AGIs below $25k, 245.5% for AGIs $25k-50k, 239.1% for AGIs $50k-75k, 316.5% for AGIs $75k-100k, 986.5% for AGIs $100k-200k, 32435.1% for AGIs over 200k)
Profit/loss from business: +$22,852 (reported on 23.2% of returns)
Here:
+$22,852
State:
+$15,671
(% of AGI for various income ranges: 228.7% for AGIs below $25k, 434.5% for AGIs $25k-50k, 517.1% for AGIs $50k-75k, 527.1% for AGIs $75k-100k, 1076.3% for AGIs $100k-200k, 3547.7% for AGIs over 200k)
Taxable individual retirement arrangement distribution: $31,756 (reported on 7.7% of returns)
90094:
$31,756
California:
$23,505
(% of AGI for various income ranges: 53.9% for AGIs below $25k, 158.5% for AGIs $25k-50k, 184.9% for AGIs $50k-75k, 215.3% for AGIs $75k-100k, 460.2% for AGIs $100k-200k, 1868.5% for AGIs over 200k)
Self-employed (Keogh) retirement plans: $29,750 (reported on 2.8% of returns)
90094:
$29,750
California:
$30,163
(% of AGI for various income ranges: 71.5% for AGIs $25k-50k, 124.0% for AGIs $100k-200k, 800.8% for AGIs over 200k)
Total itemized deductions: $37,857 (reported on 27.4% of returns)
Here:
$37,857
State:
$39,517
(% of AGI for various income ranges: 324.5% for AGIs below $25k, 573.9% for AGIs $25k-50k, 668.9% for AGIs $50k-75k, 1042.1% for AGIs $75k-100k, 1824.8% for AGIs $100k-200k, 8043.8% for AGIs over 200k)
Charity contributions: $9,461 (reported on 22.8% of returns)
Here:
$9,461
State:
$12,598
(% of AGI for various income ranges: 14.5% for AGIs below $25k, 38.5% for AGIs $25k-50k, 53.7% for AGIs $50k-75k, 109.4% for AGIs $75k-100k, 247.5% for AGIs $100k-200k, 2186.9% for AGIs over 200k)
Taxes paid: $9,438 (reported on 27.4% of returns)
90094:
$9,438
State:
$8,807
(% of AGI for various income ranges: 78.4% for AGIs below $25k, 150.3% for AGIs $25k-50k, 144.9% for AGIs $50k-75k, 318.8% for AGIs $75k-100k, 561.4% for AGIs $100k-200k, 1792.3% for AGIs over 200k)
Earned income credit: $1,281 (reported on 4.2% of returns)
Here:
$1,281
State:
$2,074
(% of AGI for various income ranges: 44.5% for AGIs below $25k, 30.3% for AGIs $25k-50k)
Percentage of individuals using paid preparers for their 2020 taxes: 94.4%
Here:
94%
State:
92%
(% for various income ranges: 90.9% for AGIs below $25k, 94.3% for AGIs $25k-50k, 93.1% for AGIs $50k-75k, 94.3% for AGIs $75k-100k, 95.5% for AGIs $100k-200k, 95.8% for AGIs over 200k)
Averages for the 2012 tax year for zip code 90094, filed in 2013:
Average Adjusted Gross Income (AGI) in 2012: $132,115 (Individual Income Tax Returns)
Here:
$132,115
State:
$72,726
Salary/wage: $119,189 (reported on 85.2% of returns)
Here:
$119,189
State:
$59,079
(% of AGI for various income ranges: 76.7% for AGIs below $25k, 78.3% for AGIs $25k-50k, 84.9% for AGIs $50k-75k, 80.2% for AGIs $75k-100k, 83.1% for AGIs $100k-200k, 72.1% for AGIs over 200k)
Taxable interest for individuals: $1,608 (reported on 52.1% of returns)
This zip code:
$1,608
California:
$2,146
(% of AGI for various income ranges: 1.7% for AGIs below $25k, 1.1% for AGIs $25k-50k, 0.7% for AGIs $50k-75k, 0.7% for AGIs $75k-100k, 0.6% for AGIs $100k-200k, 0.6% for AGIs over 200k)
Ordinary dividends: $6,416 (reported on 35.2% of returns)
Here:
$6,416
State:
$9,308
(% of AGI for various income ranges: 2.2% for AGIs below $25k, 1.9% for AGIs $25k-50k, 1.2% for AGIs $50k-75k, 1.2% for AGIs $75k-100k, 1.2% for AGIs $100k-200k, 2.1% for AGIs over 200k)
Net capital gain/loss in AGI: +$17,089 (reported on 33.1% of returns)
Here:
+$17,089
State:
+$30,460
(% of AGI for various income ranges: 1.4% for AGIs below $25k, 0.3% for AGIs $25k-50k, 0.4% for AGIs $50k-75k, 1.5% for AGIs $100k-200k, 7.3% for AGIs over 200k)
Profit/loss from business: +$23,736 (reported on 24.3% of returns)
Here:
+$23,736
State:
+$17,064
(% of AGI for various income ranges: 15.9% for AGIs below $25k, 11.8% for AGIs $25k-50k, 3.9% for AGIs $50k-75k, 5.9% for AGIs $75k-100k, 4.2% for AGIs $100k-200k, 3.4% for AGIs over 200k)
Taxable individual retirement arrangement distribution: $21,810 (reported on 7.4% of returns)
90094:
$21,810
California:
$19,557
(% of AGI for various income ranges: 1.7% for AGIs below $25k, 1.8% for AGIs $25k-50k, 2.2% for AGIs $50k-75k, 2.0% for AGIs $75k-100k, 1.3% for AGIs $100k-200k, 0.9% for AGIs over 200k)
Self-employment retirement plans: $23,833 (reported on 3.2% of returns)
90094:
$23,833
California:
$24,530
Total itemized deductions: $41,247 (22% of AGI, reported on 62.3% of returns)
Here:
$41,247
State:
$34,004
Here:
22.2% of AGI
State:
22.7% of AGI
(% of AGI for various income ranges: 23.0% for AGIs below $25k, 20.3% for AGIs $25k-50k, 20.4% for AGIs $50k-75k, 22.7% for AGIs $75k-100k, 21.1% for AGIs $100k-200k, 17.8% for AGIs over 200k)
Charity contributions: $3,692 (reported on 51.4% of returns)
Here:
$3,692
State:
$4,659
(% of AGI for various income ranges: 1.1% for AGIs below $25k, 1.3% for AGIs $25k-50k, 1.7% for AGIs $50k-75k, 1.4% for AGIs $75k-100k, 1.5% for AGIs $100k-200k, 1.4% for AGIs over 200k)
Taxes paid: $20,311 (reported on 62.3% of returns)
90094:
$20,311
State:
$14,448
(% of AGI for various income ranges: 6.7% for AGIs below $25k, 5.1% for AGIs $25k-50k, 6.8% for AGIs $50k-75k, 8.9% for AGIs $75k-100k, 9.7% for AGIs $100k-200k, 10.4% for AGIs over 200k)
Earned income credit: $1,281 (reported on 5.6% of returns)
Here:
$1,281
State:
$2,286
(% of AGI for various income ranges: 2.7% for AGIs below $25k, 0.3% for AGIs $25k-50k)
Percentage of individuals using paid preparers for their 2012 taxes: 62.7%
Here:
63%
State:
64%
(% for various income ranges: 58.3% for AGIs below $25k, 53.5% for AGIs $25k-50k, 57.5% for AGIs $50k-75k, 63.6% for AGIs $75k-100k, 65.7% for AGIs $100k-200k, 74.0% for AGIs over 200k)
Averages for the 2004 tax year for zip code 90094, filed in 2005:
Average Adjusted Gross Income (AGI) in 2004: $83,751 (Individual Income Tax Returns)
Here:
$83,751
State:
$58,600
Salary/wage: $78,155 (reported on 88.1% of returns)
Here:
$78,155
State:
$49,455
(% of AGI for various income ranges: 360.1% for AGIs below $10k, 84.2% for AGIs $10k-25k, 86.2% for AGIs $25k-50k, 89.1% for AGIs $50k-75k, 89.3% for AGIs $75k-100k, 78.2% for AGIs over 100k)
Taxable interest for individuals: $1,673 (reported on 53.1% of returns)
This zip code:
$1,673
California:
$2,365
(% of AGI for various income ranges: 21.7% for AGIs below $10k, 0.8% for AGIs $10k-25k, 0.6% for AGIs $25k-50k, 0.8% for AGIs $50k-75k, 0.8% for AGIs $75k-100k, 1.2% for AGIs over 100k)
Taxable dividends: $2,563 (reported on 30.5% of returns)
Here:
$2,563
State:
$4,746
(% of AGI for various income ranges: 14.3% for AGIs below $10k, 0.9% for AGIs $10k-25k, 0.7% for AGIs $25k-50k, 0.7% for AGIs $50k-75k, 0.6% for AGIs $75k-100k, 1.0% for AGIs over 100k)
Net capital gain/loss: +$7,799 (reported on 31.6% of returns)
Here:
+$7,799
State:
+$23,418
(% of AGI for various income ranges: -18.2% for AGIs below $10k, -1.1% for AGIs $10k-25k, -0.3% for AGIs $25k-50k, 0.2% for AGIs $50k-75k, 0.1% for AGIs $75k-100k, 4.6% for AGIs over 100k)
Profit/loss from business: +$15,392 (reported on 24.1% of returns)
Here:
+$15,392
State:
+$16,826
(% of AGI for various income ranges: 9.4% for AGIs below $10k, 11.2% for AGIs $10k-25k, 4.9% for AGIs $25k-50k, 5.0% for AGIs $50k-75k, 5.5% for AGIs $75k-100k, 3.8% for AGIs over 100k)
IRA payment deduction: $3,086 (reported on 4.2% of returns)
90094:
$3,086
California:
$3,192
Self-employed pension: $16,059 (reported on 2.5% of returns)
Here:
$16,059
California:
$17,688
Total itemized deductions: $29,636 (24% of AGI, reported on 59.3% of returns)
Here:
$29,636
State:
$28,113
Here:
24.3% of AGI
State:
25.3% of AGI
(% of AGI for various income ranges: 157.1% for AGIs below $10k, 16.7% for AGIs $10k-25k, 19.1% for AGIs $25k-50k, 25.9% for AGIs $50k-75k, 25.2% for AGIs $75k-100k, 19.3% for AGIs over 100k)
Charity contributions deductions: $2,979 (2% of AGI, reported on 51.3% of returns)
Here:
$2,979
State:
$3,923
Here:
2.3% of AGI
State:
3.3% of AGI
(% of AGI for various income ranges: 4.4% for AGIs below $10k, 1.7% for AGIs $10k-25k, 1.7% for AGIs $25k-50k, 2.2% for AGIs $50k-75k, 2.5% for AGIs $75k-100k, 1.6% for AGIs over 100k)
Total tax: $15,287 (reported on 87.4% of returns)
90094:
$15,287
State:
$10,761
(% of AGI for various income ranges: 16.7% for AGIs below $10k, 5.6% for AGIs $10k-25k, 8.8% for AGIs $25k-50k, 11.3% for AGIs $50k-75k, 12.8% for AGIs $75k-100k, 18.8% for AGIs over 100k)
Earned income credit: $1,192 (reported on 7.1% of returns)
Here:
$1,192
State:
$1,763
Percentage of individuals using paid preparers for their 2004 taxes: 62.1%
Here:
62%
State:
66%
(% for various income ranges: 57.6% for AGIs below $10k, 57.2% for AGIs $10k-25k, 60.7% for AGIs $25k-50k, 60.7% for AGIs $50k-75k, 64.9% for AGIs $75k-100k, 67.2% for AGIs over 100k)
Likely homosexual households (counted as self-reported same-sex unmarried-partner households)
Lesbian couples: 0.0% of all households
Gay men: 0.2% of all households
Household received Food Stamps/SNAP in the past 12 months: 70 Household did not receive Food Stamps/SNAP in the past 12 months: 5,788
Women who had a birth in the past 12 months: 209 (113 now married, 97 unmarried) Women who did not have a birth in the past 12 months: 3,168 (1,823 now married, 1,321 unmarried)
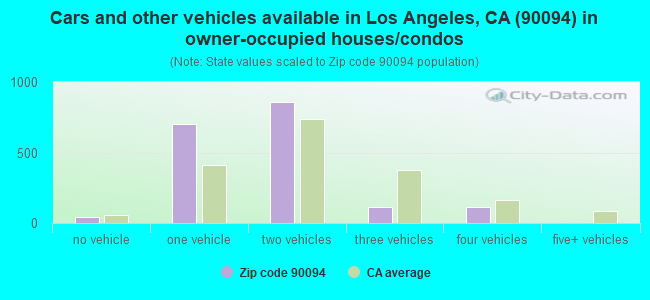
Housing units in zip code 90094 with a mortgage: 1,328 (50 second mortgage, 52 both second mortgage and home equity loan) Median monthly owner costs for units with a mortgage: $3,876 Median monthly owner costs for units without a mortgage: $1,556
Residents with income below the poverty level in 2022:
This zip code:
6.2%
Whole state:
12.2%
Residents with income below 50% of the poverty level in 2022:
This zip code:
0.9%
Whole state:
6.2%
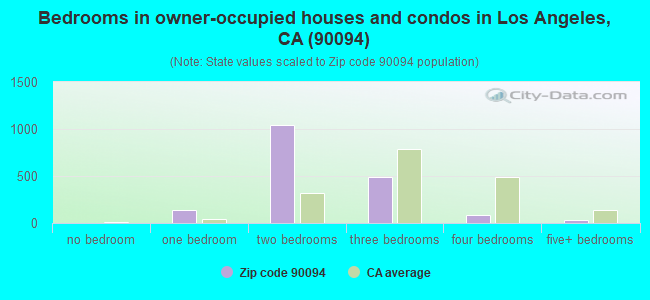
Median number of rooms in houses and condos:
Here:
4.9
State:
6.0
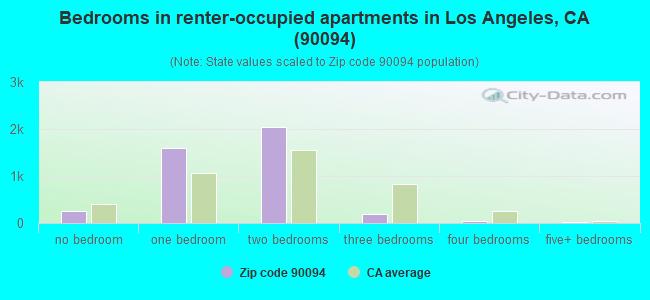
Median number of rooms in apartments:
Here:
3.3
State:
3.9
Notable locations in this zip code not listed on our city pages
In group quarters: 45 (-1 institutionalized population)
Size of family households: 1,516 2-persons, 841 3-persons, 507 4-persons, 12 5-persons
Size of nonfamily households: 2,428 1-person, 715 2-persons, 48 3-persons
1,814 married couples with children.
540 single-parent households (350 men, 190 women).
67.3% of residents of 90094 zip code speak English at home.
6.9% of residents speak Spanish at home (87% very well, 9% well, 4% not well).
14.6% of residents speak other Indo-European language at home (74% very well, 16% well, 9% not well).
10.3% of residents speak Asian or Pacific Island language at home (76% very well, 24% well).
0.9% of residents speak other language at home (100% very well).
Foreign born population: 2,650 (22.5%) (46.7% of them are naturalized citizens)
This zip code:
22.5%
Whole state:
26.7%
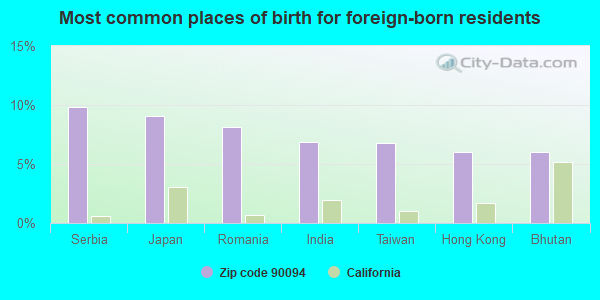
10%Serbia
9%Japan
8%Romania
7%India
7%Taiwan
6%Hong Kong
6%Bhutan
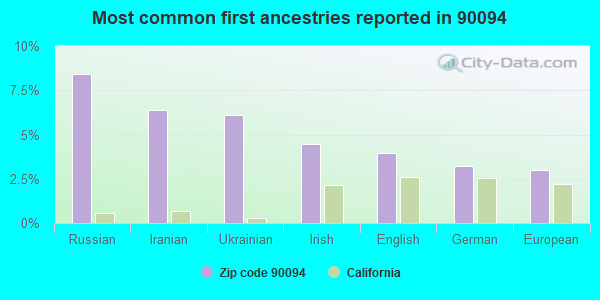
8%Russian
6%Iranian
6%Ukrainian
4%Irish
4%English
3%German
3%European
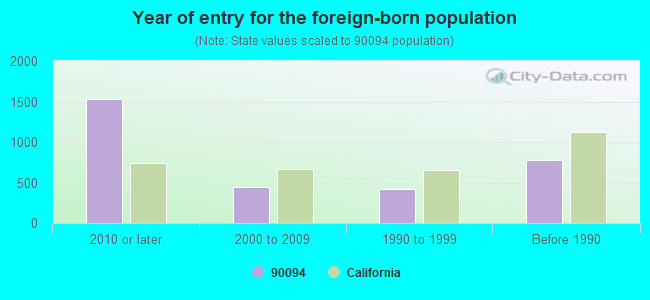
Year of entry for the foreign-born population
1,5372010 or later
4442000 to 2009
4191990 to 1999
778Before 1990
There are 19 Medical Specialists in Zip Code 90094.Housing units lacking complete plumbing facilities: 0.5% Housing units lacking complete kitchen facilities: 1.7%
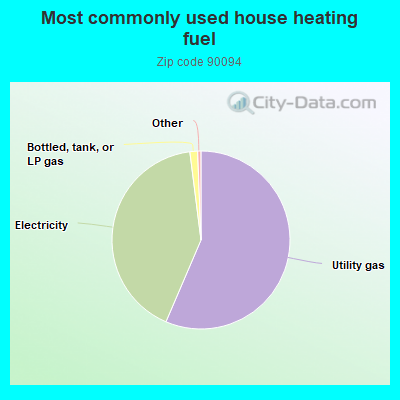
56.5%Utility gas
41.6%Electricity
1.4%Bottled, tank, or LP gas
Place of birth for U.S.-born residents:
This state: 4,720
Northeast: 1,449
Midwest: 1,379
South: 790
West: 343
79% of the 90094 zip code residents lived in the same house 1 year ago. Out of people who lived in different houses, 68% moved from this county. Out of people who lived in different houses, 4% moved from different county within same state. Out of people who lived in different houses, 20% moved from different state. Out of people who lived in different houses, 5% moved from abroad.
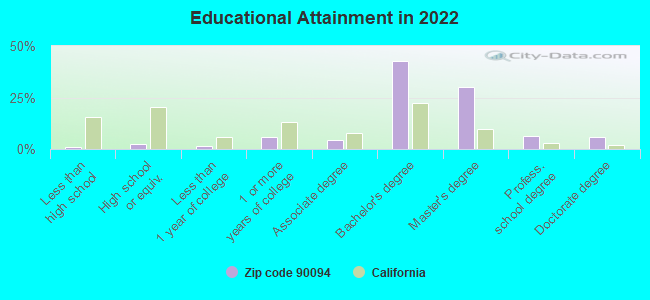
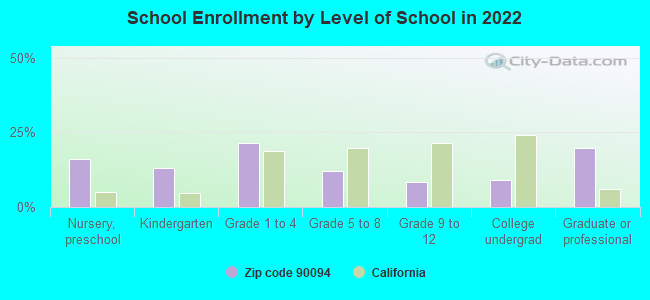
Private vs. public school enrollment:
Students in private schools in grades 1 to 8 (elementary and middle school): 203
Here:
29.3%
California:
10.5%
Students in private schools in grades 9 to 12 (high school): 32
Here:
18.6%
California:
8.5%
Students in private undergraduate colleges: 69
Here:
36.6%
California:
15.9%
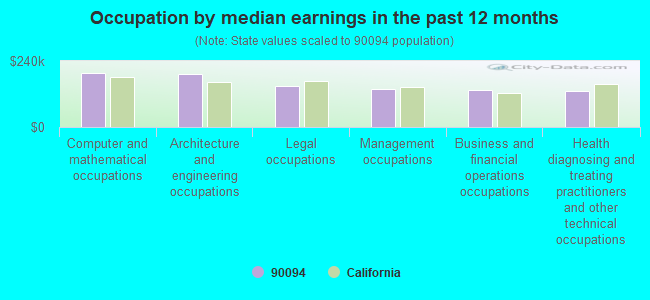
Occupation by median earnings in the past 12 months ($)
197,914Computer and mathematical occupations
192,611Architecture and engineering occupations
148,608Legal occupations
137,451Management occupations
133,886Business and financial operations occupations
130,665Health diagnosing and treating practitioners and other technical occupations
Top industries in this zip code by the number of employees in 2005:
Accommodation and Food Services: Full-Service Restaurants (5-9 employees: 2 establishments)
Accommodation and Food Services: Food Service Contractors (5-9: 1, 1-4: 1)
Real Estate and Rental and Leasing: Offices of Real Estate Agents and Brokers (1-4: 2)
Professional, Scientific, and Technical Services: Tax Preparation Services (1-4: 1)
Real Estate and Rental and Leasing: Residential Property Managers (1-4: 1)
Educational Services: Sports and Recreation Instruction (1-4: 1)
Real Estate and Rental and Leasing: Lessors of Nonresidential Buildings (except Miniwarehouses) (1-4: 1)
Finance and Insurance: Insurance Agencies and Brokerages (1-4: 1)
Real Estate and Rental and Leasing: Other Activities Related to Real Estate (1-4: 1)
Professional, Scientific, and Technical Services: Marketing Research and Public Opinion Polling (1-4: 1)
2005 - 2018 National Fire Incident Reporting System (NFIRS) incidents
Based on the data from the years 2005 - 2018 the average number of fire incidents per year is 13. The highest number of fire incidents - 31 took place in 2018, and the least - 3 in 2012. The data has a growing trend.
When looking into fire subcategories, the most reports belonged to: Structure Fires (42.1%), and Outside Fires (32.2%).
Fire incident types reported to NFIRS in Zip Code 90094


 Based on the data from the years 2005 - 2018 the average number of fire incidents per year is 13. The highest number of fire incidents - 31 took place in 2018, and the least - 3 in 2012. The data has a growing trend.
 When looking into fire subcategories, the most reports belonged to: Structure Fires (42.1%), and Outside Fires (32.2%).