Estimated zip code population in 2022: 47,259 Zip code population in 2010: 48,852 Zip code population in 2000: 49,418
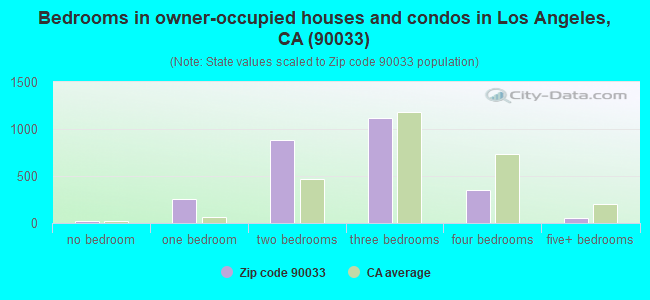
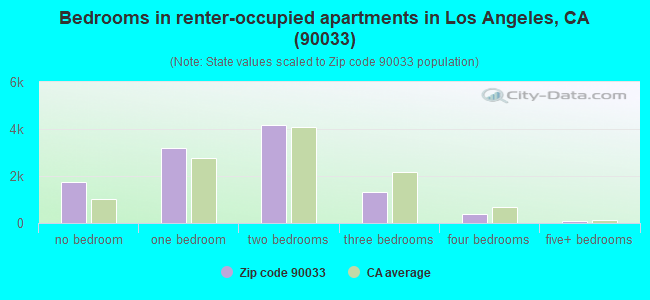
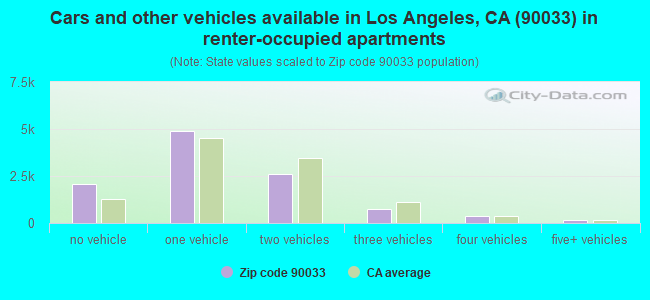
Houses and condos: 14,347 Renter-occupied apartments: 10,847
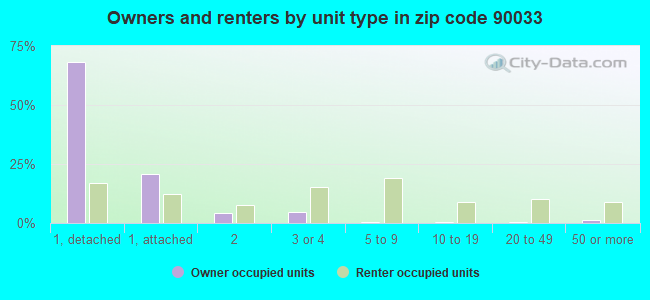
% of renters here:
80%
State:
44%
March 2022 cost of living index in zip code 90033: 140.9 (very high, U.S. average is 100)
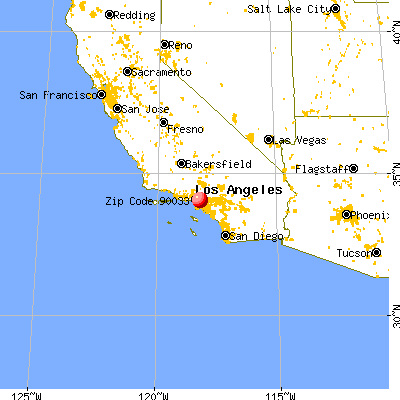
Land area: 3.3 sq. mi. Water area: 0.0 sq. mi.
Population density: 14,465 people per square mile
(very high).
OSM Map
General Map
Google Map
MSN Map
OSM Map
General Map
Google Map
MSN Map
OSM Map
General Map
Google Map
MSN Map
OSM Map
General Map
Google Map
MSN Map
Please wait while loading the map...
Real estate property taxes paid for housing units in 2022:
This zip code:
0.6% ($3,788)
California:
0.7% ($4,831)
Median real estate property taxes paid for housing units with mortgages in 2022: $4,535 (0.6%) Median real estate property taxes paid for housing units with no mortgage in 2022: $2,262 (0.4%)
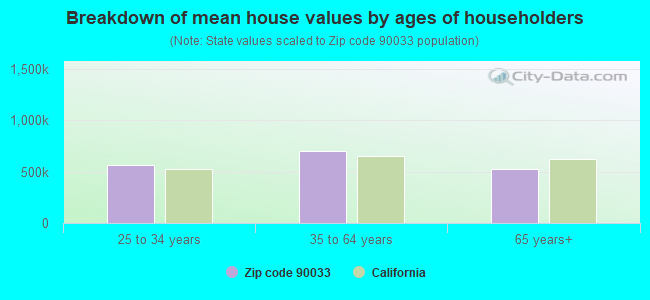
Estimated median house/condo value in 2022: $686,474
90033:
$686,474
California:
$715,900
According to our research of California and other state lists, there were 67 registered sex offenders living in 90033 zip code as of May 04, 2024. The ratio of all residents to sex offenders in zip code 90033 is 744 to 1. The ratio of registered sex offenders to all residents in this zip code is near the state average.
Median resident age:
This zip code:
32.3 years
California median age:
37.9 years
Average household size:
This zip code:
3.4 people
California:
2.8 people
Averages for the 2020 tax year for zip code 90033, filed in 2021:
Average Adjusted Gross Income (AGI) in 2020: $35,550 (Individual Income Tax Returns)
Here:
$35,550
State:
$95,910
Salary/wage: $34,582 (reported on 84.0% of returns)
Here:
$34,582
State:
$77,331
(% of AGI for various income ranges: 1290.9% for AGIs below $25k, 4101.5% for AGIs $25k-50k, 7757.9% for AGIs $50k-75k, 11629.8% for AGIs $75k-100k, 17922.1% for AGIs $100k-200k, 72406.7% for AGIs over 200k)
Taxable interest for individuals: $548 (reported on 11.5% of returns)
This zip code:
$548
California:
$2,294
(% of AGI for various income ranges: 3.0% for AGIs below $25k, 4.3% for AGIs $25k-50k, 14.9% for AGIs $50k-75k, 20.5% for AGIs $75k-100k, 64.6% for AGIs $100k-200k, 746.7% for AGIs over 200k)
Ordinary dividends: $2,895 (reported on 3.4% of returns)
Here:
$2,895
State:
$10,949
(% of AGI for various income ranges: 2.0% for AGIs below $25k, 3.1% for AGIs $25k-50k, 20.7% for AGIs $50k-75k, 38.9% for AGIs $75k-100k, 107.2% for AGIs $100k-200k, 2210.0% for AGIs over 200k)
Net capital gain/loss in AGI: +$9,976 (reported on 4.3% of returns)
Here:
+$9,976
State:
+$49,306
(% of AGI for various income ranges: 1.5% for AGIs below $25k, 2.8% for AGIs $25k-50k, 22.1% for AGIs $50k-75k, 84.2% for AGIs $75k-100k, 240.5% for AGIs $100k-200k, 21266.7% for AGIs over 200k)
Profit/loss from business: +$7,489 (reported on 18.6% of returns)
Here:
+$7,489
State:
+$15,671
(% of AGI for various income ranges: 274.3% for AGIs below $25k, 128.7% for AGIs $25k-50k, 99.0% for AGIs $50k-75k, 253.8% for AGIs $75k-100k, 192.8% for AGIs $100k-200k, 3546.7% for AGIs over 200k)
Taxable individual retirement arrangement distribution: $13,429 (reported on 1.2% of returns)
90033:
$13,429
California:
$23,505
(% of AGI for various income ranges: 6.6% for AGIs below $25k, 10.3% for AGIs $25k-50k, 37.4% for AGIs $50k-75k, 26.2% for AGIs $75k-100k, 394.9% for AGIs $100k-200k)
Total itemized deductions: $29,300 (reported on 3.4% of returns)
Here:
$29,300
State:
$39,517
(% of AGI for various income ranges: 15.8% for AGIs below $25k, 72.9% for AGIs $25k-50k, 233.6% for AGIs $50k-75k, 506.7% for AGIs $75k-100k, 1273.6% for AGIs $100k-200k, 10070.0% for AGIs over 200k)
Charity contributions: $6,804 (reported on 2.5% of returns)
Here:
$6,804
State:
$12,598
(% of AGI for various income ranges: 1.2% for AGIs below $25k, 11.8% for AGIs $25k-50k, 34.0% for AGIs $50k-75k, 56.0% for AGIs $75k-100k, 242.1% for AGIs $100k-200k, 3020.0% for AGIs over 200k)
Taxes paid: $7,623 (reported on 3.4% of returns)
90033:
$7,623
State:
$8,807
(% of AGI for various income ranges: 4.7% for AGIs below $25k, 16.8% for AGIs $25k-50k, 68.7% for AGIs $50k-75k, 158.7% for AGIs $75k-100k, 382.8% for AGIs $100k-200k, 1283.3% for AGIs over 200k)
Earned income credit: $2,278 (reported on 25.5% of returns)
Here:
$2,278
State:
$2,074
(% of AGI for various income ranges: 124.8% for AGIs below $25k, 81.4% for AGIs $25k-50k, 1.7% for AGIs $50k-75k)
Percentage of individuals using paid preparers for their 2020 taxes: 90.7%
Here:
91%
State:
92%
(% for various income ranges: 88.2% for AGIs below $25k, 92.4% for AGIs $25k-50k, 92.9% for AGIs $50k-75k, 92.9% for AGIs $75k-100k, 95.2% for AGIs $100k-200k, 88.9% for AGIs over 200k)
Averages for the 2012 tax year for zip code 90033, filed in 2013:
Average Adjusted Gross Income (AGI) in 2012: $26,564 (Individual Income Tax Returns)
Here:
$26,564
State:
$72,726
Salary/wage: $26,498 (reported on 85.0% of returns)
Here:
$26,498
State:
$59,079
(% of AGI for various income ranges: 78.5% for AGIs below $25k, 92.3% for AGIs $25k-50k, 90.6% for AGIs $50k-75k, 87.3% for AGIs $75k-100k, 89.0% for AGIs $100k-200k)
Taxable interest for individuals: $554 (reported on 10.8% of returns)
This zip code:
$554
California:
$2,146
(% of AGI for various income ranges: 0.2% for AGIs below $25k, 0.1% for AGIs $25k-50k, 0.3% for AGIs $50k-75k, 0.4% for AGIs $75k-100k, 0.8% for AGIs $100k-200k)
Ordinary dividends: $4,368 (reported on 2.0% of returns)
Here:
$4,368
State:
$9,308
(% of AGI for various income ranges: 0.1% for AGIs below $25k, 0.1% for AGIs $25k-50k, 0.4% for AGIs $50k-75k, 0.7% for AGIs $75k-100k, 2.5% for AGIs $100k-200k)
Net capital gain/loss in AGI: +$2,530 (reported on 1.8% of returns)
Here:
+$2,530
State:
+$30,460
(% of AGI for various income ranges: 3.5% for AGIs $100k-200k)
Profit/loss from business: +$9,487 (reported on 18.3% of returns)
Here:
+$9,487
State:
+$17,064
(% of AGI for various income ranges: 15.8% for AGIs below $25k, 2.8% for AGIs $25k-50k, 1.4% for AGIs $50k-75k, 1.8% for AGIs $75k-100k, 3.4% for AGIs $100k-200k)
Taxable individual retirement arrangement distribution: $10,774 (reported on 1.4% of returns)
90033:
$10,774
California:
$19,557
(% of AGI for various income ranges: 0.3% for AGIs below $25k, 0.3% for AGIs $25k-50k, 0.6% for AGIs $50k-75k, 1.2% for AGIs $75k-100k, 3.1% for AGIs $100k-200k)
Total itemized deductions: $20,656 (35% of AGI, reported on 11.9% of returns)
Here:
$20,656
State:
$34,004
Here:
35.2% of AGI
State:
22.7% of AGI
(% of AGI for various income ranges: 3.1% for AGIs below $25k, 8.2% for AGIs $25k-50k, 12.9% for AGIs $50k-75k, 17.3% for AGIs $75k-100k, 20.7% for AGIs $100k-200k, 25.8% for AGIs over 200k)
Charity contributions: $3,184 (reported on 8.4% of returns)
Here:
$3,184
State:
$4,659
(% of AGI for various income ranges: 0.1% for AGIs below $25k, 0.7% for AGIs $25k-50k, 1.1% for AGIs $50k-75k, 1.8% for AGIs $75k-100k, 7.2% for AGIs $100k-200k)
Taxes paid: $4,815 (reported on 11.8% of returns)
90033:
$4,815
State:
$14,448
(% of AGI for various income ranges: 0.5% for AGIs below $25k, 1.6% for AGIs $25k-50k, 2.9% for AGIs $50k-75k, 4.7% for AGIs $75k-100k, 5.7% for AGIs $100k-200k, 8.7% for AGIs over 200k)
Earned income credit: $2,707 (reported on 36.2% of returns)
Here:
$2,707
State:
$2,286
(% of AGI for various income ranges: 9.7% for AGIs below $25k, 1.8% for AGIs $25k-50k)
Percentage of individuals using paid preparers for their 2012 taxes: 78.9%
Here:
79%
State:
64%
(% for various income ranges: 79.8% for AGIs below $25k, 79.7% for AGIs $25k-50k, 74.0% for AGIs $50k-75k, 66.0% for AGIs $75k-100k, 84.2% for AGIs $100k-200k)
Averages for the 2004 tax year for zip code 90033, filed in 2005:
Average Adjusted Gross Income (AGI) in 2004: $22,638 (Individual Income Tax Returns)
Here:
$22,638
State:
$58,600
Salary/wage: $22,783 (reported on 87.7% of returns)
Here:
$22,783
State:
$49,455
(% of AGI for various income ranges: 75.7% for AGIs below $10k, 88.3% for AGIs $10k-25k, 94.4% for AGIs $25k-50k, 92.2% for AGIs $50k-75k, 80.6% for AGIs $75k-100k, 52.3% for AGIs over 100k)
Taxable interest for individuals: $805 (reported on 15.5% of returns)
This zip code:
$805
California:
$2,365
(% of AGI for various income ranges: 1.0% for AGIs below $10k, 0.4% for AGIs $10k-25k, 0.3% for AGIs $25k-50k, 0.7% for AGIs $50k-75k, 1.5% for AGIs $75k-100k, 2.0% for AGIs over 100k)
Taxable dividends: $3,697 (reported on 2.7% of returns)
Here:
$3,697
State:
$4,746
(% of AGI for various income ranges: 0.4% for AGIs below $10k, 0.2% for AGIs $10k-25k, 0.1% for AGIs $25k-50k, 0.3% for AGIs $50k-75k, 0.6% for AGIs $75k-100k, 4.9% for AGIs over 100k)
Net capital gain/loss: +$6,365 (reported on 2.1% of returns)
Here:
+$6,365
State:
+$23,418
(% of AGI for various income ranges: -0.2% for AGIs below $10k, -0.0% for AGIs $10k-25k, 0.2% for AGIs $25k-50k, 0.2% for AGIs $50k-75k, 4.1% for AGIs $75k-100k, 6.7% for AGIs over 100k)
Profit/loss from business: +$8,174 (reported on 14.5% of returns)
Here:
+$8,174
State:
+$16,826
(% of AGI for various income ranges: 22.8% for AGIs below $10k, 7.7% for AGIs $10k-25k, 2.4% for AGIs $25k-50k, 1.4% for AGIs $50k-75k, 0.4% for AGIs $75k-100k, 6.3% for AGIs over 100k)
IRA payment deduction: $1,929 (reported on 0.6% of returns)
90033:
$1,929
California:
$3,192
Total itemized deductions: $16,405 (35% of AGI, reported on 12.4% of returns)
Here:
$16,405
State:
$28,113
Here:
35.3% of AGI
State:
25.3% of AGI
(% of AGI for various income ranges: 4.3% for AGIs below $10k, 4.5% for AGIs $10k-25k, 9.5% for AGIs $25k-50k, 15.4% for AGIs $50k-75k, 17.9% for AGIs $75k-100k, 16.6% for AGIs over 100k)
Charity contributions deductions: $2,482 (5% of AGI, reported on 10.2% of returns)
Here:
$2,482
State:
$3,923
Here:
5.0% of AGI
State:
3.3% of AGI
(% of AGI for various income ranges: 0.1% for AGIs below $10k, 0.3% for AGIs $10k-25k, 1.1% for AGIs $25k-50k, 2.0% for AGIs $50k-75k, 3.1% for AGIs $75k-100k, 3.3% for AGIs over 100k)
Total tax: $2,233 (reported on 51.3% of returns)
90033:
$2,233
State:
$10,761
(% of AGI for various income ranges: 4.0% for AGIs below $10k, 2.7% for AGIs $10k-25k, 4.0% for AGIs $25k-50k, 7.0% for AGIs $50k-75k, 9.7% for AGIs $75k-100k, 20.6% for AGIs over 100k)
Earned income credit: $2,119 (reported on 39.8% of returns)
Here:
$2,119
State:
$1,763
Percentage of individuals using paid preparers for their 2004 taxes: 81.5%
Here:
82%
State:
66%
(% for various income ranges: 76.8% for AGIs below $10k, 83.9% for AGIs $10k-25k, 81.4% for AGIs $25k-50k, 82.1% for AGIs $50k-75k, 83.0% for AGIs $75k-100k, 85.7% for AGIs over 100k)
Likely homosexual households (counted as self-reported same-sex unmarried-partner households)
Lesbian couples: 0.1% of all households
Gay men: 0.3% of all households
Household received Food Stamps/SNAP in the past 12 months: 4,259 Household did not receive Food Stamps/SNAP in the past 12 months: 9,855
Women who had a birth in the past 12 months: 495 (191 now married, 307 unmarried) Women who did not have a birth in the past 12 months: 11,438 (3,130 now married, 8,366 unmarried)
Housing units in zip code 90033 with a mortgage: 1,763 (128 second mortgage, 76 both second mortgage and home equity loan) Houses without a mortgage: 18
Median monthly owner costs for units with a mortgage: $2,520 Median monthly owner costs for units without a mortgage: $573
Residents with income below the poverty level in 2022:
This zip code:
27.0%
Whole state:
12.2%
Residents with income below 50% of the poverty level in 2022:
This zip code:
17.3%
Whole state:
6.2%
Median number of rooms in houses and condos:
Here:
5.1
State:
6.0
Median number of rooms in apartments:
Here:
3.6
State:
3.9
Notable locations in this zip code not listed on our city pages
Notable locations in zip code 90033: Malabar Branch Los Angeles Public Library (A), Benjamin Franklin Branch Los Angeles Public Library (B), Soto Street Branch All Nations Neighborhood Center (C), Paulson Hall (D), Martha Borg Hall (E), Ida Thomason Hall (F), Hollenbeck Community Police Station (G), City of Los Angeles Fire Department Station 2 (H). Display/hide their locations on the map
Churches in zip code 90033 include: Saint Marys Catholic Church (A), Free Methodist Church (B), Boyle Heights Church of the Nazarene (C), Caballeros de Dimasalang Temple (D), Calvary Baptist Church (E), Community House of God (F), Congregation Talmud Torah (G), Dolores Roman Catholic Church (H), El Salvador Baptist Church (I). Display/hide their locations on the map
Parks in zip code 90033 include: Evergreen Playground (1), State Street Playground (2), Wabash Playground (3), Evergreen Recreation Center (4), Hazard Park (5), Hollenbeck Park (6), Pecan Recreation Center (7), Prospect Park (8), State Street Recreation Center (9). Display/hide their locations on the map
3,798 married couples with children.
4,998 single-parent households (1,717 men, 3,281 women).
14.9% of residents of 90033 zip code speak English at home.
81.0% of residents speak Spanish at home (54% very well, 14% well, 20% not well, 12% not at all).
0.3% of residents speak other Indo-European language at home (73% very well, 10% well, 17% not well).
3.7% of residents speak Asian or Pacific Island language at home (43% very well, 17% well, 33% not well, 6% not at all).
0.1% of residents speak other language at home (79% very well, 21% well).
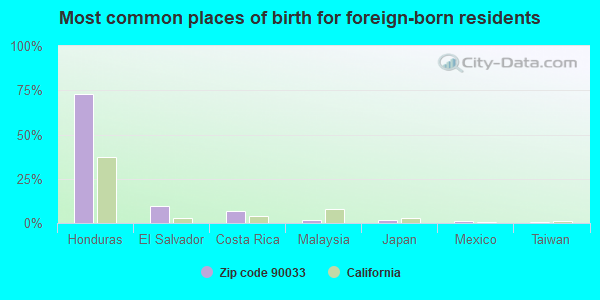
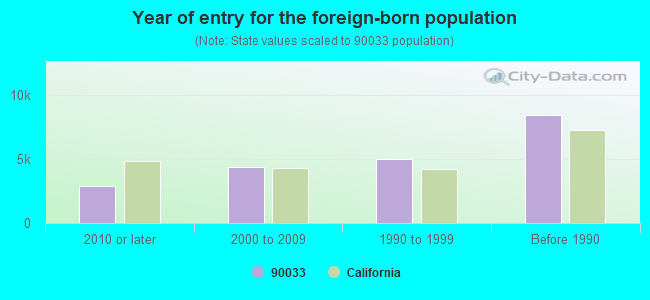
Foreign born population: 20,660 (43.7%) (35.0% of them are naturalized citizens)
Major facilities with environmental interests located in this zip code:
LOS ANGELES COUNTY USC MEDICAL CENTER (1200 NORTH STATE STREET in LOS ANGELES, CA)
AIR MAJOR (AIRS/AFS) STATE MASTER (California - Hazardous Waste Tracking) - HAZARDOU WASTE PROGRAM CRITERIA AND HAZARDOUS AIR POLLUTANT INVENTORY (Inventory of air pollution sources) HAZARDOUS WASTE BIENNIAL REPORTER (Resource Conservation and Recovery Act (tracking hazardous waste)) Large Quantity Generators, more that 1000 kg of hazardous waste/month (Resource Conservation and Recovery Act (tracking hazardous waste)) Small Quantity Generators, between 100 kg and 1000 kg of hazardous waste/month (Resource Conservation and Recovery Act (tracking hazardous waste)) Business SIC classification: GENERAL MEDICAL AND SURGICAL HOSPITALS Alternative names: LA HEALTH SVC LAC USC MED CTR, LA USC MEDICAL CENTER, LOS ANGELES COUNTY USC MED CENTER
GANS INK & SUPPLY COMPANY (1441 BOYD STREET in LOS ANGELES, CA)
STATE MASTER (California - Hazardous Waste Tracking) - HAZARDOU WASTE PROGRAM COMPLIANCE ACTIVITY (Tracking inspections of insecticide, fungicide, and rodenticide, and toxic substances) Large Quantity Generators, more that 1000 kg of hazardous waste/month (Resource Conservation and Recovery Act (tracking hazardous waste)) Business SIC classification: PRINTING INK Organizations: ROBERT J. GANS (CONTACT/OPERATOR)
ALISO VILLAGE LA HSNG AUTHORITY (1401 E FIRST ST in LOS ANGELES, CA)
STATE MASTER (California - Hazardous Waste Tracking) - HAZARDOU WASTE PROGRAM Large Quantity Generators, more that 1000 kg of hazardous waste/month (Resource Conservation and Recovery Act (tracking hazardous waste)) Organizations: EAST LOS ANGELES HIGH SCHOOL NO 1 (CONTACT/OPERATOR)
, LOS ANGELES UNIFIED SCHOOL DISTRICT (CONTACT/OWNER)
Alternative names: CITY OF LA/HOUSING AUTHORITY
EQUILON ENTERPRISES LLC (2005 4TH/CUMMINGS in LOS ANGELES, CA) . Federal Facility
STATE MASTER (California - Hazardous Waste Tracking) - HAZARDOU WASTE PROGRAM Large Quantity Generators, more that 1000 kg of hazardous waste/month (Resource Conservation and Recovery Act (tracking hazardous waste)) Organizations: SHELL OIL PRODUCTS US (CONTACT/OPERATOR)
, EQUILON ENTERPRISES LLC DBA SHELL OIL PR (CONTACT/OWNER)
Alternative names: FORMER SHELL SERVICE STATION, SHELL OIL CO
ANGELL AND GIROUX INCORPORATED (2727 ALCAZAR STREET in LOS ANGELES, CA)
STATE MASTER (California - Hazardous Waste Tracking) - HAZARDOU WASTE PROGRAM CRITERIA AND HAZARDOUS AIR POLLUTANT INVENTORY (Inventory of air pollution sources) Small Quantity Generators, between 100 kg and 1000 kg of hazardous waste/month (Resource Conservation and Recovery Act (tracking hazardous waste)) TRI REPORTER (Tracking of toxic chemicals releasing facilities) Business SIC classification: OFFICE FURNITURE, EXCEPT WOOD; METAL STAMPINGS Business NAICS classification: INSTITUTIONAL FURNITURE MANUFACTURING.; OFFICE FURNITURE (EXCEPT WOOD) MANUFACTURING.
ALISO PICO MULTIPURPOSE CENTER (1505 EAST 1ST STREET in LOS ANGELES, CA)
STATE MASTER (California - Hazardous Waste Tracking) - HAZARDOU WASTE PROGRAM HAZARDOUS WASTE BIENNIAL REPORTER (Resource Conservation and Recovery Act (tracking hazardous waste)) Large Quantity Generators, more that 1000 kg of hazardous waste/month (Resource Conservation and Recovery Act (tracking hazardous waste)) Business NAICS classification: OTHER NONSCHEDULED AIR TRANSPORTATION. Alternative names: CITY OF LA GENERAL SERVICES, LA ALISO PICO MULTI PURPOSE CTR
LA USD SHERIDAN ELEM (416 N CORNWELL ST in LOS ANGELES, CA)
STATE MASTER (California - Hazardous Waste Tracking) - HAZARDOU WASTE PROGRAM Small Quantity Generators, between 100 kg and 1000 kg of hazardous waste/month (Resource Conservation and Recovery Act (tracking hazardous waste)) - notification Alternative names: LAUSD/ SHERIDAN ST ELEM, SHERIDAN STREET ELEMENTARY
LA USD 1ST ST EL (2820 E 1ST in LOS ANGELES, CA)
STATE MASTER (California - Hazardous Waste Tracking) - HAZARDOU WASTE PROGRAM Small Quantity Generators, between 100 kg and 1000 kg of hazardous waste/month (Resource Conservation and Recovery Act (tracking hazardous waste)) - notification Alternative names: FIRST STREET ELEMENTARY, LAUSD/FIRST ST ELEM
LA USD BRIDGE ELEM (605 N BOYLE AVE in LOS ANGELES, CA)
STATE MASTER (California - Hazardous Waste Tracking) - HAZARDOU WASTE PROGRAM Small Quantity Generators, between 100 kg and 1000 kg of hazardous waste/month (Resource Conservation and Recovery Act (tracking hazardous waste)) - notification Alternative names: BRIDGE STREET ELEMENTARY, LAUSD/ BRIDGE ST ELEM
LA USD ROOSEVELT HS (456 S MATHEWS ST in LOS ANGELES, CA)
STATE MASTER (California - Hazardous Waste Tracking) - HAZARDOU WASTE PROGRAM Small Quantity Generators, between 100 kg and 1000 kg of hazardous waste/month (Resource Conservation and Recovery Act (tracking hazardous waste)) - notification Alternative names: ROOSEVELT (THEODORE) SENIOR HIGH
LA USD 2ND ST ELEM (1942 E 2ND ST in LOS ANGELES, CA)
STATE MASTER (California - Hazardous Waste Tracking) - HAZARDOU WASTE PROGRAM Small Quantity Generators, between 100 kg and 1000 kg of hazardous waste/month (Resource Conservation and Recovery Act (tracking hazardous waste)) - notification Alternative names: LAUSD/SECOND STREET ELEM, SECOND STREET ELEMENTARY
LOS ANGELES USD BREED ELEM SCHOOL (2226 E THIRD ST in LOS ANGELES, CA)
STATE MASTER (California - Hazardous Waste Tracking) - HAZARDOU WASTE PROGRAM Small Quantity Generators, between 100 kg and 1000 kg of hazardous waste/month (Resource Conservation and Recovery Act (tracking hazardous waste)) - notification Organizations: LOS ANGELES UNIFIED SCHOOL DISTRICT (CONTACT/OWNER)
Alternative names: BREED STREET ELEMENTARY, LAUSD/ BREED ST ELEM
LOS ANGELES USD NEWMAN NUTRITION CENTER (2310 CHARLOTTE ST in LOS ANGELES, CA)
STATE MASTER (California - Hazardous Waste Tracking) - HAZARDOU WASTE PROGRAM Small Quantity Generators, between 100 kg and 1000 kg of hazardous waste/month (Resource Conservation and Recovery Act (tracking hazardous waste)) - notification Organizations: LOS ANGELES UNIFIED SCHOOL DISTRICT (CONTACT/OWNER)
Alternative names: LAUSD/ NEWMAN NUTRITION CTR
Housing units lacking complete plumbing facilities: 1.7% Housing units lacking complete kitchen facilities: 5.4%
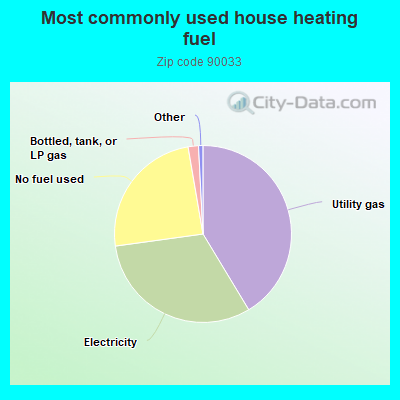
41.4%Utility gas
31.5%Electricity
24.5%No fuel used
1.9%Bottled, tank, or LP gas
Population in 1990: 57,469.
Place of birth for U.S.-born residents:
This state: 24,968
Northeast: 396
Midwest: 297
South: 376
West: 380
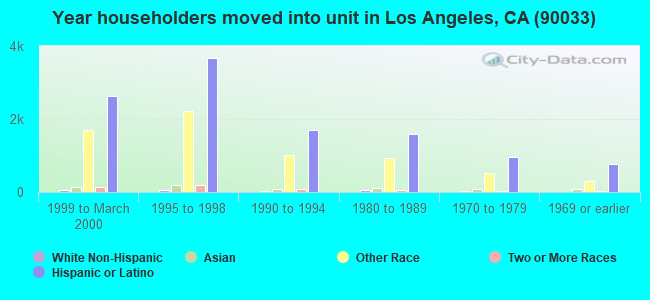
55% of the 90033 zip code residents lived in the same house 5 years ago. Out of people who lived in different houses, 92% lived in this county. Out of people who lived in different counties, 50% lived in California.
92% of the 90033 zip code residents lived in the same house 1 year ago. Out of people who lived in different houses, 72% moved from this county. Out of people who lived in different houses, 8% moved from different county within same state. Out of people who lived in different houses, 7% moved from different state. Out of people who lived in different houses, 14% moved from abroad.
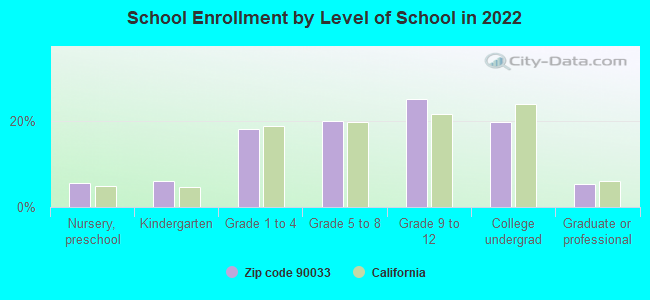
Private vs. public school enrollment:
Students in private schools in grades 1 to 8 (elementary and middle school): 337
Here:
6.6%
California:
10.5%
Students in private schools in grades 9 to 12 (high school): 135
Here:
4.0%
California:
8.5%
Students in private undergraduate colleges: 374
Here:
14.0%
California:
15.9%
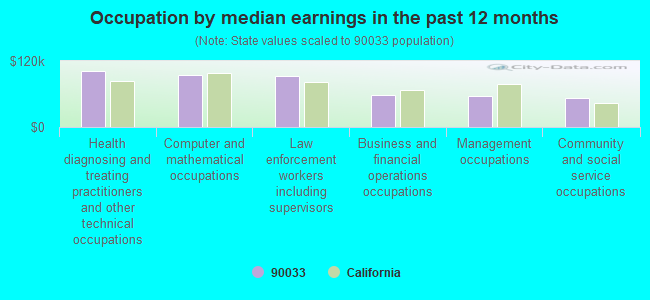
Occupation by median earnings in the past 12 months ($)
101,179Health diagnosing and treating practitioners and other technical occupations
94,156Computer and mathematical occupations
92,081Law enforcement workers including supervisors
58,575Business and financial operations occupations
56,025Management occupations
52,558Community and social service occupations
Companies with federal contracts located in this zip code:
COMMERCIAL REFRIGERATION COMPA (1700 N SOTO in LOS ANGELES, CA; small business) : $362,497 in 3 contractsfrom 2000 to 2001
$345,886 with Navy for Maintenance, Repair or Alteration of Real Property -- Recreational Buildings. Signed on 2000-09-26. Completion date: 2001-03-25.
$9,637, same as above.Signed on 2001-04-17. Completion date: 2001-04-22.
$6,974, same as above.Signed on 2001-03-07. Completion date: 2001-04-08.
DOHENY EYE INSTITUTE (1450 SAN PABLO STREET in LOS ANGELES, CA)
$204,718 with Navy for Other Research and Development -- Advanced Development (R&D). Signed on 2002-01-23. Completion date: 2003-01-22.
Dr. ramadas abboy ( in los angeles, ca; small business)
$350 with Bureau of Prisoners/Federal Prison System for General Health Care Services. Signed on 2006-03-24. Completion date: 2006-03-24.
Top industries in this zip code by the number of employees in 2005:
Health Care and Social Assistance: General Medical and Surgical Hospitals (over 1000 employees: 3 establishments, 100-249 employees: 1 establishment)
Wholesale Trade: Beer and Ale Merchant Wholesalers (250-499: 2)
Health Care and Social Assistance: Offices of Physicians (except Mental Health Specialists) (50-99: 2, 20-49: 4, 10-19: 10, 5-9: 13, 1-4: 45)
Health Care and Social Assistance: Specialty (except Psychiatric and Substance Abuse) Hospitals (250-499: 1)
2005 - 2018 National Fire Incident Reporting System (NFIRS) incidents
According to the data from the years 2005 - 2018 the average number of fires per year is 188. The highest number of fire incidents - 259 took place in 2007, and the least - 125 in 2012. The data has a decreasing trend.
When looking into fire subcategories, the most incidents belonged to: Structure Fires (36.9%), and Outside Fires (36.9%).
Fire incident types reported to NFIRS in Zip Code 90033


 Nearest zip codes: 90063, 90013, 90023, 90012, 90021, 90031.


 According to the data from the years 2005 - 2018 the average number of fires per year is 188. The highest number of fire incidents - 259 took place in 2007, and the least - 125 in 2012. The data has a decreasing trend.
 When looking into fire subcategories, the most incidents belonged to: Structure Fires (36.9%), and Outside Fires (36.9%).