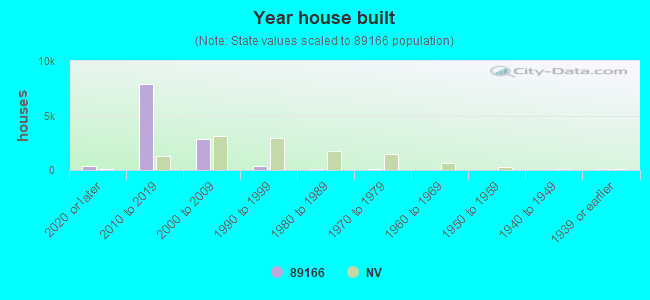
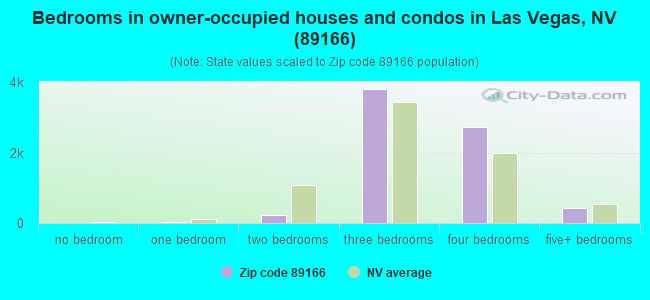
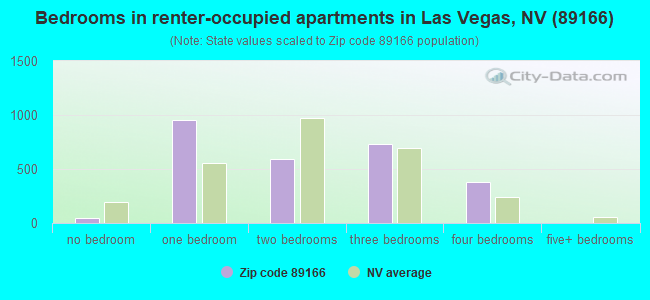
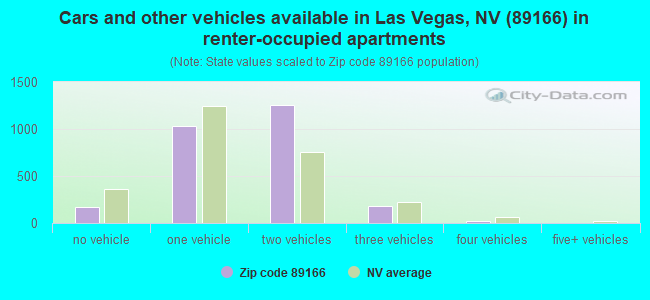
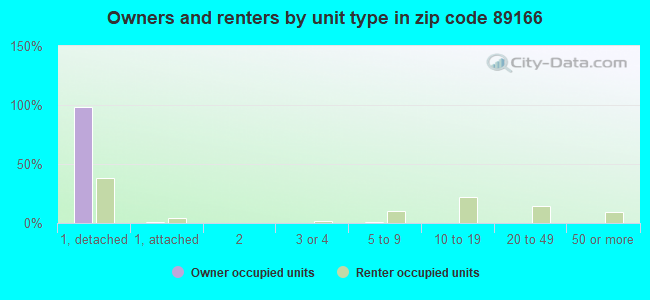
Houses and condos: 10,114 Renter-occupied apartments: 2,698
% of renters here:
27%
State:
40%
March 2022 cost of living index in zip code 89166: 93.9 (less than average, U.S. average is 100)
Land area: 193.2 sq. mi. Water area: 0.0 sq. mi.
Population density: 152 people per square mile
(very low).
OSM Map
Google Map
MSN Map
OSM Map
General Map
Google Map
MSN Map
OSM Map
Google Map
MSN Map
OSM Map
Google Map
MSN Map
Please wait while loading the map...
Real estate property taxes paid for housing units in 2022:
This zip code:
0.6% ($2,837)
Nevada:
0.4% ($1,889)
Median real estate property taxes paid for housing units with mortgages in 2022: $2,760 (0.6%) Median real estate property taxes paid for housing units with no mortgage in 2022: $3,252 (0.6%)
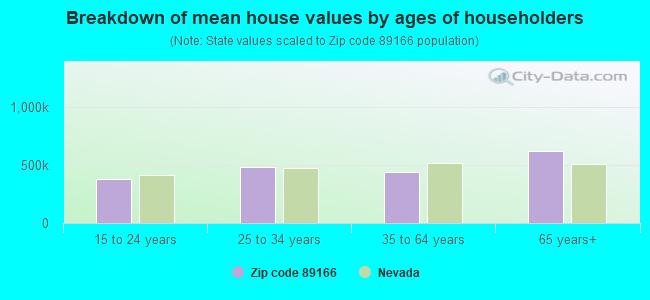
Estimated median house/condo value in 2022: $495,404
89166:
$495,404
Nevada:
$434,700
According to our research of Nevada and other state lists, there were 27 registered sex offenders living in 89166 zip code as of May 02, 2024. The ratio of all residents to sex offenders in zip code 89166 is 668 to 1. The ratio of registered sex offenders to all residents in this zip code is lower than the state average.
Median resident age:
This zip code:
32.4 years
Nevada median age:
39.0 years
Average household size:
This zip code:
3.0 people
Nevada:
2.6 people
Averages for the 2020 tax year for zip code 89166, filed in 2021:
Average Adjusted Gross Income (AGI) in 2020: $79,054 (Individual Income Tax Returns)
Here:
$79,054
State:
$78,964
Salary/wage: $70,392 (reported on 89.9% of returns)
Here:
$70,392
State:
$54,472
(% of AGI for various income ranges: 1181.7% for AGIs below $25k, 3532.7% for AGIs $25k-50k, 6693.1% for AGIs $50k-75k, 9843.3% for AGIs $75k-100k, 17791.9% for AGIs $100k-200k, 55360.0% for AGIs over 200k)
Taxable interest for individuals: $673 (reported on 23.9% of returns)
This zip code:
$673
Nevada:
$3,521
(% of AGI for various income ranges: 5.3% for AGIs below $25k, 9.4% for AGIs $25k-50k, 15.2% for AGIs $50k-75k, 20.3% for AGIs $75k-100k, 37.7% for AGIs $100k-200k, 211.7% for AGIs over 200k)
Ordinary dividends: $2,715 (reported on 14.4% of returns)
Here:
$2,715
State:
$13,390
(% of AGI for various income ranges: 15.0% for AGIs below $25k, 15.8% for AGIs $25k-50k, 27.5% for AGIs $50k-75k, 35.3% for AGIs $75k-100k, 70.8% for AGIs $100k-200k, 874.2% for AGIs over 200k)
Net capital gain/loss in AGI: +$11,260 (reported on 16.0% of returns)
Here:
+$11,260
State:
+$63,025
(% of AGI for various income ranges: 2.3% for AGIs below $25k, 17.5% for AGIs $25k-50k, 52.3% for AGIs $50k-75k, 66.0% for AGIs $75k-100k, 243.2% for AGIs $100k-200k, 6805.4% for AGIs over 200k)
Profit/loss from business: +$7,548 (reported on 15.8% of returns)
Here:
+$7,548
State:
+$11,500
(% of AGI for various income ranges: 66.8% for AGIs below $25k, 50.3% for AGIs $25k-50k, 113.8% for AGIs $50k-75k, 161.8% for AGIs $75k-100k, 278.4% for AGIs $100k-200k, 1480.8% for AGIs over 200k)
Taxable individual retirement arrangement distribution: $22,551 (reported on 4.3% of returns)
89166:
$22,551
Nevada:
$23,628
(% of AGI for various income ranges: 25.4% for AGIs below $25k, 33.9% for AGIs $25k-50k, 94.6% for AGIs $50k-75k, 97.9% for AGIs $75k-100k, 254.1% for AGIs $100k-200k, 1447.9% for AGIs over 200k)
Self-employed (Keogh) retirement plans: $18,100 (reported on 0.2% of returns)
89166:
$18,100
Nevada:
$26,634
(% of AGI for various income ranges: 28.7% for AGIs $100k-200k)
Total itemized deductions: $28,937 (reported on 13.4% of returns)
Here:
$28,937
State:
$44,173
(% of AGI for various income ranges: 41.7% for AGIs below $25k, 173.4% for AGIs $25k-50k, 446.3% for AGIs $50k-75k, 611.6% for AGIs $75k-100k, 1010.1% for AGIs $100k-200k, 4448.8% for AGIs over 200k)
Charity contributions: $6,240 (reported on 10.7% of returns)
Here:
$6,240
State:
$12,589
(% of AGI for various income ranges: 3.3% for AGIs below $25k, 20.1% for AGIs $25k-50k, 53.1% for AGIs $50k-75k, 88.4% for AGIs $75k-100k, 194.8% for AGIs $100k-200k, 973.8% for AGIs over 200k)
Taxes paid: $6,259 (reported on 13.3% of returns)
89166:
$6,259
State:
$6,112
(% of AGI for various income ranges: 7.9% for AGIs below $25k, 34.8% for AGIs $25k-50k, 92.6% for AGIs $50k-75k, 130.1% for AGIs $75k-100k, 242.4% for AGIs $100k-200k, 797.1% for AGIs over 200k)
Earned income credit: $1,960 (reported on 11.2% of returns)
Here:
$1,960
State:
$2,214
(% of AGI for various income ranges: 71.4% for AGIs below $25k, 55.2% for AGIs $25k-50k, 0.9% for AGIs $50k-75k)
Percentage of individuals using paid preparers for their 2020 taxes: 95.4%
Here:
95%
State:
93%
(% for various income ranges: 94.3% for AGIs below $25k, 95.7% for AGIs $25k-50k, 94.9% for AGIs $50k-75k, 95.8% for AGIs $75k-100k, 96.3% for AGIs $100k-200k, 95.1% for AGIs over 200k)
Averages for the 2012 tax year for zip code 89166, filed in 2013:
Average Adjusted Gross Income (AGI) in 2012: $56,453 (Individual Income Tax Returns)
Here:
$56,453
State:
$61,164
Salary/wage: $54,233 (reported on 92.1% of returns)
Here:
$54,233
State:
$45,924
(% of AGI for various income ranges: 84.0% for AGIs below $25k, 92.2% for AGIs $25k-50k, 90.8% for AGIs $50k-75k, 91.4% for AGIs $75k-100k, 88.2% for AGIs $100k-200k, 65.8% for AGIs over 200k)
Taxable interest for individuals: $633 (reported on 20.5% of returns)
This zip code:
$633
Nevada:
$3,137
(% of AGI for various income ranges: 0.4% for AGIs below $25k, 0.3% for AGIs $25k-50k, 0.3% for AGIs $50k-75k, 0.2% for AGIs $100k-200k, 0.2% for AGIs over 200k)
Ordinary dividends: $3,312 (reported on 10.1% of returns)
Here:
$3,312
State:
$11,762
(% of AGI for various income ranges: 2.3% for AGIs below $25k, 0.7% for AGIs $25k-50k, 0.5% for AGIs $50k-75k, 0.2% for AGIs $75k-100k, 0.3% for AGIs $100k-200k, 1.3% for AGIs over 200k)
Net capital gain/loss in AGI: +$1,396 (reported on 8.4% of returns)
Here:
+$1,396
State:
+$33,127
(% of AGI for various income ranges: 0.2% for AGIs below $25k, 2.2% for AGIs over 200k)
Profit/loss from business: +$6,869 (reported on 11.7% of returns)
Here:
+$6,869
State:
+$12,567
(% of AGI for various income ranges: 5.2% for AGIs below $25k, 1.1% for AGIs $25k-50k, 1.4% for AGIs $50k-75k, 0.9% for AGIs $75k-100k, 1.5% for AGIs $100k-200k)
Taxable individual retirement arrangement distribution: $14,333 (reported on 4.3% of returns)
89166:
$14,333
Nevada:
$20,808
(% of AGI for various income ranges: 1.0% for AGIs below $25k, 0.7% for AGIs $25k-50k, 0.8% for AGIs $50k-75k, 1.1% for AGIs $75k-100k, 1.9% for AGIs $100k-200k)
Total itemized deductions: $19,462 (23% of AGI, reported on 35.5% of returns)
Here:
$19,462
State:
$26,148
Here:
23.2% of AGI
State:
20.0% of AGI
(% of AGI for various income ranges: 7.0% for AGIs below $25k, 10.0% for AGIs $25k-50k, 12.7% for AGIs $50k-75k, 13.7% for AGIs $75k-100k, 14.0% for AGIs $100k-200k, 10.2% for AGIs over 200k)
Charity contributions: $2,793 (reported on 28.1% of returns)
Here:
$2,793
State:
$4,329
(% of AGI for various income ranges: 0.5% for AGIs below $25k, 1.0% for AGIs $25k-50k, 1.4% for AGIs $50k-75k, 1.5% for AGIs $75k-100k, 1.7% for AGIs $100k-200k, 1.5% for AGIs over 200k)
Taxes paid: $4,220 (reported on 34.9% of returns)
89166:
$4,220
State:
$5,116
(% of AGI for various income ranges: 1.3% for AGIs below $25k, 2.0% for AGIs $25k-50k, 2.6% for AGIs $50k-75k, 2.8% for AGIs $75k-100k, 3.1% for AGIs $100k-200k, 3.0% for AGIs over 200k)
Earned income credit: $1,972 (reported on 13.6% of returns)
Here:
$1,972
State:
$2,279
(% of AGI for various income ranges: 4.9% for AGIs below $25k, 0.9% for AGIs $25k-50k)
Percentage of individuals using paid preparers for their 2012 taxes: 44.3%
Here:
44%
State:
55%
(% for various income ranges: 38.4% for AGIs below $25k, 40.8% for AGIs $25k-50k, 45.6% for AGIs $50k-75k, 48.8% for AGIs $75k-100k, 56.6% for AGIs $100k-200k, 62.5% for AGIs over 200k)
Averages for the 2004 tax year for zip code 89166, filed in 2005:
Average Adjusted Gross Income (AGI) in 2004: $39,624 (Individual Income Tax Returns)
Here:
$39,624
State:
$58,367
Salary/wage: $38,125 (reported on 95.9% of returns)
Here:
$38,125
State:
$42,695
(% of AGI for various income ranges: 110.2% for AGIs below $10k, 91.7% for AGIs $10k-25k, 96.0% for AGIs $25k-50k, 91.1% for AGIs $50k-75k, 89.4% for AGIs $75k-100k, 88.9% for AGIs over 100k)
Taxable interest for individuals: $239 (reported on 23.4% of returns)
This zip code:
$239
Nevada:
$3,867
(% of AGI for various income ranges: 0.7% for AGIs $10k-25k, 0.1% for AGIs $25k-50k, 0.1% for AGIs $50k-75k, 0.1% for AGIs $75k-100k)
Taxable dividends: $62 (reported on 6.9% of returns)
Here:
$62
State:
$5,770
Net capital gain/loss: +$156 (reported on 6.9% of returns)
Here:
+$156
State:
+$50,644
Profit/loss from business: +$6,541 (reported on 7.9% of returns)
Here:
+$6,541
State:
+$13,618
Total itemized deductions: $17,828 (30% of AGI, reported on 33.7% of returns)
Here:
$17,828
State:
$22,990
Here:
30.0% of AGI
State:
21.8% of AGI
(% of AGI for various income ranges: 12.8% for AGIs $10k-25k, 13.4% for AGIs $25k-50k, 16.9% for AGIs $50k-75k, 18.6% for AGIs $75k-100k, 13.1% for AGIs over 100k)
Charity contributions deductions: $2,178 (4% of AGI, reported on 29.0% of returns)
Here:
$2,178
State:
$3,443
Here:
3.6% of AGI
State:
3.1% of AGI
(% of AGI for various income ranges: 0.7% for AGIs $10k-25k, 1.3% for AGIs $25k-50k, 1.9% for AGIs $50k-75k, 2.0% for AGIs $75k-100k, 2.1% for AGIs over 100k)
Total tax: $4,164 (reported on 79.6% of returns)
89166:
$4,164
State:
$10,585
(% of AGI for various income ranges: 1.6% for AGIs below $10k, 4.4% for AGIs $10k-25k, 6.3% for AGIs $25k-50k, 8.9% for AGIs $50k-75k, 9.9% for AGIs $75k-100k, 16.1% for AGIs over 100k)
Earned income credit: $1,758 (reported on 14.2% of returns)
Here:
$1,758
State:
$1,676
Percentage of individuals using paid preparers for their 2004 taxes: 53.9%
Here:
54%
State:
60%
(% for various income ranges: 46.9% for AGIs below $10k, 58.9% for AGIs $10k-25k, 46.8% for AGIs $25k-50k, 50.6% for AGIs $50k-75k, 95.3% for AGIs $75k-100k)
Likely homosexual households (counted as self-reported same-sex unmarried-partner households)
Lesbian couples: 0.3% of all households
Gay men: 0.6% of all households
Household received Food Stamps/SNAP in the past 12 months: 850 Household did not receive Food Stamps/SNAP in the past 12 months: 8,860
Women who had a birth in the past 12 months: 571 (562 now married, 57 unmarried) Women who did not have a birth in the past 12 months: 8,331 (3,656 now married, 4,663 unmarried)
Housing units in zip code 89166 with a mortgage: 5,825 (374 second mortgage, 16 home equity loan, 252 both second mortgage and home equity loan) Median monthly owner costs for units with a mortgage: $2,032 Median monthly owner costs for units without a mortgage: $560
Residents with income below the poverty level in 2022:
This zip code:
6.9%
Whole state:
12.5%
Residents with income below 50% of the poverty level in 2022:
This zip code:
1.4%
Whole state:
5.9%
Median number of rooms in houses and condos:
Here:
6.3
State:
6.0
Median number of rooms in apartments:
Here:
4.4
State:
4.2
Notable locations in this zip code not listed on our city pages
Notable locations in zip code 89166: Mahogany Grove Picnic Area (A), Hilltop Campground (B), Desert Viewpoint (C), Spring Mountain Youth Camp (D), Desert View Trailhead (E). Display/hide their locations on the map
5,278 married couples with children.
1,782 single-parent households (416 men, 1,366 women).
87.0% of residents of 89166 zip code speak English at home.
6.8% of residents speak Spanish at home (66% very well, 25% well, 5% not well, 3% not at all).
0.4% of residents speak other Indo-European language at home (100% very well).
5.2% of residents speak Asian or Pacific Island language at home (76% very well, 20% well, 4% not well).
0.2% of residents speak other language at home (100% very well).
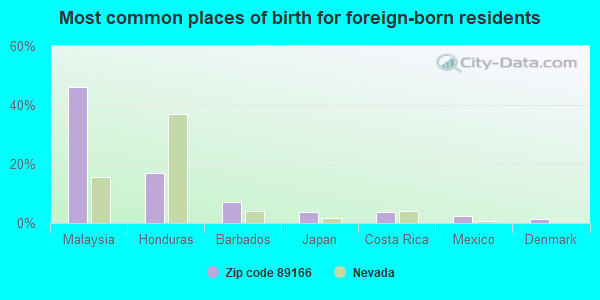
Foreign born population: 2,800 (9.6%) (73.2% of them are naturalized citizens)
This zip code:
9.6%
Whole state:
18.9%
46%Malaysia
17%Honduras
7%Barbados
4%Japan
4%Costa Rica
2%Mexico
1%Denmark
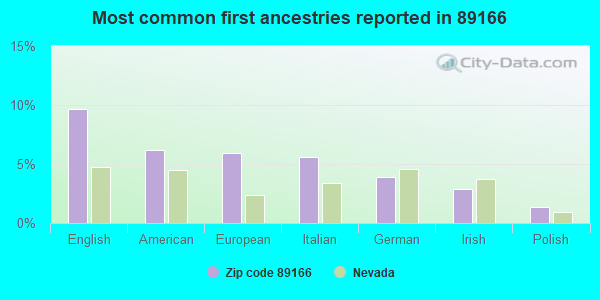
10%English
6%American
6%European
6%Italian
4%German
3%Irish
1%Polish
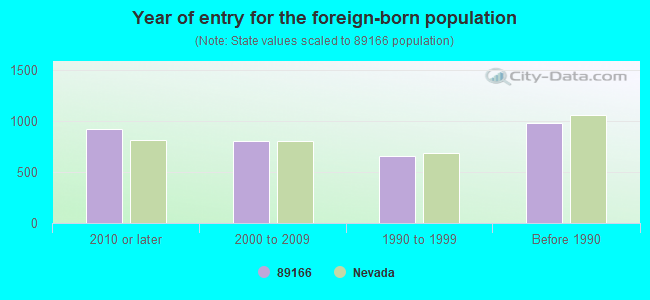
Year of entry for the foreign-born population
9212010 or later
8022000 to 2009
6571990 to 1999
979Before 1990
Housing units lacking complete plumbing facilities: 0.3% Housing units lacking complete kitchen facilities: 0.1%
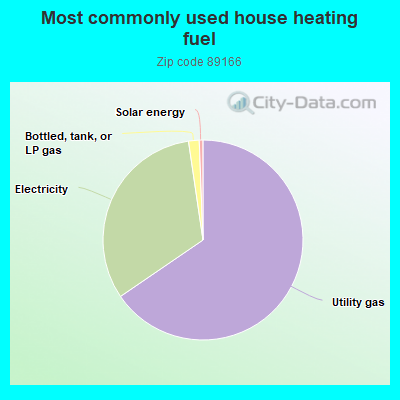
65.2%Utility gas
32.1%Electricity
1.7%Bottled, tank, or LP gas
0.6%Solar energy
Place of birth for U.S.-born residents:
This state: 9,095
Northeast: 2,361
Midwest: 2,799
South: 3,059
West: 8,588
82% of the 89166 zip code residents lived in the same house 1 year ago. Out of people who lived in different houses, 53% moved from this county. Out of people who lived in different houses, 40% moved from different state. Out of people who lived in different houses, 4% moved from abroad.
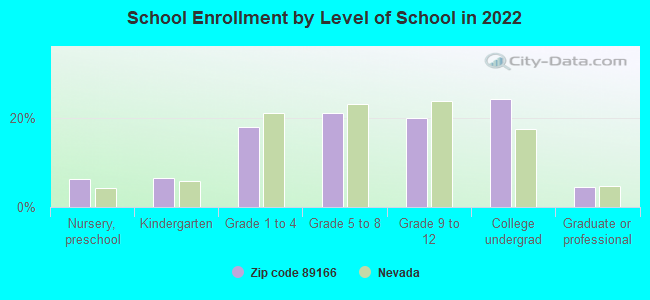
Private vs. public school enrollment:
Students in private schools in grades 1 to 8 (elementary and middle school): 705
Here:
20.6%
Nevada:
12.9%
Students in private schools in grades 9 to 12 (high school): 58
Here:
3.5%
Nevada:
6.9%
Students in private undergraduate colleges: 438
Here:
21.4%
Nevada:
16.0%
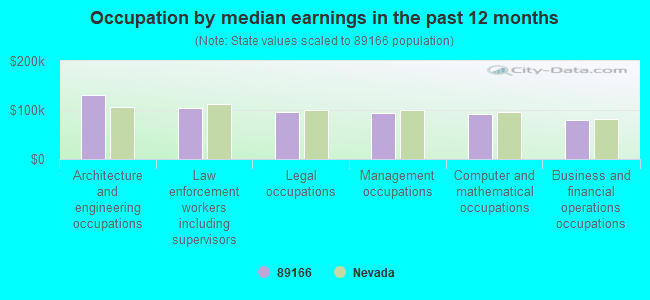
Occupation by median earnings in the past 12 months ($)
129,910Architecture and engineering occupations
103,930Law enforcement workers including supervisors
96,358Legal occupations
94,790Management occupations
92,124Computer and mathematical occupations
79,117Business and financial operations occupations
Top industries in this zip code by the number of employees in 2005:
Finance and Insurance: Mortgage and Nonmortgage Loan Brokers (1-4 employees: 1 establishment)
Construction: Electrical Contractors (1-4: 1)
Fatal accident statistics in 2014:
Fatal accident count: 1
Vehicles involved in fatal accidents: 1
Fatal accidents caused by drunken drivers: 0
Fatalities: 1
Persons involved in fatal accidents: 1
Pedestrians involved in fatal accidents: 0
Fatal accident statistics in 2013:
Fatal accident count: 4
Vehicles involved in fatal accidents: 5
Fatal accidents caused by drunken drivers: 3
Fatalities: 4
Persons involved in fatal accidents: 6
Pedestrians involved in fatal accidents: 0
2006 - 2018 National Fire Incident Reporting System (NFIRS) incidents
According to the data from the years 2006 - 2018 the average number of fire incidents per year is 15. The highest number of reported fire incidents - 28 took place in 2008, and the least - 3 in 2006. The data has a rising trend.
When looking into fire subcategories, the most incidents belonged to: Outside Fires (43.1%), and Structure Fires (28.9%).
Fire incident types reported to NFIRS in Zip Code 89166


 According to the data from the years 2006 - 2018 the average number of fire incidents per year is 15. The highest number of reported fire incidents - 28 took place in 2008, and the least - 3 in 2006. The data has a rising trend.
 When looking into fire subcategories, the most incidents belonged to: Outside Fires (43.1%), and Structure Fires (28.9%).