Estimated zip code population in 2022: 13,530
Zip code population in 2010: 12,786
Zip code population in 2000: 2,408
Houses and condos: 4,383
Renter-occupied apartments: 1,087
% of renters here:
25%State:
40%
March 2022 cost of living index in zip code 89143: 98.9
(near average, U.S. average is 100)
Land area: 3.4
sq. mi.
Water area: 0.0
sq. mi.
Population density: 3,953 people per square mile (average).
OSM Map
General Map
Google Map
MSN Map
OSM Map
General Map
Google Map
MSN Map
OSM Map
General Map
Google Map
MSN Map
OSM Map
General Map
Google Map
MSN Map
Please wait while loading the map...
Real estate property taxes paid for housing units in 2022:
This zip code:
0.5% ($2,313)Nevada:
0.4% ($1,889)
Median real estate property taxes paid for housing units with mortgages in 2022: $2,290 (0.5%)
Median real estate property taxes paid for housing units with no mortgage in 2022: $2,452 (0.5%)
Profiles of local businesses
Business Search - 14 Million verified businesses
Males: 6,224 Females: 7,309
For population 25 years and over in 89143:
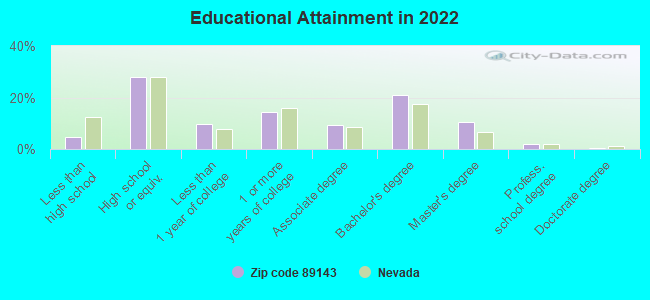
High school or higher: 95.5%Bachelor's degree or higher: 33.9%Graduate or professional degree: 13.0%Unemployed: 4.5%Mean travel time to work (commute): 29.0 minutes
For population 15 years and over in 89143:
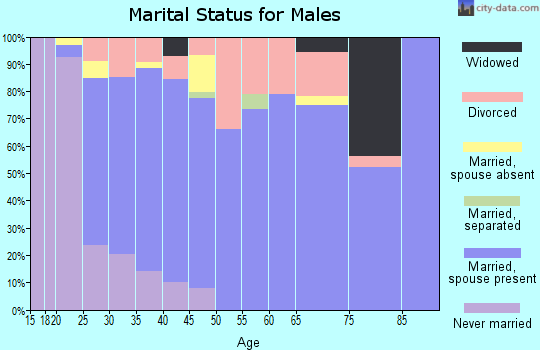
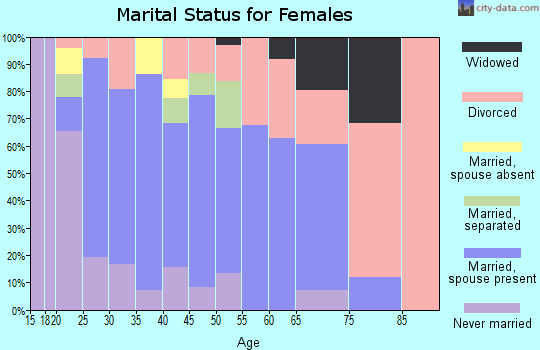
Never married: 33.0%Now married: 49.8%Separated: 0.8%Widowed: 4.1%Divorced: 12.4%
Zip code 89143 compared to state average:
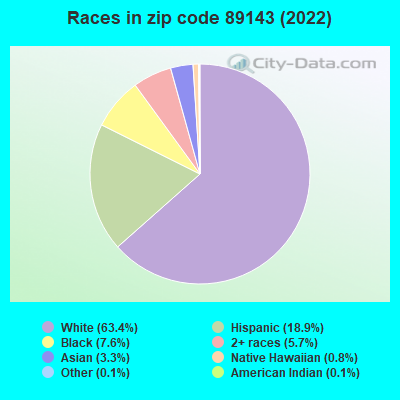
Median age below state average. Foreign-born population percentage significantly below state average. Renting percentage below state average. Number of rooms per house above state average. House age below state average. 8,570 63.4% White 2,562 18.9% Hispanic or Latino 1,032 7.6% Black 769 5.7% Two or more races 445 3.3% Asian 111 0.8% Native Hawaiian and Other 18 0.1% American Indian 19 0.1% Some other race
Data:
Median household income ($)
Median household income (% change since 2000)
Household income diversity
Ratio of average income to average house value (%)
Ratio of average income to average rent
Median household income ($) - White
Median household income ($) - Black or African American
Median household income ($) - Asian
Median household income ($) - Hispanic or Latino
Median household income ($) - American Indian and Alaska Native
Median household income ($) - Multirace
Median household income ($) - Other Race
Median household income for houses/condos with a mortgage ($)
Median household income for apartments without a mortgage ($)
Races - White alone (%)
Races - White alone (% change since 2000)
Races - Black alone (%)
Races - Black alone (% change since 2000)
Races - American Indian alone (%)
Races - American Indian alone (% change since 2000)
Races - Asian alone (%)
Races - Asian alone (% change since 2000)
Races - Hispanic (%)
Races - Hispanic (% change since 2000)
Races - Native Hawaiian and Other Pacific Islander alone (%)
Races - Native Hawaiian and Other Pacific Islander alone (% change since 2000)
Races - Two or more races (%)
Races - Two or more races (% change since 2000)
Races - Other race alone (%)
Races - Other race alone (% change since 2000)
Racial diversity
Unemployment (%)
Unemployment (% change since 2000)
Unemployment (%) - White
Unemployment (%) - Black or African American
Unemployment (%) - Asian
Unemployment (%) - Hispanic or Latino
Unemployment (%) - American Indian and Alaska Native
Unemployment (%) - Multirace
Unemployment (%) - Other Race
Population density (people per square mile)
Population - Males (%)
Population - Females (%)
Population - Males (%) - White
Population - Males (%) - Black or African American
Population - Males (%) - Asian
Population - Males (%) - Hispanic or Latino
Population - Males (%) - American Indian and Alaska Native
Population - Males (%) - Multirace
Population - Males (%) - Other Race
Population - Females (%) - White
Population - Females (%) - Black or African American
Population - Females (%) - Asian
Population - Females (%) - Hispanic or Latino
Population - Females (%) - American Indian and Alaska Native
Population - Females (%) - Multirace
Population - Females (%) - Other Race
Coronavirus confirmed cases (May 02, 2024)
Deaths caused by coronavirus (May 02, 2024)
Coronavirus confirmed cases (per 100k population) (May 02, 2024)
Deaths caused by coronavirus (per 100k population) (May 02, 2024)
Daily increase in number of cases (May 02, 2024)
Weekly increase in number of cases (May 02, 2024)
Cases doubled (in days) (May 02, 2024)
Hospitalized patients (Apr 18, 2022)
Negative test results (Apr 18, 2022)
Total test results (Apr 18, 2022)
COVID Vaccine doses distributed (per 100k population) (Sep 19, 2023)
COVID Vaccine doses administered (per 100k population) (Sep 19, 2023)
COVID Vaccine doses distributed (Sep 19, 2023)
COVID Vaccine doses administered (Sep 19, 2023)
Likely homosexual households (%)
Likely homosexual households (% change since 2000)
Likely homosexual households - Lesbian couples (%)
Likely homosexual households - Lesbian couples (% change since 2000)
Likely homosexual households - Gay men (%)
Likely homosexual households - Gay men (% change since 2000)
Cost of living index
Median gross rent ($)
Median contract rent ($)
Median monthly housing costs ($)
Median house or condo value ($)
Median house or condo value ($ change since 2000)
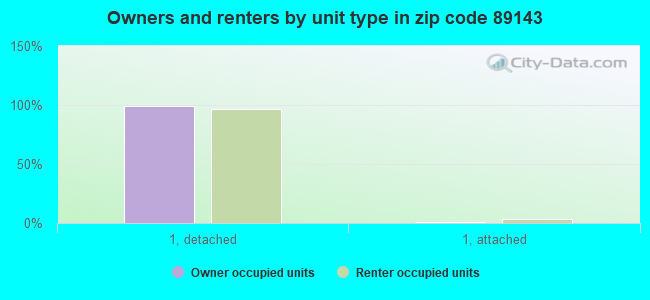
Mean house or condo value by units in structure - 1, detached ($)
Mean house or condo value by units in structure - 1, attached ($)
Mean house or condo value by units in structure - 2 ($)
Mean house or condo value by units in structure by units in structure - 3 or 4 ($)
Mean house or condo value by units in structure - 5 or more ($)
Mean house or condo value by units in structure - Boat, RV, van, etc. ($)
Mean house or condo value by units in structure - Mobile home ($)
Median house or condo value ($) - White
Median house or condo value ($) - Black or African American
Median house or condo value ($) - Asian
Median house or condo value ($) - Hispanic or Latino
Median house or condo value ($) - American Indian and Alaska Native
Median house or condo value ($) - Multirace
Median house or condo value ($) - Other Race
Median resident age
Resident age diversity
Median resident age - Males
Median resident age - Females
Median resident age - White
Median resident age - Black or African American
Median resident age - Asian
Median resident age - Hispanic or Latino
Median resident age - American Indian and Alaska Native
Median resident age - Multirace
Median resident age - Other Race
Median resident age - Males - White
Median resident age - Males - Black or African American
Median resident age - Males - Asian
Median resident age - Males - Hispanic or Latino
Median resident age - Males - American Indian and Alaska Native
Median resident age - Males - Multirace
Median resident age - Males - Other Race
Median resident age - Females - White
Median resident age - Females - Black or African American
Median resident age - Females - Asian
Median resident age - Females - Hispanic or Latino
Median resident age - Females - American Indian and Alaska Native
Median resident age - Females - Multirace
Median resident age - Females - Other Race
Commute - mean travel time to work (minutes)
Travel time to work - Less than 5 minutes (%)
Travel time to work - Less than 5 minutes (% change since 2000)
Travel time to work - 5 to 9 minutes (%)
Travel time to work - 5 to 9 minutes (% change since 2000)
Travel time to work - 10 to 19 minutes (%)
Travel time to work - 10 to 19 minutes (% change since 2000)
Travel time to work - 20 to 29 minutes (%)
Travel time to work - 20 to 29 minutes (% change since 2000)
Travel time to work - 30 to 39 minutes (%)
Travel time to work - 30 to 39 minutes (% change since 2000)
Travel time to work - 40 to 59 minutes (%)
Travel time to work - 40 to 59 minutes (% change since 2000)
Travel time to work - 60 to 89 minutes (%)
Travel time to work - 60 to 89 minutes (% change since 2000)
Travel time to work - 90 or more minutes (%)
Travel time to work - 90 or more minutes (% change since 2000)
Marital status - Never married (%)
Marital status - Now married (%)
Marital status - Separated (%)
Marital status - Widowed (%)
Marital status - Divorced (%)
Median family income ($)
Median family income (% change since 2000)
Median non-family income ($)
Median non-family income (% change since 2000)
Median per capita income ($)
Median per capita income (% change since 2000)
Median family income ($) - White
Median family income ($) - Black or African American
Median family income ($) - Asian
Median family income ($) - Hispanic or Latino
Median family income ($) - American Indian and Alaska Native
Median family income ($) - Multirace
Median family income ($) - Other Race
Median year house/condo built
Median year apartment built
Year house built - Built 2005 or later (%)
Year house built - Built 2000 to 2004 (%)
Year house built - Built 1990 to 1999 (%)
Year house built - Built 1980 to 1989 (%)
Year house built - Built 1970 to 1979 (%)
Year house built - Built 1960 to 1969 (%)
Year house built - Built 1950 to 1959 (%)
Year house built - Built 1940 to 1949 (%)
Year house built - Built 1939 or earlier (%)
Average household size
Household density (households per square mile)
Average household size - White
Average household size - Black or African American
Average household size - Asian
Average household size - Hispanic or Latino
Average household size - American Indian and Alaska Native
Average household size - Multirace
Average household size - Other Race
Occupied housing units (%)
Vacant housing units (%)
Owner occupied housing units (%)
Renter occupied housing units (%)
Vacancy status - For rent (%)
Vacancy status - For sale only (%)
Vacancy status - Rented or sold, not occupied (%)
Vacancy status - For seasonal, recreational, or occasional use (%)
Vacancy status - For migrant workers (%)
Vacancy status - Other vacant (%)
Residents with income below the poverty level (%)
Residents with income below 50% of the poverty level (%)
Children below poverty level (%)
Poor families by family type - Married-couple family (%)
Poor families by family type - Male, no wife present (%)
Poor families by family type - Female, no husband present (%)
Poverty status for native-born residents (%)
Poverty status for foreign-born residents (%)
Poverty among high school graduates not in families (%)
Poverty among people who did not graduate high school not in families (%)
Residents with income below the poverty level (%) - White
Residents with income below the poverty level (%) - Black or African American
Residents with income below the poverty level (%) - Asian
Residents with income below the poverty level (%) - Hispanic or Latino
Residents with income below the poverty level (%) - American Indian and Alaska Native
Residents with income below the poverty level (%) - Multirace
Residents with income below the poverty level (%) - Other Race
Air pollution - Air Quality Index (AQI)
Air pollution - CO
Air pollution - NO2
Air pollution - SO2
Air pollution - Ozone
Air pollution - PM10
Air pollution - PM25
Air pollution - Pb
Crime - Murders per 100,000 population
Crime - Rapes per 100,000 population
Crime - Robberies per 100,000 population
Crime - Assaults per 100,000 population
Crime - Burglaries per 100,000 population
Crime - Thefts per 100,000 population
Crime - Auto thefts per 100,000 population
Crime - Arson per 100,000 population
Crime - City-data.com crime index
Crime - Violent crime index
Crime - Property crime index
Crime - Murders per 100,000 population (5 year average)
Crime - Rapes per 100,000 population (5 year average)
Crime - Robberies per 100,000 population (5 year average)
Crime - Assaults per 100,000 population (5 year average)
Crime - Burglaries per 100,000 population (5 year average)
Crime - Thefts per 100,000 population (5 year average)
Crime - Auto thefts per 100,000 population (5 year average)
Crime - Arson per 100,000 population (5 year average)
Crime - City-data.com crime index (5 year average)
Crime - Violent crime index (5 year average)
Crime - Property crime index (5 year average)
1996 Presidential Elections Results (%) - Democratic Party (Clinton)
1996 Presidential Elections Results (%) - Republican Party (Dole)
1996 Presidential Elections Results (%) - Other
2000 Presidential Elections Results (%) - Democratic Party (Gore)
2000 Presidential Elections Results (%) - Republican Party (Bush)
2000 Presidential Elections Results (%) - Other
2004 Presidential Elections Results (%) - Democratic Party (Kerry)
2004 Presidential Elections Results (%) - Republican Party (Bush)
2004 Presidential Elections Results (%) - Other
2008 Presidential Elections Results (%) - Democratic Party (Obama)
2008 Presidential Elections Results (%) - Republican Party (McCain)
2008 Presidential Elections Results (%) - Other
2012 Presidential Elections Results (%) - Democratic Party (Obama)
2012 Presidential Elections Results (%) - Republican Party (Romney)
2012 Presidential Elections Results (%) - Other
2016 Presidential Elections Results (%) - Democratic Party (Clinton)
2016 Presidential Elections Results (%) - Republican Party (Trump)
2016 Presidential Elections Results (%) - Other
2020 Presidential Elections Results (%) - Democratic Party (Biden)
2020 Presidential Elections Results (%) - Republican Party (Trump)
2020 Presidential Elections Results (%) - Other
Ancestries Reported - Arab (%)
Ancestries Reported - Czech (%)
Ancestries Reported - Danish (%)
Ancestries Reported - Dutch (%)
Ancestries Reported - English (%)
Ancestries Reported - French (%)
Ancestries Reported - French Canadian (%)
Ancestries Reported - German (%)
Ancestries Reported - Greek (%)
Ancestries Reported - Hungarian (%)
Ancestries Reported - Irish (%)
Ancestries Reported - Italian (%)
Ancestries Reported - Lithuanian (%)
Ancestries Reported - Norwegian (%)
Ancestries Reported - Polish (%)
Ancestries Reported - Portuguese (%)
Ancestries Reported - Russian (%)
Ancestries Reported - Scotch-Irish (%)
Ancestries Reported - Scottish (%)
Ancestries Reported - Slovak (%)
Ancestries Reported - Subsaharan African (%)
Ancestries Reported - Swedish (%)
Ancestries Reported - Swiss (%)
Ancestries Reported - Ukrainian (%)
Ancestries Reported - United States (%)
Ancestries Reported - Welsh (%)
Ancestries Reported - West Indian (%)
Ancestries Reported - Other (%)
Educational Attainment - No schooling completed (%)
Educational Attainment - Less than high school (%)
Educational Attainment - High school or equivalent (%)
Educational Attainment - Less than 1 year of college (%)
Educational Attainment - 1 or more years of college (%)
Educational Attainment - Associate degree (%)
Educational Attainment - Bachelor's degree (%)
Educational Attainment - Master's degree (%)
Educational Attainment - Professional school degree (%)
Educational Attainment - Doctorate degree (%)
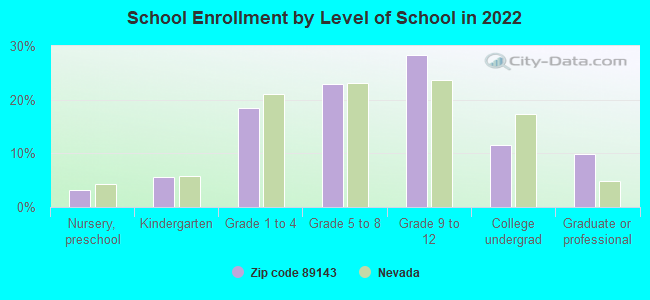
School Enrollment - Nursery, preschool (%)
School Enrollment - Kindergarten (%)
School Enrollment - Grade 1 to 4 (%)
School Enrollment - Grade 5 to 8 (%)
School Enrollment - Grade 9 to 12 (%)
School Enrollment - College undergrad (%)
School Enrollment - Graduate or professional (%)
School Enrollment - Not enrolled in school (%)
School enrollment - Public schools (%)
School enrollment - Private schools (%)
School enrollment - Not enrolled (%)
Median number of rooms in houses and condos
Median number of rooms in apartments
Housing units lacking complete plumbing facilities (%)
Housing units lacking complete kitchen facilities (%)
Density of houses
Urban houses (%)
Rural houses (%)
Households with people 60 years and over (%)
Households with people 65 years and over (%)
Households with people 75 years and over (%)
Households with one or more nonrelatives (%)
Households with no nonrelatives (%)
Population in households (%)
Family households (%)
Nonfamily households (%)
Population in families (%)
Family households with own children (%)
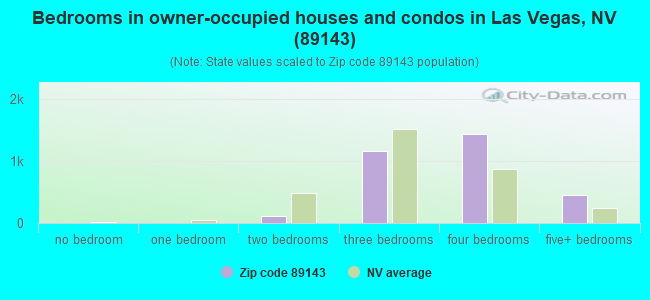
Median number of bedrooms in owner occupied houses
Mean number of bedrooms in owner occupied houses
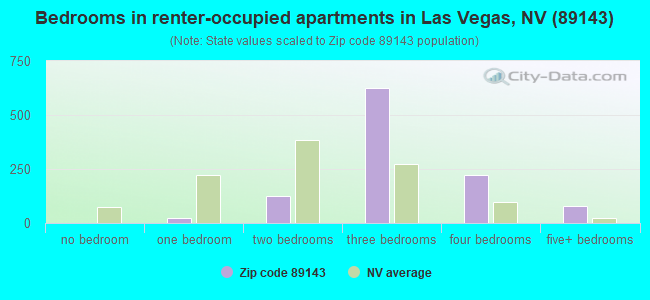
Median number of bedrooms in renter occupied houses
Mean number of bedrooms in renter occupied houses
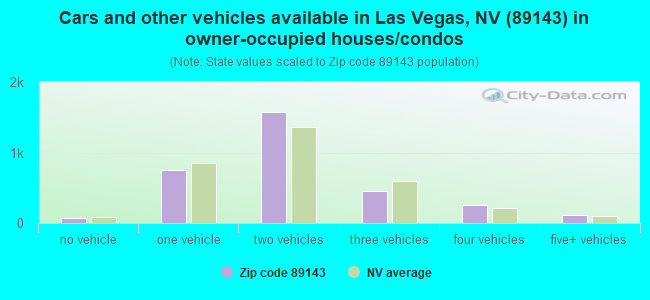
Median number of vehichles in owner occupied houses
Mean number of vehichles in owner occupied houses
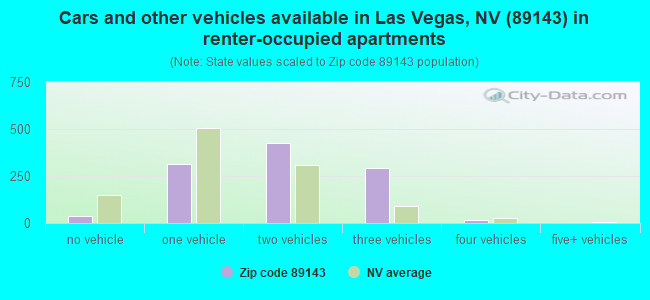
Median number of vehichles in renter occupied houses
Mean number of vehichles in renter occupied houses
Mortgage status - with mortgage (%)
Mortgage status - with second mortgage (%)
Mortgage status - with home equity loan (%)
Mortgage status - with both second mortgage and home equity loan (%)
Mortgage status - without a mortgage (%)
Average family size
Average family size - White
Average family size - Black or African American
Average family size - Asian
Average family size - Hispanic or Latino
Average family size - American Indian and Alaska Native
Average family size - Multirace
Average family size - Other Race
Geographical mobility - Same house 1 year ago (%)
Geographical mobility - Moved within same county (%)
Geographical mobility - Moved from different county within same state (%)
Geographical mobility - Moved from different state (%)
Geographical mobility - Moved from abroad (%)
Place of birth - Born in state of residence (%)
Place of birth - Born in other state (%)
Place of birth - Native, outside of US (%)
Place of birth - Foreign born (%)
Housing units in structures - 1, detached (%)
Housing units in structures - 1, attached (%)
Housing units in structures - 2 (%)
Housing units in structures - 3 or 4 (%)
Housing units in structures - 5 to 9 (%)
Housing units in structures - 10 to 19 (%)
Housing units in structures - 20 to 49 (%)
Housing units in structures - 50 or more (%)
Housing units in structures - Mobile home (%)
Housing units in structures - Boat, RV, van, etc. (%)
House/condo owner moved in on average (years ago)
Renter moved in on average (years ago)
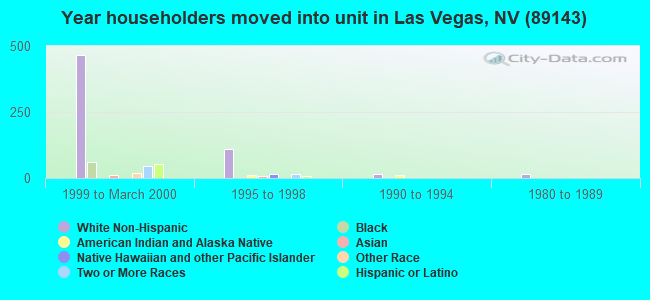
Year householder moved into unit - Moved in 1999 to March 2000 (%)
Year householder moved into unit - Moved in 1995 to 1998 (%)
Year householder moved into unit - Moved in 1990 to 1994 (%)
Year householder moved into unit - Moved in 1980 to 1989 (%)
Year householder moved into unit - Moved in 1970 to 1979 (%)
Year householder moved into unit - Moved in 1969 or earlier (%)
Means of transportation to work - Drove car alone (%)
Means of transportation to work - Carpooled (%)
Means of transportation to work - Public transportation (%)
Means of transportation to work - Bus or trolley bus (%)
Means of transportation to work - Streetcar or trolley car (%)
Means of transportation to work - Subway or elevated (%)
Means of transportation to work - Railroad (%)
Means of transportation to work - Ferryboat (%)
Means of transportation to work - Taxicab (%)
Means of transportation to work - Motorcycle (%)
Means of transportation to work - Bicycle (%)
Means of transportation to work - Walked (%)
Means of transportation to work - Other means (%)
Working at home (%)
Industry diversity
Most Common Industries - Agriculture, forestry, fishing and hunting, and mining (%)
Most Common Industries - Agriculture, forestry, fishing and hunting (%)
Most Common Industries - Mining, quarrying, and oil and gas extraction (%)
Most Common Industries - Construction (%)
Most Common Industries - Manufacturing (%)
Most Common Industries - Wholesale trade (%)
Most Common Industries - Retail trade (%)
Most Common Industries - Transportation and warehousing, and utilities (%)
Most Common Industries - Transportation and warehousing (%)
Most Common Industries - Utilities (%)
Most Common Industries - Information (%)
Most Common Industries - Finance and insurance, and real estate and rental and leasing (%)
Most Common Industries - Finance and insurance (%)
Most Common Industries - Real estate and rental and leasing (%)
Most Common Industries - Professional, scientific, and management, and administrative and waste management services (%)
Most Common Industries - Professional, scientific, and technical services (%)
Most Common Industries - Management of companies and enterprises (%)
Most Common Industries - Administrative and support and waste management services (%)
Most Common Industries - Educational services, and health care and social assistance (%)
Most Common Industries - Educational services (%)
Most Common Industries - Health care and social assistance (%)
Most Common Industries - Arts, entertainment, and recreation, and accommodation and food services (%)
Most Common Industries - Arts, entertainment, and recreation (%)
Most Common Industries - Accommodation and food services (%)
Most Common Industries - Other services, except public administration (%)
Most Common Industries - Public administration (%)
Occupation diversity
Most Common Occupations - Management, business, science, and arts occupations (%)
Most Common Occupations - Management, business, and financial occupations (%)
Most Common Occupations - Management occupations (%)
Most Common Occupations - Business and financial operations occupations (%)
Most Common Occupations - Computer, engineering, and science occupations (%)
Most Common Occupations - Computer and mathematical occupations (%)
Most Common Occupations - Architecture and engineering occupations (%)
Most Common Occupations - Life, physical, and social science occupations (%)
Most Common Occupations - Education, legal, community service, arts, and media occupations (%)
Most Common Occupations - Community and social service occupations (%)
Most Common Occupations - Legal occupations (%)
Most Common Occupations - Education, training, and library occupations (%)
Most Common Occupations - Arts, design, entertainment, sports, and media occupations (%)
Most Common Occupations - Healthcare practitioners and technical occupations (%)
Most Common Occupations - Health diagnosing and treating practitioners and other technical occupations (%)
Most Common Occupations - Health technologists and technicians (%)
Most Common Occupations - Service occupations (%)
Most Common Occupations - Healthcare support occupations (%)
Most Common Occupations - Protective service occupations (%)
Most Common Occupations - Fire fighting and prevention, and other protective service workers including supervisors (%)
Most Common Occupations - Law enforcement workers including supervisors (%)
Most Common Occupations - Food preparation and serving related occupations (%)
Most Common Occupations - Building and grounds cleaning and maintenance occupations (%)
Most Common Occupations - Personal care and service occupations (%)
Most Common Occupations - Sales and office occupations (%)
Most Common Occupations - Sales and related occupations (%)
Most Common Occupations - Office and administrative support occupations (%)
Most Common Occupations - Natural resources, construction, and maintenance occupations (%)
Most Common Occupations - Farming, fishing, and forestry occupations (%)
Most Common Occupations - Construction and extraction occupations (%)
Most Common Occupations - Installation, maintenance, and repair occupations (%)
Most Common Occupations - Production, transportation, and material moving occupations (%)
Most Common Occupations - Production occupations (%)
Most Common Occupations - Transportation occupations (%)
Most Common Occupations - Material moving occupations (%)
People in Group quarters - Institutionalized population (%)
People in Group quarters - Correctional institutions (%)
People in Group quarters - Federal prisons and detention centers (%)
People in Group quarters - Halfway houses (%)
People in Group quarters - Local jails and other confinement facilities (including police lockups) (%)
People in Group quarters - Military disciplinary barracks (%)
People in Group quarters - State prisons (%)
People in Group quarters - Other types of correctional institutions (%)
People in Group quarters - Nursing homes (%)
People in Group quarters - Hospitals/wards, hospices, and schools for the handicapped (%)
People in Group quarters - Hospitals/wards and hospices for chronically ill (%)
People in Group quarters - Hospices or homes for chronically ill (%)
People in Group quarters - Military hospitals or wards for chronically ill (%)
People in Group quarters - Other hospitals or wards for chronically ill (%)
People in Group quarters - Hospitals or wards for drug/alcohol abuse (%)
People in Group quarters - Mental (Psychiatric) hospitals or wards (%)
People in Group quarters - Schools, hospitals, or wards for the mentally retarded (%)
People in Group quarters - Schools, hospitals, or wards for the physically handicapped (%)
People in Group quarters - Institutions for the deaf (%)
People in Group quarters - Institutions for the blind (%)
People in Group quarters - Orthopedic wards and institutions for the physically handicapped (%)
People in Group quarters - Wards in general hospitals for patients who have no usual home elsewhere (%)
People in Group quarters - Wards in military hospitals for patients who have no usual home elsewhere (%)
People in Group quarters - Juvenile institutions (%)
People in Group quarters - Long-term care (%)
People in Group quarters - Homes for abused, dependent, and neglected children (%)
People in Group quarters - Residential treatment centers for emotionally disturbed children (%)
People in Group quarters - Training schools for juvenile delinquents (%)
People in Group quarters - Short-term care, detention or diagnostic centers for delinquent children (%)
People in Group quarters - Type of juvenile institution unknown (%)
People in Group quarters - Noninstitutionalized population (%)
People in Group quarters - College dormitories (includes college quarters off campus) (%)
People in Group quarters - Military quarters (%)
People in Group quarters - On base (%)
People in Group quarters - Barracks, unaccompanied personnel housing (UPH), (Enlisted/Officer), ;and similar group living quarters for military personnel (%)
People in Group quarters - Transient quarters for temporary residents (%)
People in Group quarters - Military ships (%)
People in Group quarters - Group homes (%)
People in Group quarters - Homes or halfway houses for drug/alcohol abuse (%)
People in Group quarters - Homes for the mentally ill (%)
People in Group quarters - Homes for the mentally retarded (%)
People in Group quarters - Homes for the physically handicapped (%)
People in Group quarters - Other group homes (%)
People in Group quarters - Religious group quarters (%)
People in Group quarters - Dormitories (%)
People in Group quarters - Agriculture workers' dormitories on farms (%)
People in Group quarters - Job Corps and vocational training facilities (%)
People in Group quarters - Other workers' dormitories (%)
People in Group quarters - Crews of maritime vessels (%)
People in Group quarters - Other nonhousehold living situations (%)
People in Group quarters - Other noninstitutional group quarters (%)
Residents speaking English at home (%)
Residents speaking English at home - Born in the United States (%)
Residents speaking English at home - Native, born elsewhere (%)
Residents speaking English at home - Foreign born (%)
Residents speaking Spanish at home (%)
Residents speaking Spanish at home - Born in the United States (%)
Residents speaking Spanish at home - Native, born elsewhere (%)
Residents speaking Spanish at home - Foreign born (%)
Residents speaking other language at home (%)
Residents speaking other language at home - Born in the United States (%)
Residents speaking other language at home - Native, born elsewhere (%)
Residents speaking other language at home - Foreign born (%)
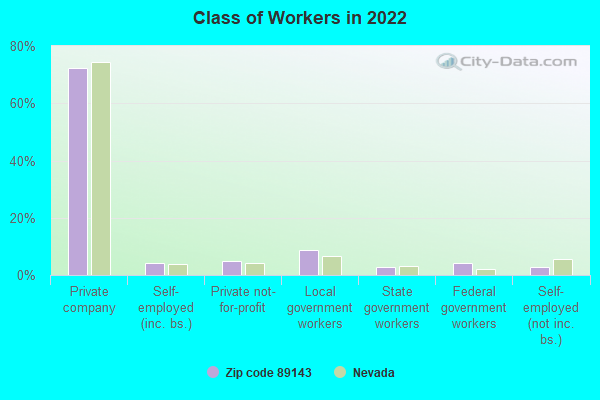
Class of Workers - Employee of private company (%)
Class of Workers - Self-employed in own incorporated business (%)
Class of Workers - Private not-for-profit wage and salary workers (%)
Class of Workers - Local government workers (%)
Class of Workers - State government workers (%)
Class of Workers - Federal government workers (%)
Class of Workers - Self-employed workers in own not incorporated business and Unpaid family workers (%)
House heating fuel used in houses and condos - Utility gas (%)
House heating fuel used in houses and condos - Bottled, tank, or LP gas (%)
House heating fuel used in houses and condos - Electricity (%)
House heating fuel used in houses and condos - Fuel oil, kerosene, etc. (%)
House heating fuel used in houses and condos - Coal or coke (%)
House heating fuel used in houses and condos - Wood (%)
House heating fuel used in houses and condos - Solar energy (%)
House heating fuel used in houses and condos - Other fuel (%)
House heating fuel used in houses and condos - No fuel used (%)
House heating fuel used in apartments - Utility gas (%)
House heating fuel used in apartments - Bottled, tank, or LP gas (%)
House heating fuel used in apartments - Electricity (%)
House heating fuel used in apartments - Fuel oil, kerosene, etc. (%)
House heating fuel used in apartments - Coal or coke (%)
House heating fuel used in apartments - Wood (%)
House heating fuel used in apartments - Solar energy (%)
House heating fuel used in apartments - Other fuel (%)
House heating fuel used in apartments - No fuel used (%)
Armed forces status - In Armed Forces (%)
Armed forces status - Civilian (%)
Armed forces status - Civilian - Veteran (%)
Armed forces status - Civilian - Nonveteran (%)
Fatal accidents locations in years 2005-2021
Fatal accidents locations in 2005
Fatal accidents locations in 2006
Fatal accidents locations in 2007
Fatal accidents locations in 2008
Fatal accidents locations in 2009
Fatal accidents locations in 2010
Fatal accidents locations in 2011
Fatal accidents locations in 2012
Fatal accidents locations in 2013
Fatal accidents locations in 2014
Fatal accidents locations in 2015
Fatal accidents locations in 2016
Fatal accidents locations in 2017
Fatal accidents locations in 2018
Fatal accidents locations in 2019
Fatal accidents locations in 2020
Fatal accidents locations in 2021
Alcohol use - People drinking some alcohol every month (%)
Alcohol use - People not drinking at all (%)
Alcohol use - Average days/month drinking alcohol
Alcohol use - Average drinks/week
Alcohol use - Average days/year people drink much
Audiometry - Average condition of hearing (%)
Audiometry - People that can hear a whisper from across a quiet room (%)
Audiometry - People that can hear normal voice from across a quiet room (%)
Audiometry - Ears ringing, roaring, buzzing (%)
Audiometry - Had a job exposure to loud noise (%)
Audiometry - Had off-work exposure to loud noise (%)
Blood Pressure & Cholesterol - Has high blood pressure (%)
Blood Pressure & Cholesterol - Checking blood pressure at home (%)
Blood Pressure & Cholesterol - Frequently checking blood cholesterol (%)
Blood Pressure & Cholesterol - Has high cholesterol level (%)
Consumer Behavior - Money monthly spent on food at supermarket/grocery store
Consumer Behavior - Money monthly spent on food at other stores
Consumer Behavior - Money monthly spent on eating out
Consumer Behavior - Money monthly spent on carryout/delivered foods
Consumer Behavior - Income spent on food at supermarket/grocery store (%)
Consumer Behavior - Income spent on food at other stores (%)
Consumer Behavior - Income spent on eating out (%)
Consumer Behavior - Income spent on carryout/delivered foods (%)
Current Health Status - General health condition (%)
Current Health Status - Blood donors (%)
Current Health Status - Has blood ever tested for HIV virus (%)
Current Health Status - Left-handed people (%)
Dermatology - People using sunscreen (%)
Diabetes - Diabetics (%)
Diabetes - Had a blood test for high blood sugar (%)
Diabetes - People taking insulin (%)
Diet Behavior & Nutrition - Diet health (%)
Diet Behavior & Nutrition - Milk product consumption (# of products/month)
Diet Behavior & Nutrition - Meals not home prepared (#/week)
Diet Behavior & Nutrition - Meals from fast food or pizza place (#/week)
Diet Behavior & Nutrition - Ready-to-eat foods (#/month)
Diet Behavior & Nutrition - Frozen meals/pizza (#/month)
Drug Use - People that ever used marijuana or hashish (%)
Drug Use - Ever used hard drugs (%)
Drug Use - Ever used any form of cocaine (%)
Drug Use - Ever used heroin (%)
Drug Use - Ever used methamphetamine (%)
Health Insurance - People covered by health insurance (%)
Kidney Conditions-Urology - Avg. # of times urinating at night
Medical Conditions - People with asthma (%)
Medical Conditions - People with anemia (%)
Medical Conditions - People with psoriasis (%)
Medical Conditions - People with overweight (%)
Medical Conditions - Elderly people having difficulties in thinking or remembering (%)
Medical Conditions - People who ever received blood transfusion (%)
Medical Conditions - People having trouble seeing even with glass/contacts (%)
Medical Conditions - People with arthritis (%)
Medical Conditions - People with gout (%)
Medical Conditions - People with congestive heart failure (%)
Medical Conditions - People with coronary heart disease (%)
Medical Conditions - People with angina pectoris (%)
Medical Conditions - People who ever had heart attack (%)
Medical Conditions - People who ever had stroke (%)
Medical Conditions - People with emphysema (%)
Medical Conditions - People with thyroid problem (%)
Medical Conditions - People with chronic bronchitis (%)
Medical Conditions - People with any liver condition (%)
Medical Conditions - People who ever had cancer or malignancy (%)
Mental Health - People who have little interest in doing things (%)
Mental Health - People feeling down, depressed, or hopeless (%)
Mental Health - People who have trouble sleeping or sleeping too much (%)
Mental Health - People feeling tired or having little energy (%)
Mental Health - People with poor appetite or overeating (%)
Mental Health - People feeling bad about themself (%)
Mental Health - People who have trouble concentrating on things (%)
Mental Health - People moving or speaking slowly or too fast (%)
Mental Health - People having thoughts they would be better off dead (%)
Oral Health - Average years since last visit a dentist
Oral Health - People embarrassed because of mouth (%)
Oral Health - People with gum disease (%)
Oral Health - General health of teeth and gums (%)
Oral Health - Average days a week using dental floss/device
Oral Health - Average days a week using mouthwash for dental problem
Oral Health - Average number of teeth
Pesticide Use - Households using pesticides to control insects (%)
Pesticide Use - Households using pesticides to kill weeds (%)
Physical Activity - People doing vigorous-intensity work activities (%)
Physical Activity - People doing moderate-intensity work activities (%)
Physical Activity - People walking or bicycling (%)
Physical Activity - People doing vigorous-intensity recreational activities (%)
Physical Activity - People doing moderate-intensity recreational activities (%)
Physical Activity - Average hours a day doing sedentary activities
Physical Activity - Average hours a day watching TV or videos
Physical Activity - Average hours a day using computer
Physical Functioning - People having limitations keeping them from working (%)
Physical Functioning - People limited in amount of work they can do (%)
Physical Functioning - People that need special equipment to walk (%)
Physical Functioning - People experiencing confusion/memory problems (%)
Physical Functioning - People requiring special healthcare equipment (%)
Prescription Medications - Average number of prescription medicines taking
Preventive Aspirin Use - Adults 40+ taking low-dose aspirin (%)
Reproductive Health - Vaginal deliveries (%)
Reproductive Health - Cesarean deliveries (%)
Reproductive Health - Deliveries resulted in a live birth (%)
Reproductive Health - Pregnancies resulted in a delivery (%)
Reproductive Health - Women breastfeeding newborns (%)
Reproductive Health - Women that had a hysterectomy (%)
Reproductive Health - Women that had both ovaries removed (%)
Reproductive Health - Women that have ever taken birth control pills (%)
Reproductive Health - Women taking birth control pills (%)
Reproductive Health - Women that have ever used Depo-Provera or injectables (%)
Reproductive Health - Women that have ever used female hormones (%)
Sexual Behavior - People 18+ that ever had sex (vaginal, anal, or oral) (%)
Sexual Behavior - Males 18+ that ever had vaginal sex with a woman (%)
Sexual Behavior - Males 18+ that ever performed oral sex on a woman (%)
Sexual Behavior - Males 18+ that ever had anal sex with a woman (%)
Sexual Behavior - Males 18+ that ever had any sex with a man (%)
Sexual Behavior - Females 18+ that ever had vaginal sex with a man (%)
Sexual Behavior - Females 18+ that ever performed oral sex on a man (%)
Sexual Behavior - Females 18+ that ever had anal sex with a man (%)
Sexual Behavior - Females 18+ that ever had any kind of sex with a woman (%)
Sexual Behavior - Average age people first had sex
Sexual Behavior - Average number of female sex partners in lifetime (males 18+)
Sexual Behavior - Average number of female vaginal sex partners in lifetime (males 18+)
Sexual Behavior - Average age people first performed oral sex on a woman (18+)
Sexual Behavior - Average number of woman performed oral sex on in lifetime (18+)
Sexual Behavior - Average number of male sex partners in lifetime (males 18+)
Sexual Behavior - Average number of male anal sex partners in lifetime (males 18+)
Sexual Behavior - Average age people first performed oral sex on a man (18+)
Sexual Behavior - Average number of male oral sex partners in lifetime (18+)
Sexual Behavior - People using protection when performing oral sex (%)
Sexual Behavior - Average number of times people have vaginal or anal sex a year
Sexual Behavior - People having sex without condom (%)
Sexual Behavior - Average number of male sex partners in lifetime (females 18+)
Sexual Behavior - Average number of male vaginal sex partners in lifetime (females 18+)
Sexual Behavior - Average number of female sex partners in lifetime (females 18+)
Sexual Behavior - Circumcised males 18+ (%)
Sleep Disorders - Average hours sleeping at night
Sleep Disorders - People that has trouble sleeping (%)
Smoking-Cigarette Use - People smoking cigarettes (%)
Taste & Smell - People 40+ having problems with smell (%)
Taste & Smell - People 40+ having problems with taste (%)
Taste & Smell - People 40+ that ever had wisdom teeth removed (%)
Taste & Smell - People 40+ that ever had tonsils teeth removed (%)
Taste & Smell - People 40+ that ever had a loss of consciousness because of a head injury (%)
Taste & Smell - People 40+ that ever had a broken nose or other serious injury to face or skull (%)
Taste & Smell - People 40+ that ever had two or more sinus infections (%)
Weight - Average height (inches)
Weight - Average weight (pounds)
Weight - Average BMI
Weight - People that are obese (%)
Weight - People that ever were obese (%)
Weight - People trying to lose weight (%)
Urban population: 12,569
Rural population: 960
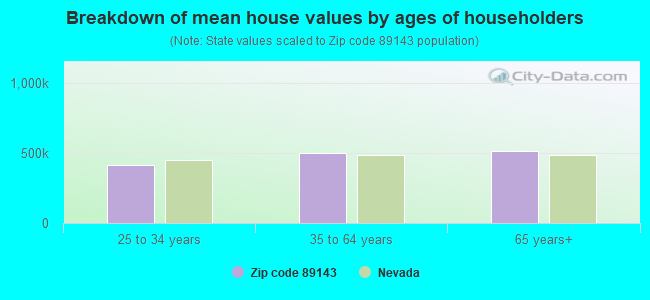
Estimated median house/condo value in 2022: $455,051
89143:
$455,051Nevada:
$434,700
According to our research of Nevada and other state lists, there were 20 registered sex offenders living in 89143 zip code as of May 01, 2024 . The ratio of all residents to sex offenders in zip code 89143 is 648 to 1.The ratio of registered sex offenders to all residents in this zip code is lower than the state average.
Median resident age: This zip code:
32.5 yearsNevada median age:
39.0 years
Average household size: This zip code:
3.2 peopleNevada:
2.6 people
Averages for the 2020 tax year for zip code 89143, filed in 2021:
Average Adjusted Gross Income (AGI) in 2020: $72,899 (Individual Income Tax Returns) Here:
$72,899State:
$78,964
Salary/wage: $62,043 (reported on 86.1% of returns )Here:
$62,043State:
$54,472
(% of AGI for various income ranges: 1085.0% for AGIs below $25k , 3446.5% for AGIs $25k-50k , 6404.2% for AGIs $50k-75k , 9736.7% for AGIs $75k-100k , 18164.1% for AGIs $100k-200k , 62870.0% for AGIs over 200k ) Taxable interest for individuals: $685 (reported on 23.2% of returns )This zip code:
$685Nevada:
$3,521
(% of AGI for various income ranges: 3.8% for AGIs below $25k , 5.0% for AGIs $25k-50k , 20.5% for AGIs $50k-75k , 25.8% for AGIs $75k-100k , 40.1% for AGIs $100k-200k , 404.3% for AGIs over 200k ) Ordinary dividends: $2,273 (reported on 13.4% of returns )(% of AGI for various income ranges: 7.9% for AGIs below $25k , 12.1% for AGIs $25k-50k , 18.0% for AGIs $50k-75k , 52.5% for AGIs $75k-100k , 83.5% for AGIs $100k-200k , 861.4% for AGIs over 200k ) Net capital gain/loss in AGI: +$13,033 (reported on 13.4% of returns )Here:
+$13,033State:
+$63,025
(% of AGI for various income ranges: 3.7% for AGIs below $25k , 4.4% for AGIs $25k-50k , 21.2% for AGIs $50k-75k , 108.1% for AGIs $75k-100k , 307.8% for AGIs $100k-200k , 10572.9% for AGIs over 200k ) Profit/loss from business: +$6,956 (reported on 16.4% of returns )Here:
+$6,956State:
+$11,500
(% of AGI for various income ranges: 64.8% for AGIs below $25k , 128.0% for AGIs $25k-50k , 123.2% for AGIs $50k-75k , 163.1% for AGIs $75k-100k , 257.8% for AGIs $100k-200k , 1498.6% for AGIs over 200k ) Taxable individual retirement arrangement distribution: $21,852 (reported on 5.3% of returns )89143:
$21,852Nevada:
$23,628
(% of AGI for various income ranges: 36.9% for AGIs below $25k , 52.4% for AGIs $25k-50k , 112.2% for AGIs $50k-75k , 146.5% for AGIs $75k-100k , 395.5% for AGIs $100k-200k , 2104.3% for AGIs over 200k ) Total itemized deductions: $32,951 (reported on 10.0% of returns )Here:
$32,951State:
$44,173
(% of AGI for various income ranges: 29.7% for AGIs below $25k , 166.4% for AGIs $25k-50k , 331.9% for AGIs $50k-75k , 442.5% for AGIs $75k-100k , 1076.2% for AGIs $100k-200k , 7457.1% for AGIs over 200k ) Charity contributions: $8,686 (reported on 8.3% of returns )(% of AGI for various income ranges: 23.6% for AGIs $25k-50k , 43.4% for AGIs $50k-75k , 95.4% for AGIs $75k-100k , 241.6% for AGIs $100k-200k , 2211.4% for AGIs over 200k ) Taxes paid: $5,884 (reported on 9.8% of returns )(% of AGI for various income ranges: 36.9% for AGIs $25k-50k , 61.9% for AGIs $50k-75k , 86.9% for AGIs $75k-100k , 211.9% for AGIs $100k-200k , 951.4% for AGIs over 200k ) Earned income credit: $2,142 (reported on 13.2% of returns )(% of AGI for various income ranges: 71.0% for AGIs below $25k , 71.3% for AGIs $25k-50k ) Percentage of individuals using paid preparers for their 2020 taxes: 94.6%(% for various income ranges: 94.2% for AGIs below $25k , 94.9% for AGIs $25k-50k , 95.7% for AGIs $50k-75k , 92.6% for AGIs $75k-100k , 94.7% for AGIs $100k-200k , 95.5% for AGIs over 200k )
Averages for the 2012 tax year for zip code 89143, filed in 2013:
Average Adjusted Gross Income (AGI) in 2012: $59,990 (Individual Income Tax Returns) Here:
$59,990State:
$61,164
Salary/wage: $55,665 (reported on 88.0% of returns )Here:
$55,665State:
$45,924
(% of AGI for various income ranges: 74.7% for AGIs below $25k , 86.6% for AGIs $25k-50k , 86.3% for AGIs $50k-75k , 84.5% for AGIs $75k-100k , 83.2% for AGIs $100k-200k , 61.0% for AGIs over 200k ) Taxable interest for individuals: $683 (reported on 24.2% of returns )This zip code:
$683Nevada:
$3,137
(% of AGI for various income ranges: 0.6% for AGIs below $25k , 0.3% for AGIs $25k-50k , 0.4% for AGIs $50k-75k , 0.2% for AGIs $75k-100k , 0.2% for AGIs $100k-200k , 0.2% for AGIs over 200k ) Ordinary dividends: $3,184 (reported on 13.7% of returns )(% of AGI for various income ranges: 3.3% for AGIs below $25k , 1.1% for AGIs $25k-50k , 0.4% for AGIs $50k-75k , 0.4% for AGIs $75k-100k , 0.5% for AGIs $100k-200k , 0.6% for AGIs over 200k ) Net capital gain/loss in AGI: +$4,607 (reported on 11.3% of returns )Here:
+$4,607State:
+$33,127
(% of AGI for various income ranges: 0.3% for AGIs $100k-200k , 7.6% for AGIs over 200k ) Profit/loss from business: +$8,085 (reported on 13.7% of returns )Here:
+$8,085State:
+$12,567
(% of AGI for various income ranges: 6.7% for AGIs below $25k , 2.6% for AGIs $25k-50k , 1.5% for AGIs $50k-75k , 1.7% for AGIs $75k-100k , 1.5% for AGIs $100k-200k ) Taxable individual retirement arrangement distribution: $16,930 (reported on 5.6% of returns )89143:
$16,930Nevada:
$20,808
(% of AGI for various income ranges: 1.8% for AGIs below $25k , 1.3% for AGIs $25k-50k , 1.3% for AGIs $50k-75k , 1.4% for AGIs $75k-100k , 2.5% for AGIs $100k-200k ) Total itemized deductions: $21,760 (24% of AGI, reported on 40.0% of returns )Here:
$21,760State:
$26,148
Here:
23.7% of AGIState:
20.0% of AGI
(% of AGI for various income ranges: 13.6% for AGIs below $25k , 12.5% for AGIs $25k-50k , 14.3% for AGIs $50k-75k , 14.8% for AGIs $75k-100k , 15.6% for AGIs $100k-200k , 14.9% for AGIs over 200k ) Charity contributions: $3,269 (reported on 33.3% of returns )(% of AGI for various income ranges: 0.7% for AGIs below $25k , 1.2% for AGIs $25k-50k , 1.6% for AGIs $50k-75k , 1.9% for AGIs $75k-100k , 2.1% for AGIs $100k-200k , 2.6% for AGIs over 200k ) Taxes paid: $4,177 (reported on 39.7% of returns )(% of AGI for various income ranges: 1.9% for AGIs below $25k , 2.2% for AGIs $25k-50k , 2.6% for AGIs $50k-75k , 2.9% for AGIs $75k-100k , 3.2% for AGIs $100k-200k , 2.9% for AGIs over 200k ) Earned income credit: $2,124 (reported on 15.6% of returns )(% of AGI for various income ranges: 5.9% for AGIs below $25k , 1.3% for AGIs $25k-50k ) Percentage of individuals using paid preparers for their 2012 taxes: 47.9%(% for various income ranges: 44.0% for AGIs below $25k , 42.5% for AGIs $25k-50k , 47.9% for AGIs $50k-75k , 56.1% for AGIs $75k-100k , 54.5% for AGIs $100k-200k , 72.7% for AGIs over 200k )
Averages for the 2004 tax year for zip code 89143, filed in 2005:
Average Adjusted Gross Income (AGI) in 2004: $58,106 (Individual Income Tax Returns) Here:
$58,106State:
$58,367
Salary/wage: $53,675 (reported on 91.8% of returns )Here:
$53,675State:
$42,695
(% of AGI for various income ranges: 99.9% for AGIs below $10k , 86.6% for AGIs $10k-25k , 90.8% for AGIs $25k-50k , 88.4% for AGIs $50k-75k , 87.8% for AGIs $75k-100k , 77.4% for AGIs over 100k ) Taxable interest for individuals: $815 (reported on 38.5% of returns )This zip code:
$815Nevada:
$3,867
(% of AGI for various income ranges: 3.0% for AGIs below $10k , 1.0% for AGIs $10k-25k , 0.3% for AGIs $25k-50k , 0.4% for AGIs $50k-75k , 0.5% for AGIs $75k-100k , 0.6% for AGIs over 100k ) Taxable dividends: $1,842 (reported on 14.3% of returns )(% of AGI for various income ranges: 1.9% for AGIs below $10k , 0.7% for AGIs $10k-25k , 0.2% for AGIs $25k-50k , 0.2% for AGIs $50k-75k , 0.2% for AGIs $75k-100k , 0.8% for AGIs over 100k ) Net capital gain/loss: +$12,666 (reported on 13.7% of returns )Here:
+$12,666State:
+$50,644
(% of AGI for various income ranges: 0.6% for AGIs below $10k , -0.6% for AGIs $10k-25k , 0.3% for AGIs $25k-50k , 1.0% for AGIs $50k-75k , 1.6% for AGIs $75k-100k , 6.8% for AGIs over 100k ) Profit/loss from business: +$8,741 (reported on 13.8% of returns )Here:
+$8,741State:
+$13,618
(% of AGI for various income ranges: -0.9% for AGIs below $10k , 5.3% for AGIs $10k-25k , 1.5% for AGIs $25k-50k , 1.9% for AGIs $50k-75k , 2.2% for AGIs $75k-100k , 2.0% for AGIs over 100k ) IRA payment deduction: $2,722 (reported on 1.8% of returns )89143:
$2,722Nevada:
$3,054
(% of AGI for various income ranges: 0.1% for AGIs $25k-50k , 0.1% for AGIs $50k-75k , 0.1% for AGIs $75k-100k , 0.1% for AGIs over 100k ) Self-employed pension: $13,833 (reported on 0.3% of returns )Here:
$13,833Nevada:
$16,706
Total itemized deductions: $21,774 (28% of AGI, reported on 61.3% of returns )Here:
$21,774State:
$22,990
Here:
28.5% of AGIState:
21.8% of AGI
(% of AGI for various income ranges: 23.9% for AGIs below $10k , 21.5% for AGIs $10k-25k , 24.9% for AGIs $25k-50k , 26.3% for AGIs $50k-75k , 23.9% for AGIs $75k-100k , 19.6% for AGIs over 100k ) Charity contributions deductions: $2,427 (3% of AGI, reported on 53.8% of returns )Here:
3.1% of AGIState:
3.1% of AGI
(% of AGI for various income ranges: 0.8% for AGIs below $10k , 1.6% for AGIs $10k-25k , 2.1% for AGIs $25k-50k , 2.3% for AGIs $50k-75k , 2.5% for AGIs $75k-100k , 2.2% for AGIs over 100k ) Total tax: $7,036 (reported on 80.5% of returns )89143:
$7,036State:
$10,585
(% of AGI for various income ranges: 2.6% for AGIs below $10k , 4.1% for AGIs $10k-25k , 5.7% for AGIs $25k-50k , 7.2% for AGIs $50k-75k , 8.9% for AGIs $75k-100k , 14.6% for AGIs over 100k ) Earned income credit: $1,642 (reported on 10.5% of returns )Percentage of individuals using paid preparers for their 2004 taxes: 55.6%(% for various income ranges: 42.3% for AGIs below $10k , 51.4% for AGIs $10k-25k , 54.9% for AGIs $25k-50k , 59.1% for AGIs $50k-75k , 60.2% for AGIs $75k-100k , 61.9% for AGIs over 100k )
Estimated median household income in 2022: This zip code:
$93,463Nevada:
$72,333
Nearest zip codes: 89131 ,
89149 ,
89129 ,
89130 ,
89085 ,
89134 .
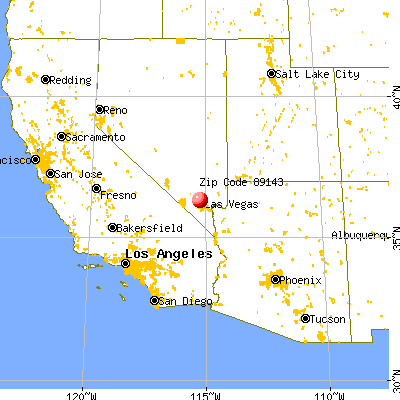
Las Vegas Zip Code Map
Percentage of family households: This zip code:
58.5%Nevada:
45.2%
Percentage of households with unmarried partners: This zip code:
6.9%Nevada:
44.2%
Likely homosexual households (counted as self-reported same-sex unmarried-partner households)
Lesbian couples: 0.2% of all households Gay men: 0.9% of all households
Household received Food Stamps/SNAP in the past 12 months: 357Household did not receive Food Stamps/SNAP in the past 12 months: 3,852
Women who had a birth in the past 12 months: 177 (166 now married , 23 unmarried) Women who did not have a birth in the past 12 months: 3,407 (1,477 now married , 1,926 unmarried)
Housing units in zip code 89143 with a mortgage: 2,562 (159
second mortgage , 21
home equity loan , 69
both second mortgage and home equity loan )
Houses without a mortgage: 9
Median monthly owner costs for units with a mortgage: $1,758
Median monthly owner costs for units without a mortgage: $591
Residents with income below the poverty level in 2022:
This zip code:
9.9%Whole state:
12.5%
Residents with income below 50% of the poverty level in 2022:
This zip code:
6.8%Whole state:
5.9%
Median number of rooms in houses and condos: Median number of rooms in apartments:
Year house built (houses)
0 2020 or later434 2010 to 20192,993 2000 to 2009679 1990 to 1999104 1980 to 198992 1970 to 197930 1960 to 196920 1950 to 19590 1940 to 19490 1939 or earlier
Zip code 89143 household income distribution in 2022 106 Less than $10,00031 $10,000 to $14,99915 $15,000 to $19,99992 $20,000 to $24,99914 $25,000 to $29,99976 $30,000 to $34,999126 $35,000 to $39,999127 $40,000 to $44,999103 $45,000 to $49,999456 $50,000 to $59,999547 $60,000 to $74,999714 $75,000 to $99,999621 $100,000 to $124,999309 $125,000 to $149,999457 $150,000 to $199,999457 $200,000 or moreEstimate of home value of owner-occupied houses/condos in 2022 in zip code 89143 12 Less than $10,00018 $50,000 to $59,99936 $100,000 to $124,9994 $125,000 to $149,9997 $150,000 to $174,99919 $175,000 to $199,99992 $200,000 to $249,999133 $250,000 to $299,9991,022 $300,000 to $399,999815 $400,000 to $499,999838 $500,000 to $749,999218 $750,000 to $999,999103 $1,000,000 to $1,499,999Rent paid by renters in 2022 in zip code 89143 21 $600 to $64943 $800 to $89981 $1,000 to $1,249431 $1,250 to $1,499338 $1,500 to $1,999205 $2,000 to $2,49925 $2,500 to $2,99933 No cash rent
Median gross rent in 2022: $1,830.
Median price asked for vacant for-sale houses and condos in 2022: $411,646.
Estimated median house (or condo) value in 2022 for: White Non-Hispanic householders: $459,892Black or African American householders: $408,456American Indian or Alaska Native householders: $2,647,405Asian householders: $395,749Native Hawaiian and other Pacific Islander householders: $378,200Some other race householders: $432,359Two or more races householders: $416,020Hispanic or Latino householders: $426,912Estimated median house or condo value in 2022: $455,051
89143:
$455,051Nevada:
$434,700
Lower value quartile - upper value quartile: $384,636 - $619,756
Mean price in 2022: Detached houses: $529,145Here:
$529,145State:
$549,327
Townhouses or other attached units: $283,904Here:
$283,904State:
$328,893
In 2-unit structures: $151,247Here:
$151,247State:
$326,466
In 3-to-4-unit structures: $318,398Here:
$318,398State:
$295,216
In 5-or-more-unit structures: $365,637Here:
$365,637State:
$297,847
Mobile homes: $23,867Here:
$23,867State:
$159,995
Housing units in structures:
One, detached: 4,342One, attached: 56Mobile homes: 12Unemployment : 4.5%
Means of transportation to work in zip code 89143 76.2% 4,724 Drove a car alone7.7% 476 Carpooled0.3% 16 Bus or trolley bus0.4% 24 Railroad0.1% 5 Motorcycle0.4% 23 Bicycle2.6% 160 Other means12.1% 752 Worked at homeTravel time to work (commute) in zip code 89143 113 Less than 5 minutes239 5 to 9 minutes438 10 to 14 minutes604 15 to 19 minutes614 20 to 24 minutes722 25 to 29 minutes1,327 30 to 34 minutes178 35 to 39 minutes432 40 to 44 minutes443 45 to 59 minutes194 60 to 89 minutes135 90 or more minutes
Neighborhoods in zip code 89143: Percentage of zip code residents living and working in this county: 96.4%
Household type by relationship:
Households: 13,530
Male householders: 2,447 (497 living alone ), Female householders: 1,779 (364 living alone )2,345 spouses (2,296 opposite-sex spouses ), 323 unmarried partners , (293 opposite-sex unmarried partners ), 5,039 children (4,300 natural , 326 adopted , 415 stepchildren ), 359 grandchildren , 267 brothers or sisters , 302 parents , 13 foster children , 339 other relatives , 305 non-relatives In group quarters: 5 (-1 institutionalized population )
Size of family households: 1,037 2-persons , 806 3-persons , 536 4-persons , 343 5-persons , 245 6-persons , 201 7-or-more-persons
Size of nonfamily households: 861 1-person , 216 2-persons , 2 3-persons
3,135 married couples with children. single-parent households (277 men , 321 women ).
85.8% of residents of 89143 zip code speak English at home. of residents speak Spanish at home (73% very well, 18% well, 9% not well ).of residents speak other Indo-European language at home (92% very well, 8% well ).of residents speak Asian or Pacific Island language at home (85% very well, 11% well, 1% not well, 3% not at all ).of residents speak other language at home (95% very well, 5% well ).
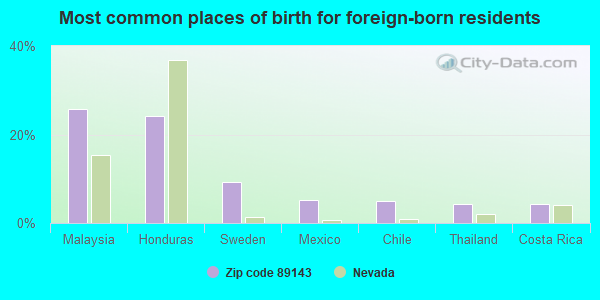
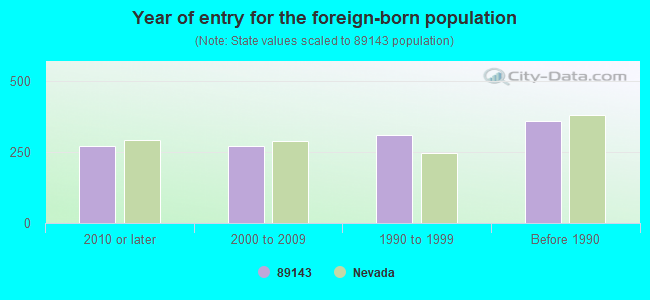
Foreign born population: 1,054 (7.8%)
(74.5%
of them are naturalized citizens )
This zip code:
7.8%Whole state:
18.9%
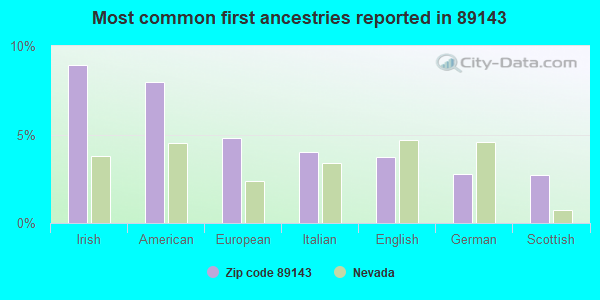
26% Malaysia 24% Honduras 9% Sweden 5% Mexico 5% Chile 4% Thailand 4% Costa Rica 9% Irish 8% American 5% European 4% Italian 4% English 3% German 3% Scottish
Year of entry for the foreign-born population
269 2010 or later 271 2000 to 2009 308 1990 to 1999 357 Before 1990
There are
27 Medical Specialists in Zip Code 89143 .
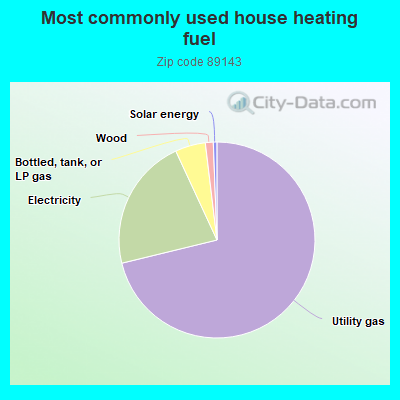
71.2% Utility gas 21.9% Electricity 5.0% Bottled, tank, or LP gas 1.3% Wood 0.6% Solar energy
Place of birth for U.S.-born residents:
This state: 4,427Northeast: 734Midwest: 1,808South: 1,356West: 3,953
8% of the 89143 zip code residents lived in the same house 5 years ago.
Out of people who lived in different houses, 63% lived in this county.
Out of people who lived in different counties, 50% lived in Nevada.
86% of the 89143 zip code residents lived in the same house 1 year ago.
Out of people who lived in different houses, 61% moved from this county.
Out of people who lived in different houses, 38% moved from different state.
Private vs. public school enrollment:
Students in private schools in grades 1 to 8 (elementary and middle school): 106
Students in private schools in grades 9 to 12 (high school): 107
Students in private undergraduate colleges: 81
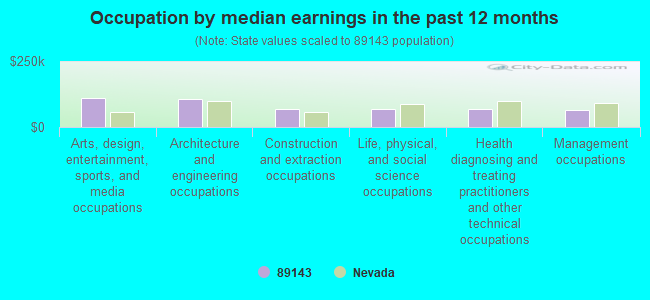
Occupation by median earnings in the past 12 months ($)
111,709 Arts, design, entertainment, sports, and media occupations 105,515 Architecture and engineering occupations 70,101 Construction and extraction occupations 68,442 Life, physical, and social science occupations 67,420 Health diagnosing and treating practitioners and other technical occupations 65,314 Management occupations
Companies with federal contracts located in this zip code:
UNMANNED SYSTEMS INCORPORATED (8416 MYSTIC NIGHT AVE in LAS VEGAS, NV; small business) in 6 contracts from 2003 to 2006
Contracts for Engineering and Technical Services, Operation of Government-Owned Facilities -- Electronic and Communications Facilities, Program Management/Support Services, Technical Representation Services -- Aircraft Launching, Landing, and Ground Handling Equipment by Air ForceSigned by year: 2000: $0; 2001: $0; 2002: $0; 2003: $101,714; 2004: $0; 2005: $915,456; 2006: $1,903,999.
Biggest contracts: with Air Force for Engineering and Technical Services. Signed on 2006-05-12. Completion date: 2006-12-31.
, same as above. Signed on 2005-12-16. Completion date: 2006-05-31.
, same as above. Signed on 2006-03-27. Completion date: 2006-12-31.
with Air Force for Operation of Government-Owned Facilities -- Electronic and Communications Facilities. Signed on 2003-10-01. Completion date: 2003-10-31.
ADVANCED ENVIRONMENTAL SERVICE (8816 EGYPTIAN AVE in LAS VEGAS, NV; small business) in 20 contracts from 2001 to 2005
Contracts for Other Education and Training Services, Program Management/Support Services, Other Management Support Services by NavySigned by year: 2000: $0; 2001: $50,710; 2002: $16,681; 2003: $0; 2004: $51,892; 2005: $217,325; 2006: $0.
Biggest contracts: with Navy for Other Education and Training Services. Taking place in VA. Signed on 2005-06-28. Completion date: 2005-06-28.
with Navy for Program Management/Support Services. Taking place in TX. Signed on 2001-05-24. Completion date: 2001-09-30.
with Navy for Other Management Support Services. Taking place in TX. Signed on 2002-02-15. Completion date: 2002-03-31.
with Navy for Other Education and Training Services. Taking place in VA. Signed on 2005-07-27. Completion date: 2005-07-27.
Top industries in this zip code by the number of employees in 2005:
Construction: Masonry Contractors (20-49 employees: 1 establishment, 5-9 employees: 1 establishment)Administrative and Support and Waste Management and Remediation Services: Janitorial Services (20-49: 1)Administrative and Support and Waste Management and Remediation Services: Landscaping Services (10-19: 1, 5-9: 1, 1-4: 1)Construction: New Multifamily Housing Construction (except Operative Builders) (10-19: 1)Arts, Entertainment, and Recreation: Independent Artists, Writers, and Performers (10-19: 1)Construction: Poured Concrete Foundation and Structure Contractors (10-19: 1)Construction: Plumbing, Heating, and Air-Conditioning Contractors (5-9: 1, 1-4: 1)Construction: Residential Remodelers (5-9: 1)Real Estate and Rental and Leasing: Offices of Real Estate Agents and Brokers (1-4: 3)
Fatal accident statistics in 2012:
Fatal accident count: 1Vehicles involved in fatal accidents: 2Fatal accidents caused by drunken drivers: 0Fatalities: 1Persons involved in fatal accidents: 5Pedestrians involved in fatal accidents: 0
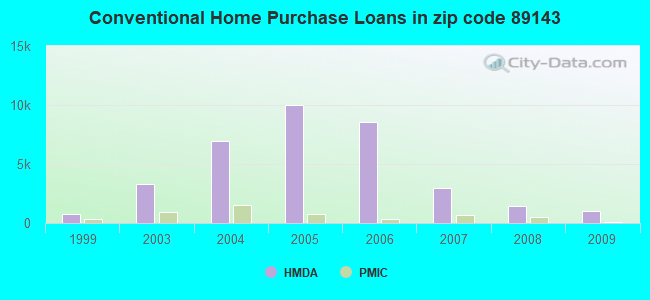
Home Mortgage Disclosure Act Aggregated Statistics For Year 2009(Based on 6 partial tracts) A) FHA, FSA/RHS & VA B) Conventional C) Refinancings D) Home Improvement Loans F) Non-occupant Loans on G) Loans On Manufactured Number Average Value Number Average Value Number Average Value Number Average Value Number Average Value Number Average Value
LOANS ORIGINATED 2,330 $189,112 998 $163,058 1,244 $230,121 24 $97,040 530 $139,972 15 $141,534 APPLICATIONS APPROVED, NOT ACCEPTED 162 $193,412 70 $155,432 122 $243,606 10 $32,246 42 $135,326 1 $109,090 APPLICATIONS DENIED 485 $198,984 223 $187,011 639 $256,128 71 $51,034 173 $159,496 4 $128,025 APPLICATIONS WITHDRAWN 200 $195,005 129 $171,780 328 $235,598 9 $64,699 78 $150,001 3 $144,333 FILES CLOSED FOR INCOMPLETENESS 49 $198,544 20 $168,623 77 $236,700 3 $157,163 16 $130,190 0 $0
Aggregated Statistics For Year 2008(Based on 6 partial tracts) A) FHA, FSA/RHS & VA B) Conventional C) Refinancings D) Home Improvement Loans E) Loans on Dwellings For 5+ Families F) Non-occupant Loans on G) Loans On Manufactured Number Average Value Number Average Value Number Average Value Number Average Value Number Average Value Number Average Value Number Average Value
LOANS ORIGINATED 1,733 $238,130 1,403 $227,425 694 $245,643 57 $78,143 1 $148,700 483 $196,175 6 $215,253 APPLICATIONS APPROVED, NOT ACCEPTED 106 $241,974 188 $252,144 164 $279,170 47 $42,328 0 $0 80 $216,204 6 $93,510 APPLICATIONS DENIED 367 $243,396 378 $246,970 1,002 $291,943 179 $77,226 0 $0 225 $238,083 8 $147,329 APPLICATIONS WITHDRAWN 157 $242,948 255 $252,462 352 $276,395 15 $160,791 0 $0 104 $220,252 1 $144,780 FILES CLOSED FOR INCOMPLETENESS 29 $224,761 29 $269,834 71 $287,674 4 $306,085 0 $0 12 $252,561 0 $0
Aggregated Statistics For Year 2007(Based on 6 partial tracts) A) FHA, FSA/RHS & VA B) Conventional C) Refinancings D) Home Improvement Loans F) Non-occupant Loans on G) Loans On Manufactured Number Average Value Number Average Value Number Average Value Number Average Value Number Average Value Number Average Value
LOANS ORIGINATED 240 $280,822 2,965 $249,312 2,204 $270,616 362 $87,306 855 $238,362 8 $153,719 APPLICATIONS APPROVED, NOT ACCEPTED 15 $288,801 613 $275,415 696 $286,382 196 $84,970 233 $257,004 1 $101,010 APPLICATIONS DENIED 32 $264,821 1,241 $309,078 2,794 $294,539 369 $96,276 552 $274,979 5 $257,948 APPLICATIONS WITHDRAWN 27 $300,823 640 $258,419 995 $296,187 65 $166,239 254 $274,167 3 $116,100 FILES CLOSED FOR INCOMPLETENESS 0 $0 92 $285,475 359 $320,410 22 $191,640 37 $237,177 0 $0
Aggregated Statistics For Year 2006(Based on 6 partial tracts) A) FHA, FSA/RHS & VA B) Conventional C) Refinancings D) Home Improvement Loans F) Non-occupant Loans on G) Loans On Manufactured Number Average Value Number Average Value Number Average Value Number Average Value Number Average Value Number Average Value
LOANS ORIGINATED 144 $306,430 8,584 $229,918 3,496 $263,205 487 $97,943 2,045 $230,185 19 $188,317 APPLICATIONS APPROVED, NOT ACCEPTED 11 $285,892 1,428 $233,765 887 $264,663 201 $84,032 395 $227,611 5 $82,114 APPLICATIONS DENIED 23 $290,596 2,102 $262,885 2,410 $294,191 422 $101,849 642 $273,048 5 $183,910 APPLICATIONS WITHDRAWN 15 $294,640 1,685 $255,923 1,648 $285,186 82 $159,431 473 $260,219 3 $233,160 FILES CLOSED FOR INCOMPLETENESS 2 $281,175 162 $241,310 369 $286,768 15 $97,125 61 $257,322 0 $0
Aggregated Statistics For Year 2005(Based on 6 partial tracts) A) FHA, FSA/RHS & VA B) Conventional C) Refinancings D) Home Improvement Loans F) Non-occupant Loans on G) Loans On Manufactured Number Average Value Number Average Value Number Average Value Number Average Value Number Average Value Number Average Value
LOANS ORIGINATED 103 $262,009 9,967 $235,194 3,935 $267,600 529 $129,490 2,933 $227,805 23 $123,021 APPLICATIONS APPROVED, NOT ACCEPTED 6 $194,098 1,333 $231,547 641 $263,108 135 $101,075 364 $216,105 7 $86,394 APPLICATIONS DENIED 13 $262,110 2,172 $260,170 1,817 $286,454 399 $102,917 769 $259,852 12 $104,475 APPLICATIONS WITHDRAWN 12 $260,076 1,772 $261,934 1,445 $268,181 154 $221,146 465 $248,266 7 $160,870 FILES CLOSED FOR INCOMPLETENESS 0 $0 462 $257,580 259 $282,776 20 $77,675 125 $267,951 1 $131,990
Aggregated Statistics For Year 2004(Based on 6 partial tracts) A) FHA, FSA/RHS & VA B) Conventional C) Refinancings D) Home Improvement Loans F) Non-occupant Loans on G) Loans On Manufactured Number Average Value Number Average Value Number Average Value Number Average Value Number Average Value Number Average Value
LOANS ORIGINATED 227 $205,805 6,962 $215,761 3,225 $239,358 410 $102,478 2,130 $209,577 15 $93,495 APPLICATIONS APPROVED, NOT ACCEPTED 9 $204,248 806 $213,053 444 $235,051 85 $71,272 215 $221,979 4 $73,165 APPLICATIONS DENIED 15 $202,082 1,100 $230,316 1,097 $231,211 362 $70,169 329 $222,721 9 $67,906 APPLICATIONS WITHDRAWN 19 $194,803 1,319 $249,467 812 $230,928 104 $84,717 325 $240,825 2 $111,450 FILES CLOSED FOR INCOMPLETENESS 1 $241,520 226 $245,086 185 $252,785 30 $92,058 66 $221,382 0 $0
Aggregated Statistics For Year 2003(Based on 6 partial tracts) A) FHA, FSA/RHS & VA B) Conventional C) Refinancings D) Home Improvement Loans E) Loans on Dwellings For 5+ Families F) Non-occupant Loans on Number Average Value Number Average Value Number Average Value Number Average Value Number Average Value Number Average Value
LOANS ORIGINATED 505 $180,617 3,337 $181,479 2,454 $179,706 178 $33,022 0 $0 780 $182,654 APPLICATIONS APPROVED, NOT ACCEPTED 12 $181,768 280 $166,481 389 $183,718 51 $33,009 0 $0 61 $140,053 APPLICATIONS DENIED 40 $173,749 355 $183,809 802 $156,085 215 $33,224 2 $34,740 74 $161,876 APPLICATIONS WITHDRAWN 52 $183,838 664 $179,946 614 $173,902 35 $29,260 0 $0 100 $171,385 FILES CLOSED FOR INCOMPLETENESS 8 $166,921 69 $173,203 104 $211,829 18 $39,162 0 $0 12 $173,866
Aggregated Statistics For Year 1999(Based on 3 partial tracts) A) FHA, FSA/RHS & VA B) Conventional C) Refinancings D) Home Improvement Loans E) Loans on Dwellings For 5+ Families F) Non-occupant Loans on Number Average Value Number Average Value Number Average Value Number Average Value Number Average Value Number Average Value
LOANS ORIGINATED 850 $122,761 798 $118,182 629 $111,208 265 $24,626 1 $1,646,210 122 $98,734 APPLICATIONS APPROVED, NOT ACCEPTED 36 $118,052 99 $115,574 149 $96,613 134 $23,840 0 $0 15 $95,639 APPLICATIONS DENIED 114 $122,563 194 $110,998 395 $95,765 294 $23,006 1 $66,340 23 $108,386 APPLICATIONS WITHDRAWN 86 $122,083 138 $128,861 232 $104,214 26 $21,770 0 $0 19 $100,339 FILES CLOSED FOR INCOMPLETENESS 14 $116,211 26 $124,430 69 $105,685 6 $32,920 0 $0 5 $118,280
Detailed HMDA statistics for the following Tracts:
0033.02
,
0036.03 ,
0059.02
Private Mortgage Insurance Companies Aggregated Statistics For Year 2009(Based on 6 partial tracts) A) Conventional B) Refinancings C) Non-occupant Loans on Number Average Value Number Average Value Number Average Value
LOANS ORIGINATED 123 $213,207 27 $293,094 21 $183,883 APPLICATIONS APPROVED, NOT ACCEPTED 58 $222,184 14 $275,620 10 $200,846 APPLICATIONS DENIED 26 $226,607 13 $251,975 5 $226,454 APPLICATIONS WITHDRAWN 13 $214,209 7 $211,210 0 $0 FILES CLOSED FOR INCOMPLETENESS 11 $243,210 2 $225,455 3 $210,773
Aggregated Statistics For Year 2008(Based on 6 partial tracts) A) Conventional B) Refinancings C) Non-occupant Loans on Number Average Value Number Average Value Number Average Value
LOANS ORIGINATED 499 $263,079 87 $273,407 98 $224,702 APPLICATIONS APPROVED, NOT ACCEPTED 221 $289,086 116 $311,777 70 $260,542 APPLICATIONS DENIED 70 $254,646 6 $341,008 34 $237,459 APPLICATIONS WITHDRAWN 32 $302,592 15 $285,620 13 $246,898 FILES CLOSED FOR INCOMPLETENESS 25 $278,353 6 $290,072 11 $255,197
Aggregated Statistics For Year 2007(Based on 6 partial tracts) A) Conventional B) Refinancings C) Non-occupant Loans on Number Average Value Number Average Value Number Average Value
LOANS ORIGINATED 643 $304,075 280 $329,758 118 $293,567 APPLICATIONS APPROVED, NOT ACCEPTED 86 $326,274 108 $363,578 24 $302,203 APPLICATIONS DENIED 39 $362,166 23 $410,619 24 $347,452 APPLICATIONS WITHDRAWN 44 $322,368 24 $350,610 11 $357,649 FILES CLOSED FOR INCOMPLETENESS 8 $419,844 0 $0 3 $410,493
Aggregated Statistics For Year 2006(Based on 4 partial tracts) A) Conventional B) Refinancings C) Non-occupant Loans on Number Average Value Number Average Value Number Average Value
LOANS ORIGINATED 362 $324,101 177 $349,751 90 $301,951 APPLICATIONS APPROVED, NOT ACCEPTED 70 $366,475 59 $343,868 20 $311,576 APPLICATIONS DENIED 8 $395,504 7 $595,999 4 $547,998 APPLICATIONS WITHDRAWN 25 $357,116 21 $354,488 11 $304,370 FILES CLOSED FOR INCOMPLETENESS 1 $397,390 4 $448,460 0 $0
Aggregated Statistics For Year 2005(Based on 6 partial tracts) A) Conventional B) Refinancings C) Non-occupant Loans on Number Average Value Number Average Value Number Average Value
LOANS ORIGINATED 743 $295,144 138 $314,424 237 $282,626 APPLICATIONS APPROVED, NOT ACCEPTED 155 $291,154 21 $311,404 49 $256,371 APPLICATIONS DENIED 9 $375,737 8 $400,114 3 $204,873 APPLICATIONS WITHDRAWN 55 $276,415 15 $285,007 25 $263,996 FILES CLOSED FOR INCOMPLETENESS 14 $287,984 1 $220,790 2 $422,995
Aggregated Statistics For Year 2004(Based on 6 partial tracts) A) Conventional B) Refinancings C) Non-occupant Loans on D) Loans On Manufactured Number Average Value Number Average Value Number Average Value Number Average Value
LOANS ORIGINATED 1,496 $245,534 126 $247,490 466 $232,267 0 $0 APPLICATIONS APPROVED, NOT ACCEPTED 321 $238,331 59 $227,584 75 $233,218 1 $156,810 APPLICATIONS DENIED 29 $280,111 5 $342,384 7 $247,831 0 $0 APPLICATIONS WITHDRAWN 76 $259,245 17 $212,044 19 $238,591 0 $0 FILES CLOSED FOR INCOMPLETENESS 6 $179,767 1 $390,080 1 $134,280 0 $0
Aggregated Statistics For Year 2003(Based on 6 partial tracts) A) Conventional B) Refinancings C) Non-occupant Loans on Number Average Value Number Average Value Number Average Value
LOANS ORIGINATED 906 $205,332 409 $191,908 180 $176,470 APPLICATIONS APPROVED, NOT ACCEPTED 141 $207,913 105 $222,643 21 $178,391 APPLICATIONS DENIED 9 $276,036 6 $166,322 2 $410,195 APPLICATIONS WITHDRAWN 23 $205,387 11 $166,823 7 $185,289 FILES CLOSED FOR INCOMPLETENESS 1 $452,250 1 $321,820 0 $0
Aggregated Statistics For Year 1999(Based on 3 partial tracts) A) Conventional B) Refinancings C) Non-occupant Loans on Number Average Value Number Average Value Number Average Value
LOANS ORIGINATED 360 $136,275 123 $128,710 28 $114,086 APPLICATIONS APPROVED, NOT ACCEPTED 35 $136,537 27 $128,895 4 $127,368 APPLICATIONS DENIED 18 $136,556 8 $138,389 0 $0 APPLICATIONS WITHDRAWN 16 $141,749 8 $134,689 2 $82,585 FILES CLOSED FOR INCOMPLETENESS 7 $132,020 2 $122,960 0 $0
Detailed PMIC statistics for the following Tracts:
0033.02
,
0036.03 ,
0059.02
2002 - 2018 National Fire Incident Reporting System (NFIRS) incidents See full 2006 National Fire Incident Reporting System statistics for zip code 89143, Nevada
Most common first names in zip code 89143 among deceased individuals Name Count Lived (average)
Mary 6 80.0 years Robert 6 71.6 years Richard 4 70.7 years Helen 3 81.0 years David 3 65.3 years Dorothy 3 89.3 years Lois 3 80.0 years Michael 3 61.3 years Gloria 2 74.1 years Albert 2 77.5 years
Most common last names in zip code 89143 among deceased individuals Last name Count Lived (average)
Kish 2 72.0 years Benvenuto 2 57.6 years James 2 69.5 years Griffis 2 67.5 years Alcorn 2 80.0 years Natiello 2 86.9 years Phillips 2 68.5 years Plutowski 2 68.5 years Schlepitz 2 63.5 years Torres 2 82.5 years
Businesses in zip code 89143


 Nearest zip codes: 89131, 89149, 89129, 89130, 89085, 89134.
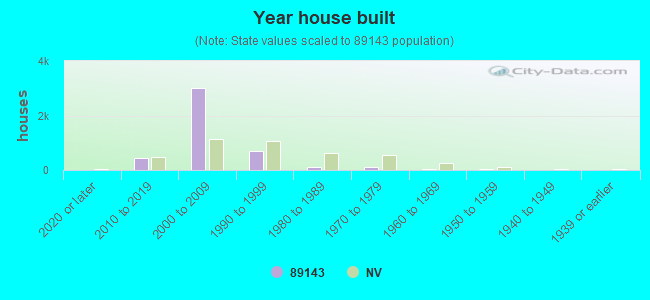


 : $2,921,169 in 6 contracts from 2003 to 2006
 Based on the data from the years 2002 - 2018 the average number of fire incidents per year is 15. The highest number of fires - 31 took place in 2008, and the least - 0 in 2003. The data has a growing trend.
 When looking into fire subcategories, the most incidents belonged to: Outside Fires (51.0%), and Mobile Property/Vehicle Fires (21.6%).