Estimated zip code population in 2022: 1,876 Zip code population in 2010: 1,578 Zip code population in 2000: 1,402
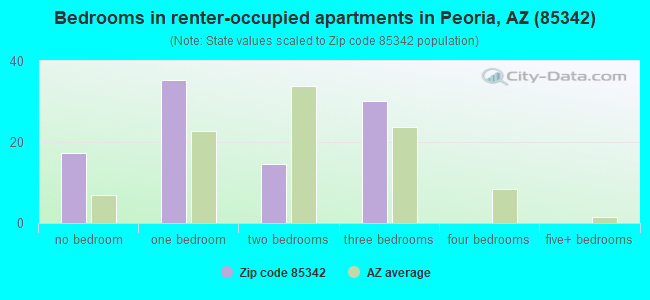
Houses and condos: 1,033 Renter-occupied apartments: 96
% of renters here:
11%
State:
33%
March 2022 cost of living index in zip code 85342: 84.5 (less than average, U.S. average is 100)
Land area: 467.6 sq. mi. Water area: 2.0 sq. mi.
Population density: 4 people per square mile
(very low).
OSM Map
General Map
Google Map
MSN Map
OSM Map
General Map
Google Map
MSN Map
OSM Map
General Map
Google Map
MSN Map
OSM Map
General Map
Google Map
MSN Map
Please wait while loading the map...
Real estate property taxes paid for housing units in 2022:
This zip code:
0.4% ($1,180)
Arizona:
0.4% ($1,786)
Median real estate property taxes paid for housing units with mortgages in 2022: $1,272 (0.4%) Median real estate property taxes paid for housing units with no mortgage in 2022: $858 (0.4%)
Business Search- 14 Million verified businesses
Males: 916
(48.8%)
Females: 960
(51.2%)
For population 25 years and over in 85342:
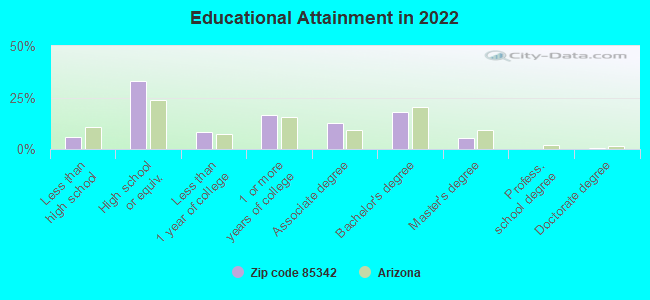
High school or higher: 94.2%
Bachelor's degree or higher: 23.5%
Graduate or professional degree: 5.8%
Unemployed: 1.3%
Mean travel time to work (commute): 40.2 minutes
For population 15 years and over in 85342:
Never married: 13.9%
Now married: 61.8%
Separated: 2.3%
Widowed: 6.6%
Divorced: 15.4%
Zip code 85342 compared to state average:
Unemployed percentage significantly below state average.
Black race population percentage significantly below state average.
Hispanic race population percentage significantly below state average.
Median age significantly above state average.
Foreign-born population percentage significantly below state average.
Renting percentage significantly below state average.
Length of stay since moving in significantly above state average.
Averages for the 2020 tax year for zip code 85342, filed in 2021:
Average Adjusted Gross Income (AGI) in 2020: $58,092 (Individual Income Tax Returns)
Here:
$58,092
State:
$73,499
Salary/wage: $49,691 (reported on 74.6% of returns)
Here:
$49,691
State:
$59,499
(% of AGI for various income ranges: 1208.0% for AGIs below $25k, 3898.0% for AGIs $25k-50k, 5528.8% for AGIs $50k-75k, 10076.7% for AGIs $75k-100k, 22462.0% for AGIs $100k-200k)
Taxable interest for individuals: $1,278 (reported on 25.4% of returns)
This zip code:
$1,278
Arizona:
$2,325
(% of AGI for various income ranges: 10.0% for AGIs below $25k, 18.7% for AGIs $25k-50k, 51.2% for AGIs $50k-75k, 292.0% for AGIs $100k-200k)
Ordinary dividends: $3,111 (reported on 12.7% of returns)
Here:
$3,111
State:
$8,711
(% of AGI for various income ranges: 22.7% for AGIs below $25k, 46.2% for AGIs $50k-75k, 418.0% for AGIs $100k-200k)
Net capital gain/loss in AGI: +$18,740 (reported on 14.1% of returns)
Here:
+$18,740
State:
+$31,332
(% of AGI for various income ranges: 20.0% for AGIs $50k-75k, 3730.0% for AGIs $100k-200k)
Profit/loss from business: +$2,445 (reported on 15.5% of returns)
Here:
+$2,445
State:
+$13,214
(% of AGI for various income ranges: 128.0% for AGIs below $25k, 66.0% for AGIs $25k-50k, 20.0% for AGIs $100k-200k)
Taxable individual retirement arrangement distribution: $16,543 (reported on 9.9% of returns)
85342:
$16,543
Arizona:
$23,364
(% of AGI for various income ranges: 199.3% for AGIs $25k-50k, 2863.3% for AGIs $75k-100k)
Total itemized deductions: $29,025 (reported on 5.6% of returns)
Here:
$29,025
State:
$36,308
(% of AGI for various income ranges: 2322.0% for AGIs $100k-200k)
Charity contributions: $7,800 (reported on 2.8% of returns)
Here:
$7,800
State:
$11,955
(% of AGI for various income ranges: 104.0% for AGIs $25k-50k)
Taxes paid: $5,475 (reported on 5.6% of returns)
85342:
$5,475
State:
$6,820
(% of AGI for various income ranges: 438.0% for AGIs $100k-200k)
Earned income credit: $2,070 (reported on 14.1% of returns)
Here:
$2,070
State:
$2,383
(% of AGI for various income ranges: 77.3% for AGIs below $25k, 60.7% for AGIs $25k-50k)
Percentage of individuals using paid preparers for their 2020 taxes: 91.5%
Here:
92%
State:
93%
(% for various income ranges: 87.0% for AGIs below $25k, 95.2% for AGIs $25k-50k, 90.9% for AGIs $50k-75k, 100.0% for AGIs $75k-100k, 88.9% for AGIs $100k-200k, 100.0% for AGIs over 200k)
Averages for the 2012 tax year for zip code 85342, filed in 2013:
Average Adjusted Gross Income (AGI) in 2012: $49,270 (Individual Income Tax Returns)
Here:
$49,270
State:
$57,644
Salary/wage: $43,859 (reported on 74.0% of returns)
Here:
$43,859
State:
$47,932
(% of AGI for various income ranges: 67.0% for AGIs below $25k, 62.1% for AGIs $25k-50k, 67.9% for AGIs $50k-75k, 76.3% for AGIs $75k-100k, 62.0% for AGIs $100k-200k)
Taxable interest for individuals: $1,056 (reported on 32.0% of returns)
This zip code:
$1,056
Arizona:
$2,064
(% of AGI for various income ranges: 2.2% for AGIs below $25k, 1.5% for AGIs $25k-50k, 0.3% for AGIs $50k-75k, 0.4% for AGIs $100k-200k)
Ordinary dividends: $2,167 (reported on 18.0% of returns)
Here:
$2,167
State:
$7,268
(% of AGI for various income ranges: 4.8% for AGIs below $25k, 0.7% for AGIs $50k-75k, 0.5% for AGIs $100k-200k)
Net capital gain/loss in AGI: +$614 (reported on 14.0% of returns)
Here:
+$614
State:
+$15,530
Profit/loss from business: +$7,390 (reported on 20.0% of returns)
Here:
+$7,390
State:
+$12,323
(% of AGI for various income ranges: 6.6% for AGIs below $25k, 6.9% for AGIs $25k-50k, 6.6% for AGIs $75k-100k)
Taxable individual retirement arrangement distribution: $12,233 (reported on 12.0% of returns)
85342:
$12,233
Arizona:
$18,280
Total itemized deductions: $19,794 (26% of AGI, reported on 36.0% of returns)
Here:
$19,794
State:
$23,651
Here:
26.0% of AGI
State:
20.6% of AGI
(% of AGI for various income ranges: 20.7% for AGIs $25k-50k, 15.6% for AGIs $50k-75k, 13.8% for AGIs $75k-100k, 15.2% for AGIs $100k-200k)
Charity contributions: $2,793 (reported on 28.0% of returns)
Here:
$2,793
State:
$4,114
(% of AGI for various income ranges: 1.6% for AGIs $25k-50k, 2.0% for AGIs $50k-75k, 1.7% for AGIs $75k-100k, 1.8% for AGIs $100k-200k)
Taxes paid: $4,333 (reported on 36.0% of returns)
85342:
$4,333
State:
$6,509
(% of AGI for various income ranges: 3.7% for AGIs $25k-50k, 3.2% for AGIs $50k-75k, 3.3% for AGIs $75k-100k, 3.7% for AGIs $100k-200k)
Earned income credit: $1,978 (reported on 18.0% of returns)
Here:
$1,978
State:
$2,432
(% of AGI for various income ranges: 5.2% for AGIs below $25k, 1.0% for AGIs $25k-50k)
Percentage of individuals using paid preparers for their 2012 taxes: 58.0%
Here:
58%
State:
52%
(% for various income ranges: 50.0% for AGIs below $25k, 58.3% for AGIs $25k-50k, 57.1% for AGIs $50k-75k, 60.0% for AGIs $75k-100k, 83.3% for AGIs $100k-200k)
Averages for the 2004 tax year for zip code 85342, filed in 2005:
Average Adjusted Gross Income (AGI) in 2004: $40,624 (Individual Income Tax Returns)
Here:
$40,624
State:
$50,097
Salary/wage: $35,355 (reported on 75.7% of returns)
Here:
$35,355
State:
$42,146
(% of AGI for various income ranges: 87.1% for AGIs below $10k, 58.4% for AGIs $10k-25k, 79.2% for AGIs $25k-50k, 72.2% for AGIs $50k-75k, 81.9% for AGIs $75k-100k, 41.1% for AGIs over 100k)
Taxable interest for individuals: $1,914 (reported on 44.3% of returns)
This zip code:
$1,914
Arizona:
$2,374
(% of AGI for various income ranges: 11.4% for AGIs below $10k, 4.0% for AGIs $10k-25k, 1.6% for AGIs $25k-50k, 1.8% for AGIs $50k-75k, 0.3% for AGIs $75k-100k, 2.2% for AGIs over 100k)
Taxable dividends: $1,387 (reported on 22.5% of returns)
Here:
$1,387
State:
$3,888
(% of AGI for various income ranges: 3.6% for AGIs below $10k, 3.7% for AGIs $10k-25k, 0.8% for AGIs $25k-50k, 0.3% for AGIs $50k-75k, 0.1% for AGIs over 100k)
Net capital gain/loss: +$9,216 (reported on 20.1% of returns)
Here:
+$9,216
State:
+$17,569
(% of AGI for various income ranges: -0.4% for AGIs $10k-25k, 1.7% for AGIs $25k-50k, 0.6% for AGIs $50k-75k, 15.6% for AGIs over 100k)
Profit/loss from business: +$4,359 (reported on 18.7% of returns)
Here:
+$4,359
State:
+$11,088
(% of AGI for various income ranges: -9.4% for AGIs below $10k, 12.4% for AGIs $10k-25k, 1.9% for AGIs $25k-50k, 1.8% for AGIs $50k-75k)
Total itemized deductions: $17,102 (26% of AGI, reported on 37.4% of returns)
Here:
$17,102
State:
$19,781
Here:
26.3% of AGI
State:
21.8% of AGI
(% of AGI for various income ranges: 20.0% for AGIs $10k-25k, 16.8% for AGIs $25k-50k, 16.7% for AGIs $50k-75k, 18.3% for AGIs $75k-100k, 12.1% for AGIs over 100k)
Charity contributions deductions: $2,207 (3% of AGI, reported on 30.7% of returns)
Here:
$2,207
State:
$3,389
Here:
3.2% of AGI
State:
3.5% of AGI
(% of AGI for various income ranges: 1.9% for AGIs $10k-25k, 1.4% for AGIs $25k-50k, 1.8% for AGIs $50k-75k, 2.6% for AGIs $75k-100k, 1.4% for AGIs over 100k)
Total tax: $5,163 (reported on 73.7% of returns)
85342:
$5,163
State:
$8,323
(% of AGI for various income ranges: 3.4% for AGIs below $10k, 4.5% for AGIs $10k-25k, 6.2% for AGIs $25k-50k, 8.5% for AGIs $50k-75k, 9.1% for AGIs $75k-100k, 15.6% for AGIs over 100k)
Earned income credit: $1,545 (reported on 18.0% of returns)
Here:
$1,545
State:
$1,786
Percentage of individuals using paid preparers for their 2004 taxes: 62.8%
Here:
63%
State:
60%
(% for various income ranges: 49.1% for AGIs below $10k, 60.7% for AGIs $10k-25k, 65.5% for AGIs $25k-50k, 76.1% for AGIs $50k-75k, 60.6% for AGIs $75k-100k, 72.2% for AGIs over 100k)
Household received Food Stamps/SNAP in the past 12 months: 125 Household did not receive Food Stamps/SNAP in the past 12 months: 780
Women who had a birth in the past 12 months: 4 (4 now married, 0 unmarried) Women who did not have a birth in the past 12 months: 245 (106 now married, 138 unmarried)
Housing units in zip code 85342 with a mortgage: 473 (35 second mortgage, 32 both second mortgage and home equity loan) Median monthly owner costs for units with a mortgage: $1,566 Median monthly owner costs for units without a mortgage: $296
Residents with income below the poverty level in 2022:
This zip code:
11.1%
Whole state:
12.5%
Residents with income below 50% of the poverty level in 2022:
This zip code:
3.5%
Whole state:
6.0%
Median number of rooms in houses and condos:
Here:
5.9
State:
6.0
Median number of rooms in apartments:
Here:
3.6
State:
4.1
Notable locations in this zip code not listed on our city pages
Notable locations in zip code 85342: Green Tank Windmill (A), Miller Windmill (B), Bog Ranch (C), Champie Ranch (D), Smith Mill (E), Cottonwood Windmill (F), Milk Ranch (G), Eleven L Ranch (H), English Camp (I), Circle City Community Hall (J), Allah Railroad Station (K), Castle Hot Springs Station (L), Circle City - Morristown Volunteer Fire Department (M). Display/hide their locations on the map
Reservoirs: Grandview Tank (A), Horse Creek Tank (B), Layton Tank (C), Mormon Tank (D), Mud Tank (E), Packer Tank (F), Lake Pleasant (G), Ramon Tank (H). Display/hide their locations on the map
Streams, rivers, and creeks: Black Butte Wash (A), Dry Wash (B), Coles Wash (C), Sand Creek (D), Golden Aster Creek (E), San Domingo Wash (F), Buckhorn Creek (G), Monarch Wash (H), Ruby Wash (I). Display/hide their locations on the map
Size of family households: 430 2-persons, 73 3-persons, 58 4-persons, 9 5-persons, 6 6-persons, 5 7-or-more-persons
Size of nonfamily households: 200 1-person, 124 2-persons
108 married couples with children.
36 single-parent households (11 men, 25 women).
94.8% of residents of 85342 zip code speak English at home.
4.0% of residents speak Spanish at home (59% very well, 30% well, 11% not well).
1.6% of residents speak other Indo-European language at home (97% very well, 3% well).
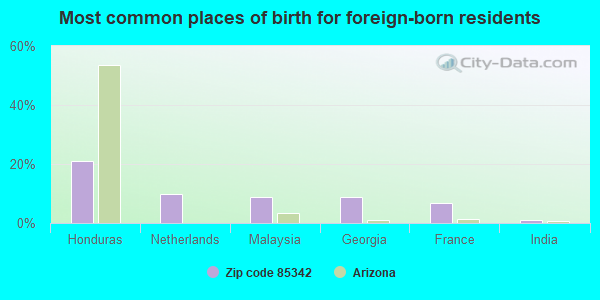
Foreign born population: 93 (5.0%) (86.3% of them are naturalized citizens)
This zip code:
5.0%
Whole state:
13.1%
21%Honduras
10%Netherlands
9%Malaysia
9%Georgia
7%France
1%India
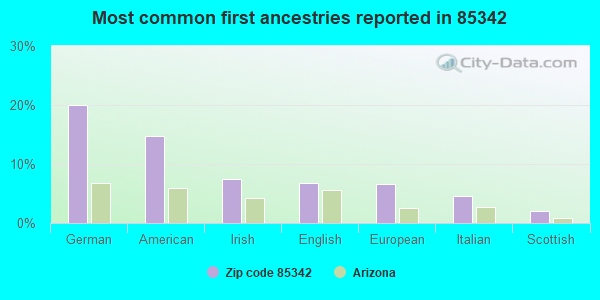
20%German
15%American
7%Irish
7%English
7%European
5%Italian
2%Scottish
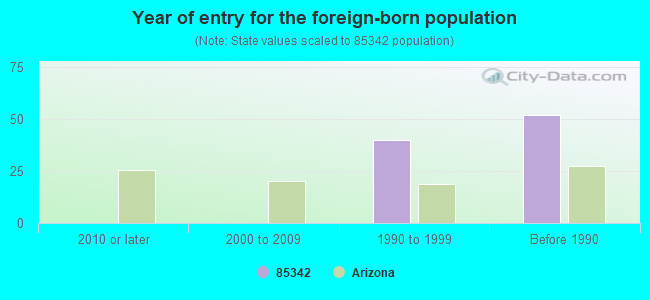
Year of entry for the foreign-born population
02010 or later
02000 to 2009
401990 to 1999
52Before 1990
Facilities with environmental interests located in this zip code:
A T AND T CO MORRISTOWN (11 MI N E OF in MORRISTOWN, AZ)
(Resource Conservation and Recovery Act (tracking hazardous waste)) Organizations: AMERICAN TELEPHONE AND TELEGRAPH COMPANY (CONTACT/OWNER)
CACTUS RANCH TRAILER COURT (42002 NORTHWEST GRAND AVENUE in MORRISTOWN, AZ)
FORMAL ENFORCEMENT ACTION (Integrated Compliance Information System)
Housing units lacking complete plumbing facilities: 3.7% Housing units lacking complete kitchen facilities: 3.6%
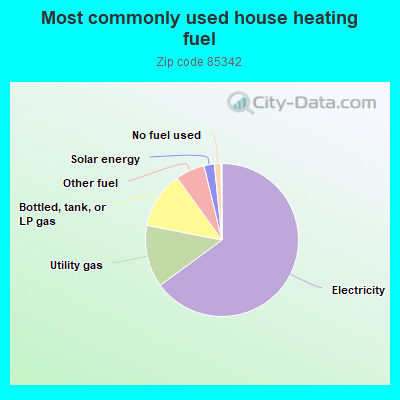
65.2%Electricity
13.2%Utility gas
12.0%Bottled, tank, or LP gas
6.2%Other fuel
2.2%Solar energy
1.4%No fuel used
Population in 1990: 2,878.
Place of birth for U.S.-born residents:
This state: 644
Northeast: 155
Midwest: 467
South: 112
West: 393
43% of the 85342 zip code residents lived in the same house 5 years ago. Out of people who lived in different houses, 53% lived in this county. Out of people who lived in different counties, 50% lived in Arizona.
94% of the 85342 zip code residents lived in the same house 1 year ago. Out of people who lived in different houses, 96% moved from this county. Out of people who lived in different houses, 8% moved from different state.
Private vs. public school enrollment:
Students in private schools in grades 1 to 8 (elementary and middle school): 17
Here:
16.7%
Arizona:
10.4%
Students in private schools in grades 9 to 12 (high school):
Here:
0.0%
Arizona:
8.8%
Students in private undergraduate colleges: 14
Here:
25.3%
Arizona:
13.1%
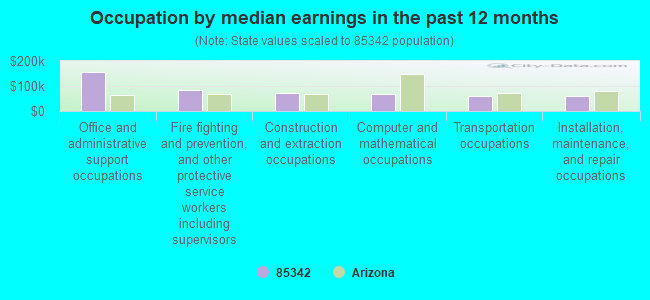
Occupation by median earnings in the past 12 months ($)
154,898Office and administrative support occupations
85,146Fire fighting and prevention, and other protective service workers including supervisors
72,927Construction and extraction occupations
67,223Computer and mathematical occupations
60,637Transportation occupations
58,610Installation, maintenance, and repair occupations
Companies with federal contracts located in this zip code:
PATTERSON, MICHAEL (40917 N 255TH AVE in MORRISTOWN, AZ; small business) : $396,481 in 8 contractsfrom 2001 to 2005
Contracts for Engineering and Technical Services, ADP Facility Operation and Maintenance Services, Other Professional Services by Air Force, Federal Technology Service Signed by year:2000: $0; 2001: $59,000; 2002: $87,085; 2003: $83,142; 2004: $82,383; 2005: $84,871; 2006: $0.
Biggest contracts:
$84,871 with Air Force for Engineering and Technical Services. Signed on 2005-10-01. Completion date: 2006-09-30.
$83,110 with Federal Technology Service for ADP Facility Operation and Maintenance Services. Signed on 2002-10-31. Completion date: 2003-09-30.
$82,383 with Air Force for Other Professional Services. Signed on 2004-10-01. Completion date: 2005-09-30.
$79,992, same as above.Signed on 2003-10-01. Completion date: 2008-09-30.
Top industries in this zip code by the number of employees in 2005:
Accommodation and Food Services: Limited-Service Restaurants (50-99 employees: 1 establishment)
Construction: Other Building Equipment Contractors (20-49: 1)
Construction: Drywall and Insulation Contractors (5-9: 1, 1-4: 1)
Construction: Plumbing, Heating, and Air-Conditioning Contractors (5-9: 1)
Construction: Water and Sewer Line and Related Structures Construction (5-9: 1)
Administrative and Support and Waste Management and Remediation Services: Septic Tank and Related Services (1-4: 2)
Real Estate and Rental and Leasing: Offices of Real Estate Agents and Brokers (1-4: 2)
Fatal accident statistics in 2013:
Fatal accident count: 4
Vehicles involved in fatal accidents: 7
Fatal accidents caused by drunken drivers: 0
Fatalities: 4
Persons involved in fatal accidents: 16
Pedestrians involved in fatal accidents: 0
Fatal accident statistics in 2012:
Fatal accident count: 3
Vehicles involved in fatal accidents: 4
Fatal accidents caused by drunken drivers: 0
Fatalities: 3
Persons involved in fatal accidents: 6
Pedestrians involved in fatal accidents: 0
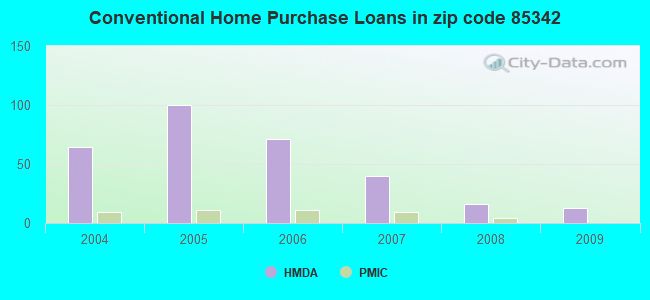
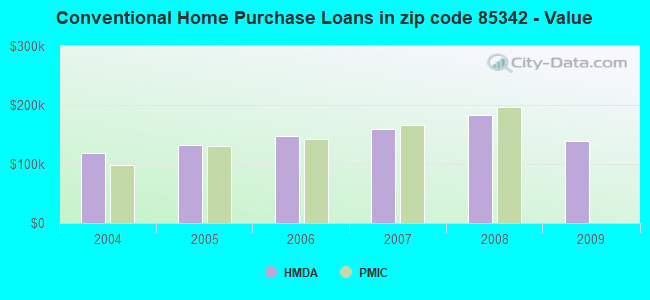
Home Mortgage Disclosure Act Aggregated Statistics For Year 2009 (Based on 2 partial tracts)
A) FHA, FSA/RHS & VA Home Purchase Loans
B) Conventional Home Purchase Loans
C) Refinancings
D) Home Improvement Loans
F) Non-occupant Loans on < 5 Family Dwellings (A B C & D)
G) Loans On Manufactured Home Dwelling (A B C & D)
Number
Average Value
Number
Average Value
Number
Average Value
Number
Average Value
Number
Average Value
Number
Average Value
LOANS ORIGINATED
11
$123,036
13
$139,037
65
$164,234
1
$226,330
12
$164,732
17
$102,281
APPLICATIONS APPROVED, NOT ACCEPTED
1
$69,420
1
$267,420
7
$147,651
0
$0
1
$138,490
2
$89,965
APPLICATIONS DENIED
1
$173,200
8
$110,421
43
$165,378
5
$45,904
8
$148,454
14
$82,250
APPLICATIONS WITHDRAWN
3
$149,353
2
$128,575
12
$172,702
1
$61,280
2
$84,475
5
$104,206
FILES CLOSED FOR INCOMPLETENESS
0
$0
0
$0
4
$178,075
0
$0
0
$0
1
$55,610
Aggregated Statistics For Year 2008 (Based on 2 partial tracts)
A) FHA, FSA/RHS & VA Home Purchase Loans
B) Conventional Home Purchase Loans
C) Refinancings
D) Home Improvement Loans
F) Non-occupant Loans on < 5 Family Dwellings (A B C & D)
G) Loans On Manufactured Home Dwelling (A B C & D)
Number
Average Value
Number
Average Value
Number
Average Value
Number
Average Value
Number
Average Value
Number
Average Value
LOANS ORIGINATED
9
$135,422
16
$183,232
51
$168,696
4
$79,608
10
$173,877
25
$105,906
APPLICATIONS APPROVED, NOT ACCEPTED
0
$0
3
$188,080
12
$157,737
1
$55,610
3
$181,940
5
$88,196
APPLICATIONS DENIED
3
$163,167
7
$166,576
52
$189,599
12
$82,440
6
$126,863
15
$99,790
APPLICATIONS WITHDRAWN
1
$96,340
3
$146,283
21
$161,262
2
$172,675
2
$246,875
6
$113,462
FILES CLOSED FOR INCOMPLETENESS
0
$0
1
$132,830
6
$169,898
1
$127,510
1
$169,310
1
$167,890
Aggregated Statistics For Year 2007 (Based on 2 partial tracts)
A) FHA, FSA/RHS & VA Home Purchase Loans
B) Conventional Home Purchase Loans
C) Refinancings
D) Home Improvement Loans
F) Non-occupant Loans on < 5 Family Dwellings (A B C & D)
G) Loans On Manufactured Home Dwelling (A B C & D)
Number
Average Value
Number
Average Value
Number
Average Value
Number
Average Value
Number
Average Value
Number
Average Value
LOANS ORIGINATED
5
$140,476
40
$160,081
80
$160,258
14
$93,939
15
$164,396
43
$95,741
APPLICATIONS APPROVED, NOT ACCEPTED
0
$0
7
$171,736
16
$168,400
4
$48,260
1
$255,730
9
$115,902
APPLICATIONS DENIED
2
$104,310
18
$166,356
59
$158,688
16
$105,707
7
$216,517
29
$90,981
APPLICATIONS WITHDRAWN
0
$0
5
$115,966
28
$160,541
3
$102,483
3
$115,470
10
$105,870
FILES CLOSED FOR INCOMPLETENESS
0
$0
2
$172,140
10
$167,607
1
$79,700
0
$0
2
$140,970
Aggregated Statistics For Year 2006 (Based on 2 partial tracts)
A) FHA, FSA/RHS & VA Home Purchase Loans
B) Conventional Home Purchase Loans
C) Refinancings
D) Home Improvement Loans
F) Non-occupant Loans on < 5 Family Dwellings (A B C & D)
G) Loans On Manufactured Home Dwelling (A B C & D)
Number
Average Value
Number
Average Value
Number
Average Value
Number
Average Value
Number
Average Value
Number
Average Value
LOANS ORIGINATED
6
$122,553
71
$146,833
77
$160,899
13
$63,293
28
$172,546
42
$100,702
APPLICATIONS APPROVED, NOT ACCEPTED
1
$211,100
13
$156,611
22
$162,079
5
$70,414
4
$126,892
7
$95,229
APPLICATIONS DENIED
2
$116,355
30
$152,082
68
$135,070
22
$86,409
15
$143,899
33
$86,618
APPLICATIONS WITHDRAWN
0
$0
10
$112,281
32
$162,047
5
$126,378
4
$110,952
6
$93,863
FILES CLOSED FOR INCOMPLETENESS
0
$0
2
$212,345
15
$142,648
1
$114,050
2
$249,890
1
$57,730
Aggregated Statistics For Year 2005 (Based on 2 partial tracts)
A) FHA, FSA/RHS & VA Home Purchase Loans
B) Conventional Home Purchase Loans
C) Refinancings
D) Home Improvement Loans
F) Non-occupant Loans on < 5 Family Dwellings (A B C & D)
G) Loans On Manufactured Home Dwelling (A B C & D)
Number
Average Value
Number
Average Value
Number
Average Value
Number
Average Value
Number
Average Value
Number
Average Value
LOANS ORIGINATED
9
$119,366
100
$131,826
62
$133,602
13
$76,971
33
$130,174
46
$85,070
APPLICATIONS APPROVED, NOT ACCEPTED
1
$101,300
14
$138,568
12
$118,539
5
$57,876
3
$177,810
7
$91,687
APPLICATIONS DENIED
0
$0
28
$135,191
60
$119,383
13
$75,526
7
$93,761
24
$84,757
APPLICATIONS WITHDRAWN
1
$65,530
19
$125,349
24
$122,465
2
$129,105
5
$125,316
7
$92,446
FILES CLOSED FOR INCOMPLETENESS
0
$0
4
$105,818
23
$120,936
1
$55,960
1
$168,250
6
$78,692
Aggregated Statistics For Year 2004 (Based on 2 partial tracts)
A) FHA, FSA/RHS & VA Home Purchase Loans
B) Conventional Home Purchase Loans
C) Refinancings
D) Home Improvement Loans
F) Non-occupant Loans on < 5 Family Dwellings (A B C & D)
G) Loans On Manufactured Home Dwelling (A B C & D)
Detailed PMIC statistics for the following Tracts:0014.00
2007 - 2018 National Fire Incident Reporting System (NFIRS) incidents
According to the data from the years 2007 - 2018 the average number of fire incidents per year is 15. The highest number of reported fires - 30 took place in 2011, and the least - 3 in 2007. The data has a growing trend.
When looking into fire subcategories, the most reports belonged to: Outside Fires (57.4%), and Mobile Property/Vehicle Fires (23.9%).
Fire incident types reported to NFIRS in Zip Code 85342


 Nearest zip codes: 85387, 85383, 85361, 85375, 86343, 85374.


 According to the data from the years 2007 - 2018 the average number of fire incidents per year is 15. The highest number of reported fires - 30 took place in 2011, and the least - 3 in 2007. The data has a growing trend.
 When looking into fire subcategories, the most reports belonged to: Outside Fires (57.4%), and Mobile Property/Vehicle Fires (23.9%).