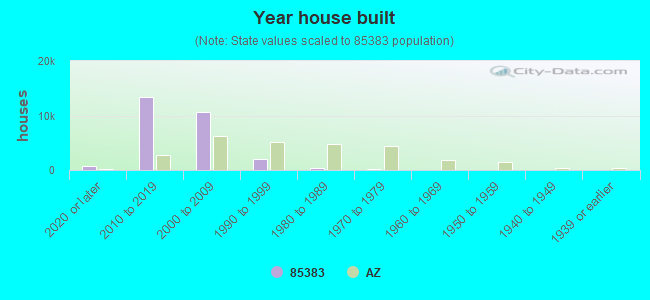
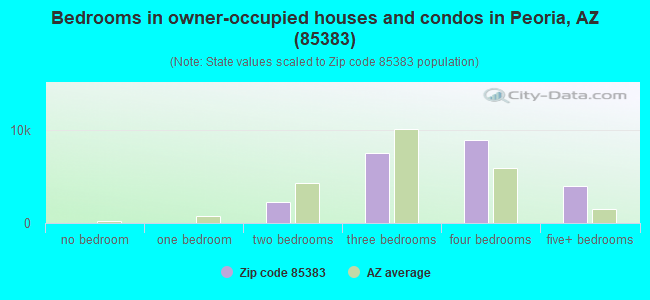
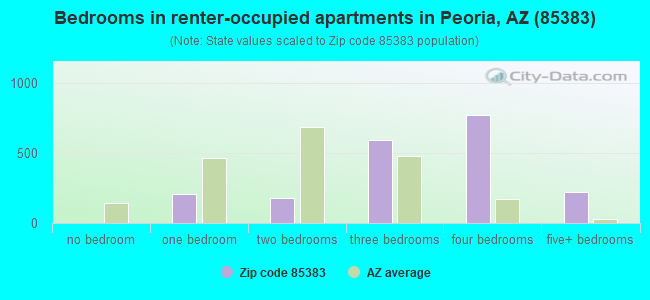
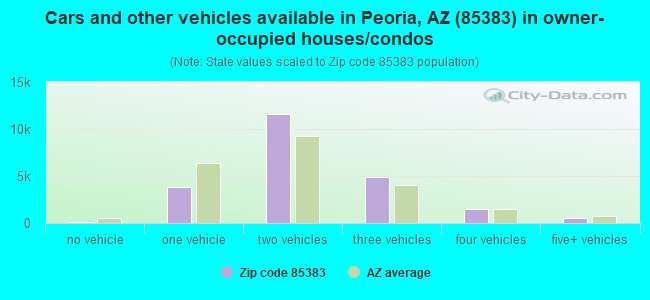
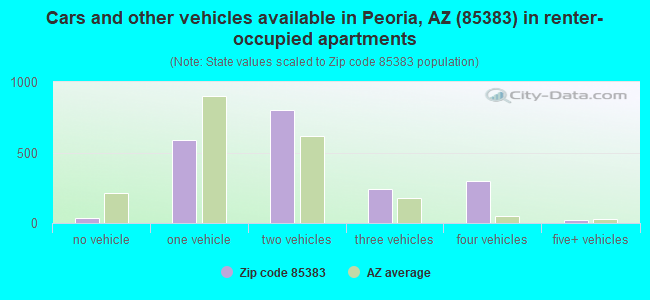
Houses and condos: 25,126 Renter-occupied apartments: 1,938
% of renters here:
8%
State:
33%
March 2022 cost of living index in zip code 85383: 96.6 (near average, U.S. average is 100)
Land area: 95.0 sq. mi. Water area: 2.2 sq. mi.
Population density: 747 people per square mile
(low).
OSM Map
Google Map
MSN Map
OSM Map
General Map
Google Map
MSN Map
OSM Map
Google Map
MSN Map
OSM Map
Google Map
MSN Map
Please wait while loading the map...
Real estate property taxes paid for housing units in 2022:
This zip code:
0.4% ($3,035)
Arizona:
0.4% ($1,786)
Median real estate property taxes paid for housing units with mortgages in 2022: $2,889 (0.4%) Median real estate property taxes paid for housing units with no mortgage in 2022: $3,716 (0.5%)
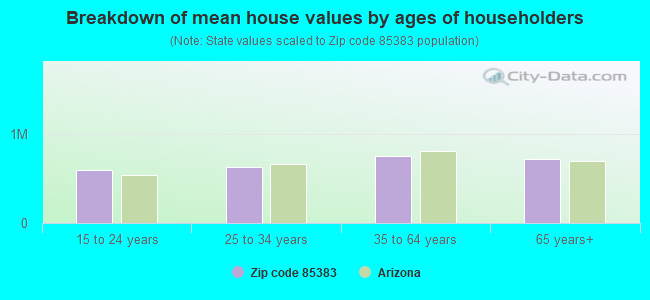
Estimated median house/condo value in 2022: $677,015
85383:
$677,015
Arizona:
$402,800
According to our research of Arizona and other state lists, there were 14 registered sex offenders living in 85383 zip code as of May 11, 2024. The ratio of all residents to sex offenders in zip code 85383 is 3,052 to 1. The ratio of registered sex offenders to all residents in this zip code is much lower than the state average.
Median resident age:
This zip code:
40.5 years
Arizona median age:
38.8 years
Average household size:
This zip code:
2.9 people
Arizona:
2.5 people
Averages for the 2020 tax year for zip code 85383, filed in 2021:
Average Adjusted Gross Income (AGI) in 2020: $123,214 (Individual Income Tax Returns)
Here:
$123,214
State:
$73,499
Salary/wage: $100,502 (reported on 81.9% of returns)
Here:
$100,502
State:
$59,499
(% of AGI for various income ranges: 1171.2% for AGIs below $25k, 3571.3% for AGIs $25k-50k, 6550.1% for AGIs $50k-75k, 9792.1% for AGIs $75k-100k, 19752.0% for AGIs $100k-200k, 74006.6% for AGIs over 200k)
Taxable interest for individuals: $1,992 (reported on 37.5% of returns)
This zip code:
$1,992
Arizona:
$2,325
(% of AGI for various income ranges: 22.6% for AGIs below $25k, 42.7% for AGIs $25k-50k, 69.5% for AGIs $50k-75k, 77.5% for AGIs $75k-100k, 104.0% for AGIs $100k-200k, 872.9% for AGIs over 200k)
Ordinary dividends: $6,281 (reported on 27.8% of returns)
Here:
$6,281
State:
$8,711
(% of AGI for various income ranges: 42.5% for AGIs below $25k, 71.8% for AGIs $25k-50k, 134.5% for AGIs $50k-75k, 178.4% for AGIs $75k-100k, 276.8% for AGIs $100k-200k, 2067.9% for AGIs over 200k)
Net capital gain/loss in AGI: +$24,514 (reported on 28.0% of returns)
Here:
+$24,514
State:
+$31,332
(% of AGI for various income ranges: 14.4% for AGIs below $25k, 53.3% for AGIs $25k-50k, 163.6% for AGIs $50k-75k, 237.3% for AGIs $75k-100k, 621.4% for AGIs $100k-200k, 12034.2% for AGIs over 200k)
Profit/loss from business: +$17,792 (reported on 19.2% of returns)
Here:
+$17,792
State:
+$13,214
(% of AGI for various income ranges: 100.1% for AGIs below $25k, 167.1% for AGIs $25k-50k, 367.2% for AGIs $50k-75k, 458.4% for AGIs $75k-100k, 607.5% for AGIs $100k-200k, 3383.4% for AGIs over 200k)
Taxable individual retirement arrangement distribution: $30,683 (reported on 11.8% of returns)
85383:
$30,683
Arizona:
$23,364
(% of AGI for various income ranges: 65.5% for AGIs below $25k, 185.4% for AGIs $25k-50k, 390.2% for AGIs $50k-75k, 582.9% for AGIs $75k-100k, 928.4% for AGIs $100k-200k, 2561.1% for AGIs over 200k)
Self-employed (Keogh) retirement plans: $21,753 (reported on 0.9% of returns)
85383:
$21,753
Arizona:
$26,938
(% of AGI for various income ranges: 15.0% for AGIs $50k-75k, 15.7% for AGIs $75k-100k, 19.0% for AGIs $100k-200k, 330.6% for AGIs over 200k)
Total itemized deductions: $36,188 (reported on 21.1% of returns)
Here:
$36,188
State:
$36,308
(% of AGI for various income ranges: 105.5% for AGIs below $25k, 294.4% for AGIs $25k-50k, 635.9% for AGIs $50k-75k, 919.1% for AGIs $75k-100k, 1580.5% for AGIs $100k-200k, 7804.6% for AGIs over 200k)
Charity contributions: $10,324 (reported on 18.4% of returns)
Here:
$10,324
State:
$11,955
(% of AGI for various income ranges: 7.5% for AGIs below $25k, 30.5% for AGIs $25k-50k, 82.7% for AGIs $50k-75k, 139.2% for AGIs $75k-100k, 334.9% for AGIs $100k-200k, 2554.6% for AGIs over 200k)
Taxes paid: $7,868 (reported on 21.0% of returns)
85383:
$7,868
State:
$6,820
(% of AGI for various income ranges: 15.6% for AGIs below $25k, 53.6% for AGIs $25k-50k, 124.8% for AGIs $50k-75k, 203.8% for AGIs $75k-100k, 398.2% for AGIs $100k-200k, 1555.3% for AGIs over 200k)
Earned income credit: $1,932 (reported on 5.7% of returns)
Here:
$1,932
State:
$2,383
(% of AGI for various income ranges: 42.3% for AGIs below $25k, 45.1% for AGIs $25k-50k, 1.0% for AGIs $50k-75k)
Percentage of individuals using paid preparers for their 2020 taxes: 94.0%
Here:
94%
State:
93%
(% for various income ranges: 92.7% for AGIs below $25k, 93.6% for AGIs $25k-50k, 93.4% for AGIs $50k-75k, 94.1% for AGIs $75k-100k, 94.7% for AGIs $100k-200k, 95.5% for AGIs over 200k)
Averages for the 2012 tax year for zip code 85383, filed in 2013:
Average Adjusted Gross Income (AGI) in 2012: $97,767 (Individual Income Tax Returns)
Here:
$97,767
State:
$57,644
Salary/wage: $81,453 (reported on 85.5% of returns)
Here:
$81,453
State:
$47,932
(% of AGI for various income ranges: 78.8% for AGIs below $25k, 75.9% for AGIs $25k-50k, 74.6% for AGIs $50k-75k, 77.2% for AGIs $75k-100k, 79.8% for AGIs $100k-200k, 58.3% for AGIs over 200k)
Taxable interest for individuals: $1,527 (reported on 42.3% of returns)
This zip code:
$1,527
Arizona:
$2,064
(% of AGI for various income ranges: 1.9% for AGIs below $25k, 0.9% for AGIs $25k-50k, 0.7% for AGIs $50k-75k, 0.8% for AGIs $75k-100k, 0.5% for AGIs $100k-200k, 0.7% for AGIs over 200k)
Ordinary dividends: $5,557 (reported on 25.5% of returns)
Here:
$5,557
State:
$7,268
(% of AGI for various income ranges: 2.3% for AGIs below $25k, 1.3% for AGIs $25k-50k, 1.2% for AGIs $50k-75k, 0.9% for AGIs $75k-100k, 0.7% for AGIs $100k-200k, 2.5% for AGIs over 200k)
Net capital gain/loss in AGI: +$19,013 (reported on 23.5% of returns)
Here:
+$19,013
State:
+$15,530
(% of AGI for various income ranges: 0.4% for AGIs $50k-75k, 0.6% for AGIs $75k-100k, 1.0% for AGIs $100k-200k, 11.8% for AGIs over 200k)
Profit/loss from business: +$15,527 (reported on 20.1% of returns)
Here:
+$15,527
State:
+$12,323
(% of AGI for various income ranges: 8.1% for AGIs below $25k, 5.2% for AGIs $25k-50k, 4.5% for AGIs $50k-75k, 3.2% for AGIs $75k-100k, 2.4% for AGIs $100k-200k, 2.9% for AGIs over 200k)
Taxable individual retirement arrangement distribution: $24,769 (reported on 11.5% of returns)
85383:
$24,769
Arizona:
$18,280
(% of AGI for various income ranges: 3.5% for AGIs below $25k, 4.0% for AGIs $25k-50k, 3.8% for AGIs $50k-75k, 3.3% for AGIs $75k-100k, 3.2% for AGIs $100k-200k, 2.0% for AGIs over 200k)
Self-employment retirement plans: $19,200 (reported on 0.8% of returns)
85383:
$19,200
Arizona:
$22,154
(% of AGI for various income ranges: 0.2% for AGIs $50k-75k, 0.2% for AGIs $100k-200k, 0.3% for AGIs over 200k)
Total itemized deductions: $27,420 (20% of AGI, reported on 57.8% of returns)
Here:
$27,420
State:
$23,651
Here:
19.6% of AGI
State:
20.6% of AGI
(% of AGI for various income ranges: 22.2% for AGIs below $25k, 19.1% for AGIs $25k-50k, 18.8% for AGIs $50k-75k, 17.9% for AGIs $75k-100k, 17.1% for AGIs $100k-200k, 13.2% for AGIs over 200k)
Charity contributions: $4,221 (reported on 51.1% of returns)
Here:
$4,221
State:
$4,114
(% of AGI for various income ranges: 1.4% for AGIs below $25k, 2.0% for AGIs $25k-50k, 2.1% for AGIs $50k-75k, 2.2% for AGIs $75k-100k, 2.3% for AGIs $100k-200k, 2.2% for AGIs over 200k)
Taxes paid: $7,514 (reported on 57.6% of returns)
85383:
$7,514
State:
$6,509
(% of AGI for various income ranges: 3.5% for AGIs below $25k, 3.7% for AGIs $25k-50k, 4.2% for AGIs $50k-75k, 4.3% for AGIs $75k-100k, 4.8% for AGIs $100k-200k, 4.3% for AGIs over 200k)
Earned income credit: $1,998 (reported on 7.7% of returns)
Here:
$1,998
State:
$2,432
(% of AGI for various income ranges: 3.9% for AGIs below $25k, 0.9% for AGIs $25k-50k)
Percentage of individuals using paid preparers for their 2012 taxes: 55.8%
Here:
56%
State:
52%
(% for various income ranges: 47.3% for AGIs below $25k, 51.6% for AGIs $25k-50k, 56.5% for AGIs $50k-75k, 57.1% for AGIs $75k-100k, 58.6% for AGIs $100k-200k, 75.5% for AGIs over 200k)
Averages for the 2004 tax year for zip code 85383, filed in 2005:
Average Adjusted Gross Income (AGI) in 2004: $87,482 (Individual Income Tax Returns)
Here:
$87,482
State:
$50,097
Salary/wage: $71,749 (reported on 90.2% of returns)
Here:
$71,749
State:
$42,146
(% of AGI for various income ranges: 305.5% for AGIs below $10k, 76.6% for AGIs $10k-25k, 82.4% for AGIs $25k-50k, 83.3% for AGIs $50k-75k, 88.3% for AGIs $75k-100k, 66.9% for AGIs over 100k)
Taxable interest for individuals: $1,249 (reported on 57.2% of returns)
This zip code:
$1,249
Arizona:
$2,374
(% of AGI for various income ranges: 19.2% for AGIs below $10k, 2.5% for AGIs $10k-25k, 1.2% for AGIs $25k-50k, 0.7% for AGIs $50k-75k, 0.5% for AGIs $75k-100k, 0.7% for AGIs over 100k)
Taxable dividends: $1,784 (reported on 29.5% of returns)
Here:
$1,784
State:
$3,888
(% of AGI for various income ranges: 6.1% for AGIs below $10k, 1.7% for AGIs $10k-25k, 0.9% for AGIs $25k-50k, 0.3% for AGIs $50k-75k, 0.4% for AGIs $75k-100k, 0.6% for AGIs over 100k)
Net capital gain/loss: +$20,116 (reported on 27.8% of returns)
Here:
+$20,116
State:
+$17,569
(% of AGI for various income ranges: -1.4% for AGIs below $10k, 1.0% for AGIs $10k-25k, 1.7% for AGIs $25k-50k, 1.0% for AGIs $50k-75k, 1.3% for AGIs $75k-100k, 9.3% for AGIs over 100k)
Profit/loss from business: +$16,343 (reported on 21.8% of returns)
Here:
+$16,343
State:
+$11,088
(% of AGI for various income ranges: -3.9% for AGIs below $10k, 7.6% for AGIs $10k-25k, 7.3% for AGIs $25k-50k, 4.9% for AGIs $50k-75k, 3.2% for AGIs $75k-100k, 3.8% for AGIs over 100k)
IRA payment deduction: $3,599 (reported on 3.5% of returns)
85383:
$3,599
Arizona:
$3,023
(% of AGI for various income ranges: 0.3% for AGIs $10k-25k, 0.3% for AGIs $25k-50k, 0.3% for AGIs $50k-75k, 0.1% for AGIs $75k-100k, 0.1% for AGIs over 100k)
Self-employed pension: $18,718 (reported on 1.5% of returns)
Here:
$18,718
Arizona:
$15,785
(% of AGI for various income ranges: 0.1% for AGIs $25k-50k, 0.2% for AGIs $50k-75k, 0.1% for AGIs $75k-100k, 0.4% for AGIs over 100k)
Total itemized deductions: $24,398 (21% of AGI, reported on 68.1% of returns)
Here:
$24,398
State:
$19,781
Here:
20.7% of AGI
State:
21.8% of AGI
(% of AGI for various income ranges: 68.5% for AGIs below $10k, 22.3% for AGIs $10k-25k, 26.5% for AGIs $25k-50k, 26.6% for AGIs $50k-75k, 23.7% for AGIs $75k-100k, 15.5% for AGIs over 100k)
Charity contributions deductions: $3,343 (3% of AGI, reported on 62.5% of returns)
Here:
$3,343
State:
$3,389
Here:
2.8% of AGI
State:
3.5% of AGI
(% of AGI for various income ranges: 3.6% for AGIs below $10k, 1.6% for AGIs $10k-25k, 2.6% for AGIs $25k-50k, 2.7% for AGIs $50k-75k, 2.6% for AGIs $75k-100k, 2.3% for AGIs over 100k)
Total tax: $14,114 (reported on 85.6% of returns)
85383:
$14,114
State:
$8,323
(% of AGI for various income ranges: 12.6% for AGIs below $10k, 5.2% for AGIs $10k-25k, 6.8% for AGIs $25k-50k, 7.6% for AGIs $50k-75k, 8.8% for AGIs $75k-100k, 17.1% for AGIs over 100k)
Earned income credit: $1,479 (reported on 5.3% of returns)
Here:
$1,479
State:
$1,786
Percentage of individuals using paid preparers for their 2004 taxes: 59.7%
Here:
60%
State:
60%
(% for various income ranges: 46.4% for AGIs below $10k, 54.0% for AGIs $10k-25k, 60.1% for AGIs $25k-50k, 62.3% for AGIs $50k-75k, 57.6% for AGIs $75k-100k, 68.2% for AGIs over 100k)
Likely homosexual households (counted as self-reported same-sex unmarried-partner households)
Lesbian couples: 0.1% of all households
Gay men: 0.1% of all households
Household received Food Stamps/SNAP in the past 12 months: 404 Household did not receive Food Stamps/SNAP in the past 12 months: 23,711
Women who had a birth in the past 12 months: 666 (627 now married, 52 unmarried) Women who did not have a birth in the past 12 months: 14,822 (8,686 now married, 6,030 unmarried)
Housing units in zip code 85383 with a mortgage: 16,690 (1,505 second mortgage, 4 home equity loan, 1,242 both second mortgage and home equity loan) Houses without a mortgage: 98
Median monthly owner costs for units with a mortgage: $2,256 Median monthly owner costs for units without a mortgage: $674
Residents with income below the poverty level in 2022:
This zip code:
3.9%
Whole state:
12.5%
Residents with income below 50% of the poverty level in 2022:
This zip code:
1.3%
Whole state:
6.0%
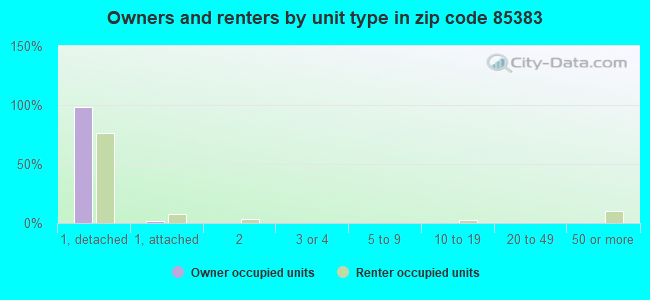
Median number of rooms in houses and condos:
Here:
7.1
State:
6.0
Median number of rooms in apartments:
Here:
6.3
State:
4.1
Notable locations in this zip code not listed on our city pages
Notable locations in zip code 85383: Lake Carl Pleasant (A), Lake Pleasant Inn (B), Peoria Fire Department Station 199 Pleasant Harbor Marina (C), Peoria Fire Department Station 197 (D), Peoria Fire Department Station 196 (E), Peoria Fire Department Station 195 (F). Display/hide their locations on the map
Churches in zip code 85383 include: Discovery Pointe Church (A), Cross of Glory Lutheran Church (B), Christ Church of the Valley (C), The Church of Jesus Christ of Latter Day Saints (D), Sunrise Mountain Baptist Church (E), Saint Albans Anglican Church (F), Pinnacle Peak Community Church (G), Mount Zion Lutheran Church (H). Display/hide their locations on the map
Reservoirs: Flat Tank (A), Lower Lake (B), Milky Way Tank (C), New River Tank (D), Saguaro Tank (E), Snodgrass Tank (F), Bobs Tank (G), Caterpillar Tank (H). Display/hide their locations on the map
Streams, rivers, and creeks: White Peak Wash (A), Garambullo Wash (B), Deadman Wash (C), Caterpillar Tank Wash (D), Weir Wash (E). Display/hide their locations on the map
In group quarters: 230 (-1 institutionalized population)
Size of family households: 9,314 2-persons, 4,202 3-persons, 3,933 4-persons, 1,940 5-persons, 753 6-persons, 655 7-or-more-persons
Size of nonfamily households: 2,568 1-person, 641 2-persons, 28 3-persons
15,399 married couples with children.
2,398 single-parent households (908 men, 1,490 women).
88.1% of residents of 85383 zip code speak English at home.
2.8% of residents speak Spanish at home (87% very well, 12% well, 1% not well).
3.8% of residents speak other Indo-European language at home (75% very well, 21% well, 4% not well).
5.0% of residents speak Asian or Pacific Island language at home (71% very well, 24% well, 3% not well, 2% not at all).
0.4% of residents speak other language at home (85% very well, 15% well).
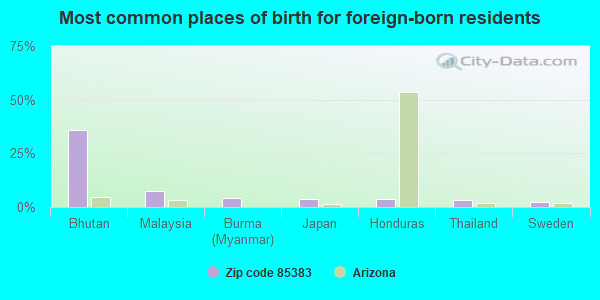
Foreign born population: 7,142 (10.1%) (65.6% of them are naturalized citizens)
This zip code:
10.1%
Whole state:
13.1%
36%Bhutan
7%Malaysia
4%Burma (Myanmar)
4%Japan
4%Honduras
3%Thailand
2%Sweden
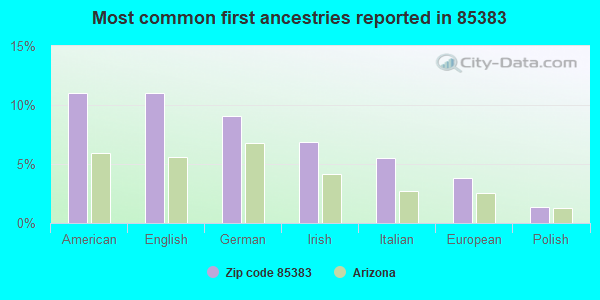
11%American
11%English
9%German
7%Irish
6%Italian
4%European
1%Polish
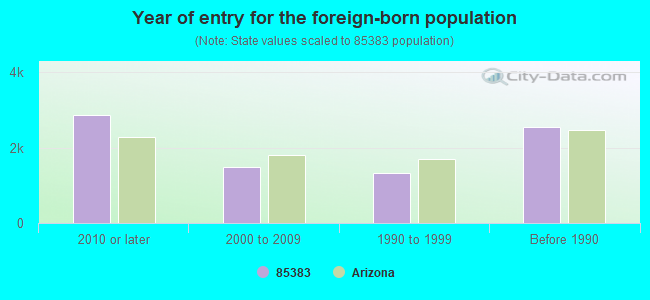
Year of entry for the foreign-born population
2,8622010 or later
1,4922000 to 2009
1,3361990 to 1999
2,541Before 1990
Facilities with environmental interests located in this zip code:
HAPPY VALLEY SCHOOL (7140 W. HAPPY VALLEY RD. in PEORIA, AZ)
(National Center for Education Statistics) - STATE ID-771 Organizations: PEACH SPRINGS UNIFIED DISTRICT (SCHOOL DISTRICT)
Housing units lacking complete plumbing facilities: 0.2% Housing units lacking complete kitchen facilities: 0.5%
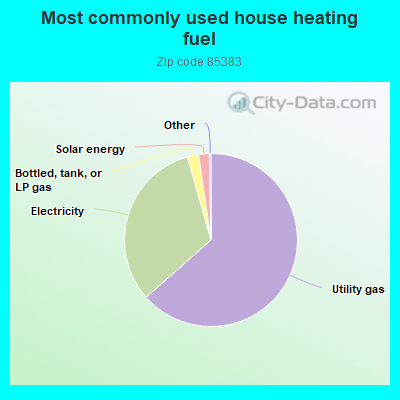
63.5%Utility gas
32.1%Electricity
2.1%Bottled, tank, or LP gas
2.0%Solar energy
Place of birth for U.S.-born residents:
This state: 26,078
Northeast: 5,045
Midwest: 13,461
South: 5,062
West: 13,132
89% of the 85383 zip code residents lived in the same house 1 year ago. Out of people who lived in different houses, 56% moved from this county. Out of people who lived in different houses, 3% moved from different county within same state. Out of people who lived in different houses, 35% moved from different state. Out of people who lived in different houses, 9% moved from abroad.
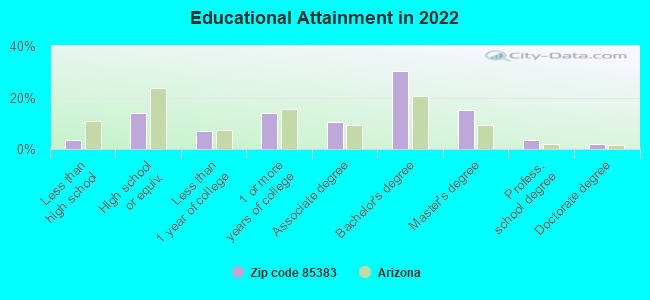
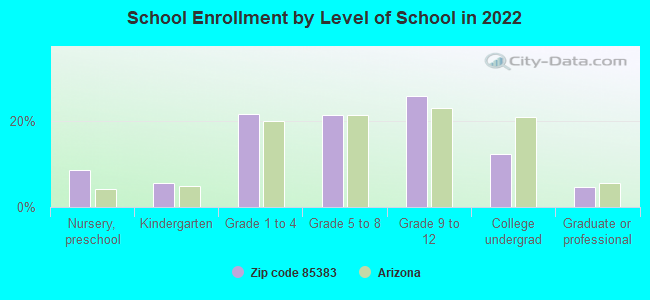
Private vs. public school enrollment:
Students in private schools in grades 1 to 8 (elementary and middle school): 1,419
Here:
16.5%
Arizona:
10.4%
Students in private schools in grades 9 to 12 (high school): 617
Here:
11.9%
Arizona:
8.8%
Students in private undergraduate colleges: 449
Here:
18.3%
Arizona:
13.1%
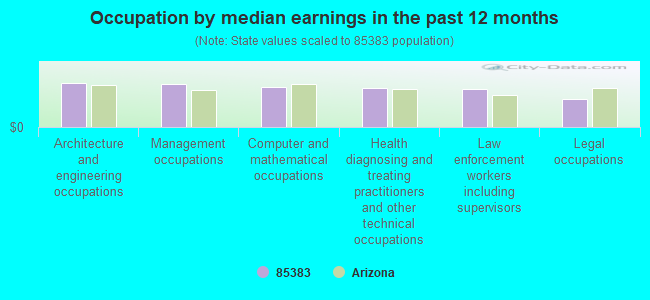
Occupation by median earnings in the past 12 months ($)
122,437Architecture and engineering occupations
119,097Management occupations
112,273Computer and mathematical occupations
107,305Health diagnosing and treating practitioners and other technical occupations
105,143Law enforcement workers including supervisors
77,156Legal occupations
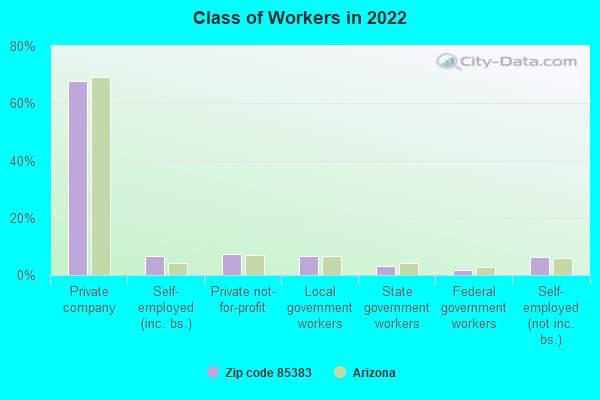
Top industries in this zip code by the number of employees in 2005:
Other Services (except Public Administration): Other Similar Organizations (except Business, Professional, Labor, and Political Organizations) (100-249: 1)
Construction: Commercial and Institutional Building Construction (20-49: 1, 10-19: 1, 1-4: 2)
Other Services (except Public Administration): Beauty Salons (20-49: 1, 1-4: 3)
Fatal accident statistics in 2014:
Fatal accident count: 3
Vehicles involved in fatal accidents: 5
Fatal accidents caused by drunken drivers: 1
Fatalities: 5
Persons involved in fatal accidents: 17
Pedestrians involved in fatal accidents: 0
Fatal accident statistics in 2013:
Fatal accident count: 1
Vehicles involved in fatal accidents: 1
Fatal accidents caused by drunken drivers: 1
Fatalities: 1
Persons involved in fatal accidents: 1
Pedestrians involved in fatal accidents: 0
2004 - 2018 National Fire Incident Reporting System (NFIRS) incidents
Based on the data from the years 2004 - 2018 the average number of fire incidents per year is 10. The highest number of reported fires - 31 took place in 2018, and the least - 0 in 2009. The data has a growing trend.
When looking into fire subcategories, the most incidents belonged to: Structure Fires (37.5%), and Outside Fires (34.7%).
Fire incident types reported to NFIRS in Zip Code 85383


 Based on the data from the years 2004 - 2018 the average number of fire incidents per year is 10. The highest number of reported fires - 31 took place in 2018, and the least - 0 in 2009. The data has a growing trend.
 When looking into fire subcategories, the most incidents belonged to: Structure Fires (37.5%), and Outside Fires (34.7%).