Estimated zip code population in 2022: 11,931 Zip code population in 2010: 13,258 Zip code population in 2000: 14,272
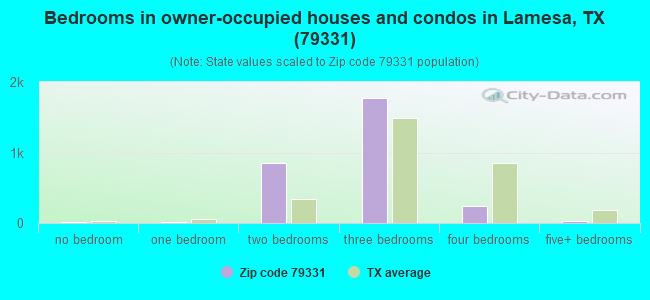
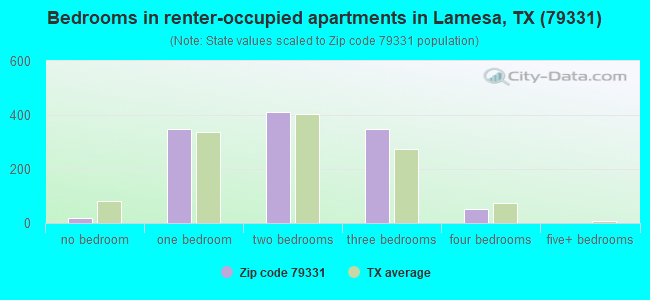
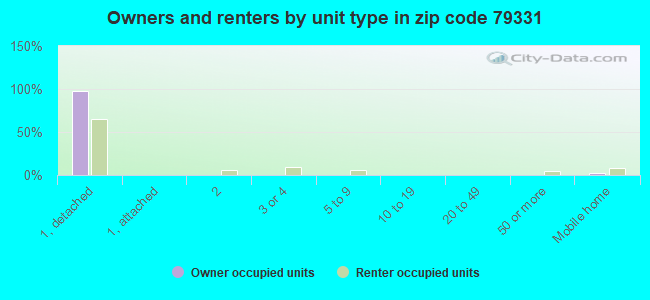
Houses and condos: 4,800 Renter-occupied apartments: 1,195
% of renters here:
29%
State:
38%
March 2022 cost of living index in zip code 79331: 77.3 (low, U.S. average is 100)
Land area: 747.6 sq. mi. Water area: 1.1 sq. mi.
Population density: 16 people per square mile
(very low).
OSM Map
General Map
Google Map
MSN Map
OSM Map
General Map
Google Map
MSN Map
OSM Map
General Map
Google Map
MSN Map
OSM Map
General Map
Google Map
MSN Map
Please wait while loading the map...
Real estate property taxes paid for housing units in 2022:
This zip code:
1.4% ($1,568)
Texas:
1.5% ($4,050)
Median real estate property taxes paid for housing units with mortgages in 2022: $2,247 (1.3%) Median real estate property taxes paid for housing units with no mortgage in 2022: $1,204 (1.3%)
Business Search- 14 Million verified businesses
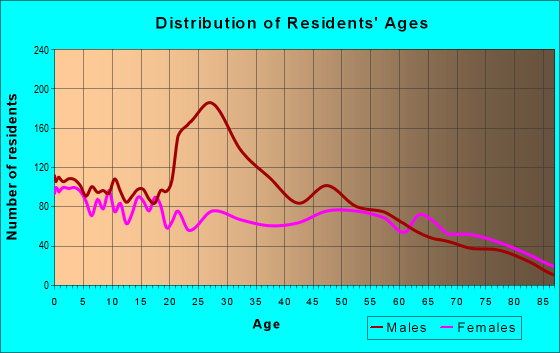
Males: 6,726
(56.4%)
Females: 5,205
(43.6%)
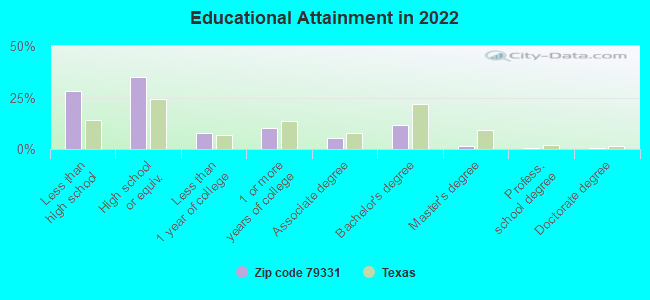
For population 25 years and over in 79331:
High school or higher: 70.5%
Bachelor's degree or higher: 13.7%
Graduate or professional degree: 2.1%
Unemployed: 7.8%
Mean travel time to work (commute): 23.0 minutes
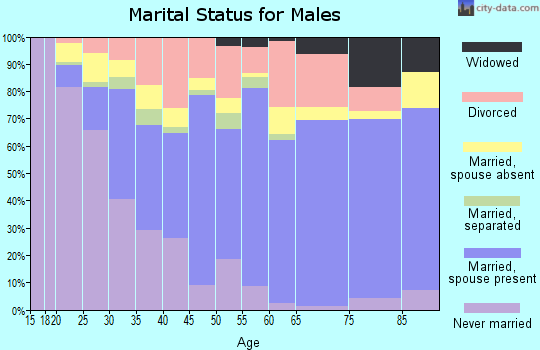
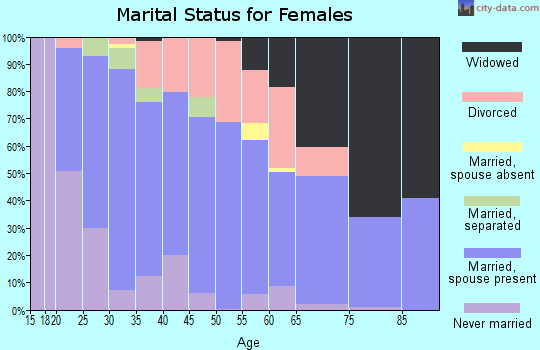
For population 15 years and over in 79331:
Never married: 35.8%
Now married: 40.4%
Separated: 3.3%
Widowed: 7.0%
Divorced: 13.5%
Zip code 79331 compared to state average:
Median household income below state average.
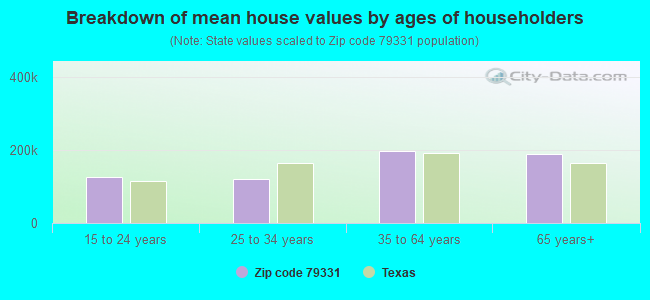
Median house value significantly below state average.
Unemployed percentage above state average.
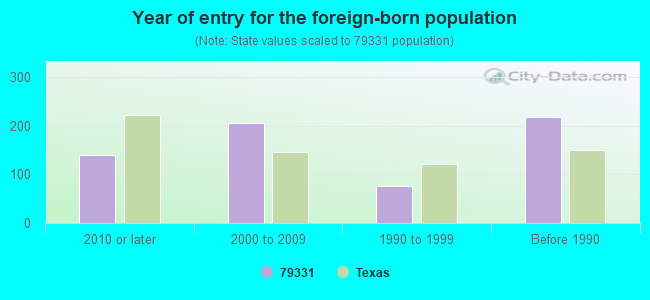
Foreign-born population percentage significantly below state average.
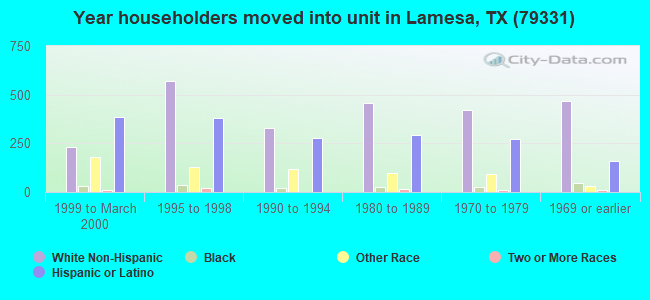
Length of stay since moving in significantly above state average.
House age above state average.
Percentage of population with a bachelor's degree or higher significantly below state average.
Averages for the 2020 tax year for zip code 79331, filed in 2021:
Average Adjusted Gross Income (AGI) in 2020: $59,746 (Individual Income Tax Returns)
Here:
$59,746
State:
$77,054
Salary/wage: $41,625 (reported on 85.3% of returns)
Here:
$41,625
State:
$62,766
(% of AGI for various income ranges: 1290.4% for AGIs below $25k, 3865.2% for AGIs $25k-50k, 6835.1% for AGIs $50k-75k, 10273.0% for AGIs $75k-100k, 16998.3% for AGIs $100k-200k, 50850.0% for AGIs over 200k)
Taxable interest for individuals: $2,086 (reported on 19.4% of returns)
This zip code:
$2,086
Texas:
$2,665
(% of AGI for various income ranges: 8.4% for AGIs below $25k, 7.6% for AGIs $25k-50k, 35.6% for AGIs $50k-75k, 90.0% for AGIs $75k-100k, 185.7% for AGIs $100k-200k, 2833.3% for AGIs over 200k)
Ordinary dividends: $5,619 (reported on 8.3% of returns)
Here:
$5,619
State:
$10,044
(% of AGI for various income ranges: 7.3% for AGIs below $25k, 9.4% for AGIs $25k-50k, 25.6% for AGIs $50k-75k, 86.5% for AGIs $75k-100k, 139.6% for AGIs $100k-200k, 4233.3% for AGIs over 200k)
Net capital gain/loss in AGI: +$24,702 (reported on 9.4% of returns)
Here:
+$24,702
State:
+$39,590
(% of AGI for various income ranges: 8.5% for AGIs below $25k, 15.7% for AGIs $25k-50k, 52.0% for AGIs $50k-75k, 97.4% for AGIs $75k-100k, 430.0% for AGIs $100k-200k, 28946.7% for AGIs over 200k)
Profit/loss from business: +$7,178 (reported on 14.5% of returns)
Here:
+$7,178
State:
+$10,888
(% of AGI for various income ranges: 77.7% for AGIs below $25k, 75.5% for AGIs $25k-50k, 107.8% for AGIs $50k-75k, 46.1% for AGIs $75k-100k, 504.3% for AGIs $100k-200k, 4290.0% for AGIs over 200k)
Taxable individual retirement arrangement distribution: $16,800 (reported on 4.5% of returns)
79331:
$16,800
Texas:
$24,740
(% of AGI for various income ranges: 19.8% for AGIs below $25k, 26.5% for AGIs $25k-50k, 114.7% for AGIs $50k-75k, 184.8% for AGIs $75k-100k, 523.5% for AGIs $100k-200k, 2453.3% for AGIs over 200k)
Total itemized deductions: $37,473 (reported on 3.3% of returns)
Here:
$37,473
State:
$40,428
(% of AGI for various income ranges: 61.5% for AGIs below $25k, 125.1% for AGIs $50k-75k, 283.9% for AGIs $75k-100k, 407.4% for AGIs $100k-200k, 9040.0% for AGIs over 200k)
Charity contributions: $18,015 (reported on 2.9% of returns)
Here:
$18,015
State:
$18,201
(% of AGI for various income ranges: 107.3% for AGIs $50k-75k, 172.2% for AGIs $100k-200k, 4876.7% for AGIs over 200k)
Taxes paid: $5,173 (reported on 3.3% of returns)
79331:
$5,173
State:
$7,821
(% of AGI for various income ranges: 7.8% for AGIs below $25k, 44.7% for AGIs $50k-75k, 67.0% for AGIs $100k-200k, 1083.3% for AGIs over 200k)
Earned income credit: $2,628 (reported on 25.4% of returns)
Here:
$2,628
State:
$2,584
(% of AGI for various income ranges: 163.7% for AGIs below $25k, 109.2% for AGIs $25k-50k, 2.2% for AGIs $50k-75k)
Percentage of individuals using paid preparers for their 2020 taxes: 91.7%
Here:
92%
State:
92%
(% for various income ranges: 87.1% for AGIs below $25k, 94.7% for AGIs $25k-50k, 95.2% for AGIs $50k-75k, 94.3% for AGIs $75k-100k, 95.3% for AGIs $100k-200k, 94.1% for AGIs over 200k)
Averages for the 2012 tax year for zip code 79331, filed in 2013:
Average Adjusted Gross Income (AGI) in 2012: $53,998 (Individual Income Tax Returns)
Here:
$53,998
State:
$65,384
Salary/wage: $37,637 (reported on 86.4% of returns)
Here:
$37,637
State:
$52,524
(% of AGI for various income ranges: 84.5% for AGIs below $25k, 86.6% for AGIs $25k-50k, 81.2% for AGIs $50k-75k, 79.7% for AGIs $75k-100k, 54.0% for AGIs $100k-200k, 14.4% for AGIs over 200k)
Taxable interest for individuals: $2,114 (reported on 23.7% of returns)
This zip code:
$2,114
Texas:
$2,372
(% of AGI for various income ranges: 1.0% for AGIs below $25k, 0.4% for AGIs $25k-50k, 0.7% for AGIs $50k-75k, 0.6% for AGIs $75k-100k, 0.9% for AGIs $100k-200k, 1.6% for AGIs over 200k)
Ordinary dividends: $6,671 (reported on 9.6% of returns)
Here:
$6,671
State:
$9,721
(% of AGI for various income ranges: 0.6% for AGIs below $25k, 0.5% for AGIs $25k-50k, 0.7% for AGIs $50k-75k, 0.3% for AGIs $75k-100k, 0.9% for AGIs $100k-200k, 2.8% for AGIs over 200k)
Net capital gain/loss in AGI: +$22,995 (reported on 9.4% of returns)
Here:
+$22,995
State:
+$35,319
(% of AGI for various income ranges: 0.3% for AGIs below $25k, 0.4% for AGIs $25k-50k, 0.7% for AGIs $50k-75k, 1.0% for AGIs $75k-100k, 5.5% for AGIs $100k-200k, 10.4% for AGIs over 200k)
Profit/loss from business: +$13,316 (reported on 15.6% of returns)
Here:
+$13,316
State:
+$13,732
(% of AGI for various income ranges: 4.9% for AGIs below $25k, 1.9% for AGIs $25k-50k, 2.3% for AGIs $50k-75k, 2.1% for AGIs $75k-100k, 4.9% for AGIs $100k-200k, 5.7% for AGIs over 200k)
Taxable individual retirement arrangement distribution: $10,473 (reported on 5.5% of returns)
79331:
$10,473
Texas:
$19,511
(% of AGI for various income ranges: 1.6% for AGIs below $25k, 0.9% for AGIs $25k-50k, 0.8% for AGIs $50k-75k, 0.8% for AGIs $75k-100k, 1.9% for AGIs $100k-200k, 0.7% for AGIs over 200k)
Self-employment retirement plans: $27,200 (reported on 0.4% of returns)
79331:
$27,200
Texas:
$23,938
Total itemized deductions: $22,635 (16% of AGI, reported on 11.5% of returns)
Here:
$22,635
State:
$24,724
Here:
15.6% of AGI
State:
15.9% of AGI
(% of AGI for various income ranges: 4.2% for AGIs below $25k, 3.4% for AGIs $25k-50k, 5.0% for AGIs $50k-75k, 3.8% for AGIs $75k-100k, 6.1% for AGIs $100k-200k, 5.4% for AGIs over 200k)
Charity contributions: $8,329 (reported on 9.6% of returns)
Here:
$8,329
State:
$6,808
(% of AGI for various income ranges: 0.4% for AGIs below $25k, 0.6% for AGIs $25k-50k, 1.0% for AGIs $50k-75k, 1.1% for AGIs $75k-100k, 2.3% for AGIs $100k-200k, 2.3% for AGIs over 200k)
Taxes paid: $3,967 (reported on 11.5% of returns)
79331:
$3,967
State:
$6,921
(% of AGI for various income ranges: 0.5% for AGIs below $25k, 0.4% for AGIs $25k-50k, 0.9% for AGIs $50k-75k, 0.6% for AGIs $75k-100k, 1.3% for AGIs $100k-200k, 1.0% for AGIs over 200k)
Earned income credit: $2,558 (reported on 29.0% of returns)
Here:
$2,558
State:
$2,570
(% of AGI for various income ranges: 10.9% for AGIs below $25k, 1.7% for AGIs $25k-50k)
Percentage of individuals using paid preparers for their 2012 taxes: 72.1%
Here:
72%
State:
51%
(% for various income ranges: 69.3% for AGIs below $25k, 69.0% for AGIs $25k-50k, 73.0% for AGIs $50k-75k, 71.1% for AGIs $75k-100k, 87.2% for AGIs $100k-200k, 92.9% for AGIs over 200k)
Averages for the 2004 tax year for zip code 79331, filed in 2005:
Average Adjusted Gross Income (AGI) in 2004: $31,327 (Individual Income Tax Returns)
Here:
$31,327
State:
$47,881
Salary/wage: $24,501 (reported on 84.1% of returns)
Here:
$24,501
State:
$41,947
(% of AGI for various income ranges: 150.0% for AGIs below $10k, 83.7% for AGIs $10k-25k, 81.2% for AGIs $25k-50k, 70.7% for AGIs $50k-75k, 61.5% for AGIs $75k-100k, 25.9% for AGIs over 100k)
Taxable interest for individuals: $2,474 (reported on 27.6% of returns)
This zip code:
$2,474
Texas:
$2,255
(% of AGI for various income ranges: 6.3% for AGIs below $10k, 1.8% for AGIs $10k-25k, 1.5% for AGIs $25k-50k, 1.4% for AGIs $50k-75k, 1.2% for AGIs $75k-100k, 3.8% for AGIs over 100k)
Taxable dividends: $4,441 (reported on 11.1% of returns)
Here:
$4,441
State:
$4,261
(% of AGI for various income ranges: 1.5% for AGIs below $10k, 0.7% for AGIs $10k-25k, 0.5% for AGIs $25k-50k, 0.7% for AGIs $50k-75k, 0.9% for AGIs $75k-100k, 4.3% for AGIs over 100k)
Net capital gain/loss: +$7,113 (reported on 10.5% of returns)
Here:
+$7,113
State:
+$16,110
(% of AGI for various income ranges: 1.0% for AGIs below $10k, 0.1% for AGIs $10k-25k, 0.2% for AGIs $25k-50k, 0.8% for AGIs $50k-75k, 2.1% for AGIs $75k-100k, 7.7% for AGIs over 100k)
Profit/loss from business: +$7,223 (reported on 16.4% of returns)
Here:
+$7,223
State:
+$11,013
(% of AGI for various income ranges: 6.0% for AGIs below $10k, 3.7% for AGIs $10k-25k, 3.0% for AGIs $25k-50k, 3.9% for AGIs $50k-75k, 2.3% for AGIs $75k-100k, 5.0% for AGIs over 100k)
Profit/loss from farming: +$14,278 (reported on 7.4% of returns)
Here:
+$14,278
State:
-$9,403
(% of AGI for various income ranges: -34.3% for AGIs below $10k, 0.3% for AGIs $10k-25k, -0.3% for AGIs $25k-50k, 3.9% for AGIs $50k-75k, 8.9% for AGIs $75k-100k, 10.6% for AGIs over 100k)
IRA payment deduction: $3,973 (reported on 1.6% of returns)
79331:
$3,973
Texas:
$3,120
(% of AGI for various income ranges: 0.2% for AGIs $25k-50k, 0.3% for AGIs $50k-75k, 0.3% for AGIs $75k-100k, 0.2% for AGIs over 100k)
Self-employed pension: $11,769 (reported on 0.6% of returns)
Here:
$11,769
Texas:
$16,401
Total itemized deductions: $16,536 (22% of AGI, reported on 11.1% of returns)
Here:
$16,536
State:
$19,631
Here:
21.8% of AGI
State:
18.9% of AGI
(% of AGI for various income ranges: 8.4% for AGIs below $10k, 5.2% for AGIs $10k-25k, 4.2% for AGIs $25k-50k, 5.9% for AGIs $50k-75k, 7.6% for AGIs $75k-100k, 6.9% for AGIs over 100k)
Charity contributions deductions: $6,102 (7% of AGI, reported on 9.5% of returns)
Here:
$6,102
State:
$4,753
Here:
7.5% of AGI
State:
4.2% of AGI
(% of AGI for various income ranges: 1.0% for AGIs below $10k, 1.0% for AGIs $10k-25k, 0.9% for AGIs $25k-50k, 1.8% for AGIs $50k-75k, 2.4% for AGIs $75k-100k, 3.3% for AGIs over 100k)
Total tax: $5,686 (reported on 58.8% of returns)
79331:
$5,686
State:
$9,058
(% of AGI for various income ranges: 3.9% for AGIs below $10k, 3.0% for AGIs $10k-25k, 6.0% for AGIs $25k-50k, 9.6% for AGIs $50k-75k, 12.5% for AGIs $75k-100k, 21.6% for AGIs over 100k)
Earned income credit: $2,004 (reported on 35.5% of returns)
Here:
$2,004
State:
$2,024
Percentage of individuals using paid preparers for their 2004 taxes: 78.8%
Here:
79%
State:
57%
(% for various income ranges: 77.2% for AGIs below $10k, 80.6% for AGIs $10k-25k, 77.4% for AGIs $25k-50k, 75.0% for AGIs $50k-75k, 81.9% for AGIs $75k-100k, 89.9% for AGIs over 100k)
Likely homosexual households (counted as self-reported same-sex unmarried-partner households)
Lesbian couples: 0.2% of all households
Gay men: 0.0% of all households
Household received Food Stamps/SNAP in the past 12 months: 764 Household did not receive Food Stamps/SNAP in the past 12 months: 3,399
Women who had a birth in the past 12 months: 139 (76 now married, 61 unmarried) Women who did not have a birth in the past 12 months: 2,048 (954 now married, 1,092 unmarried)
Housing units in zip code 79331 with a mortgage: 1,097 (10 second mortgage, 11 both second mortgage and home equity loan) Houses without a mortgage: 24
Median monthly owner costs for units with a mortgage: $1,256 Median monthly owner costs for units without a mortgage: $428
Residents with income below the poverty level in 2022:
This zip code:
25.5%
Whole state:
14.0%
Residents with income below 50% of the poverty level in 2022:
This zip code:
13.2%
Whole state:
7.4%
Median number of rooms in houses and condos:
Here:
5.9
State:
6.3
Median number of rooms in apartments:
Here:
4.2
State:
4.0
Notable locations in this zip code not listed on our city pages
Notable locations in zip code 79331: Budwizer Windmill (A), Dynamite Windmill (B), East Windmill (C), Falkner Windmill (D), Lamesa Farm Workers Community Historic District (E), North Camp Windmill (F), Oil Well Windmill (G), Old L Seven Ranch (H), Scharbauer Ranch (I), Stepherson Windmill (J), Wheeler Windmill (K), Los Ybanez Volunteer Fire Department (L), Lamesa Fire Department Central Station (M), Lamesa Fire Department Northern Station (N), Dawson County Emergency Medical Services - Hill Corporation (O), Dal Paso Museum (P). Display/hide their locations on the map
Churches in zip code 79331 include: Harvest Community Church of Lamesa (A), First Presbyterian Church (B), Calvary United Pentecostal Church (C), Northridge Methodist Church (D), First United Methodist Church (E), Saint John Episcopal Church (F), Saint Margaret Mary Catholic Church Convent (G), Sunset Baptist Church (H), Second Baptist Church (I). Display/hide their locations on the map
In group quarters: 1,787 (-1 institutionalized population)
Size of family households: 1,023 2-persons, 631 3-persons, 604 4-persons, 140 5-persons, 79 6-persons, 68 7-or-more-persons
Size of nonfamily households: 1,402 1-person, 215 2-persons
1,314 married couples with children.
976 single-parent households (313 men, 663 women).
64.1% of residents of 79331 zip code speak English at home.
34.0% of residents speak Spanish at home (79% very well, 14% well, 5% not well, 2% not at all).
1.8% of residents speak other Indo-European language at home (35% very well, 48% well, 18% not well).
0.3% of residents speak Asian or Pacific Island language at home (100% very well).
0.2% of residents speak other language at home (35% very well, 65% well).
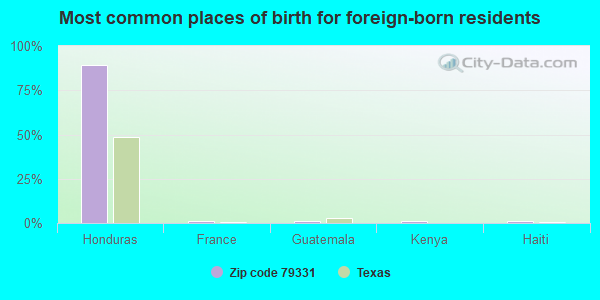
Foreign born population: 624 (5.2%) (38.6% of them are naturalized citizens)
This zip code:
5.2%
Whole state:
17.2%
89%Honduras
1%France
1%Guatemala
1%Kenya
1%Haiti
1%Russia
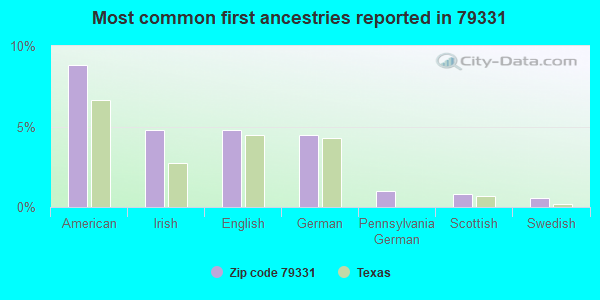
9%American
5%Irish
5%English
4%German
1%Pennsylvania German
1%Scottish
1%Swedish
Year of entry for the foreign-born population
1392010 or later
2062000 to 2009
771990 to 1999
218Before 1990
Facilities with environmental interests located in this zip code:
AMERICAN TELEPHONE AND TELEGRAPH CO LONG (STAR ROUTE 4 in LAMESA, TX)
(Resource Conservation and Recovery Act (tracking hazardous waste)) Alternative names: AMERICAN TEL & TEL CO LONG LINES
AUTOMATED CONTROLS (NE 14TH ST (RR 2B, BOX 12) in LAMESA, TX)
COMPLIANCE ACTIVITY (Tracking inspections of insecticide, fungicide, and rodenticide, and toxic substances) Business SIC classification: MOTORS AND GENERATORS
Housing units lacking complete plumbing facilities: 1.0% Housing units lacking complete kitchen facilities: 5.0%
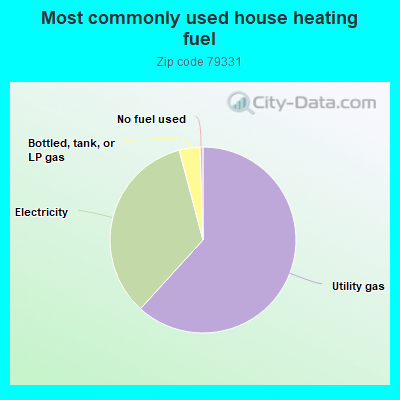
61.5%Utility gas
34.0%Electricity
3.6%Bottled, tank, or LP gas
0.5%No fuel used
Population in 1990: 12,989. Population change in the 1990s: +1,283 (+9.9%).
Place of birth for U.S.-born residents:
This state: 10,002
Northeast: 146
Midwest: 311
South: 309
West: 395
58% of the 79331 zip code residents lived in the same house 5 years ago. Out of people who lived in different houses, 42% lived in this county. Out of people who lived in different counties, 50% lived in Texas.
80% of the 79331 zip code residents lived in the same house 1 year ago. Out of people who lived in different houses, 23% moved from this county. Out of people who lived in different houses, 67% moved from different county within same state. Out of people who lived in different houses, 4% moved from different state. Out of people who lived in different houses, 7% moved from abroad.
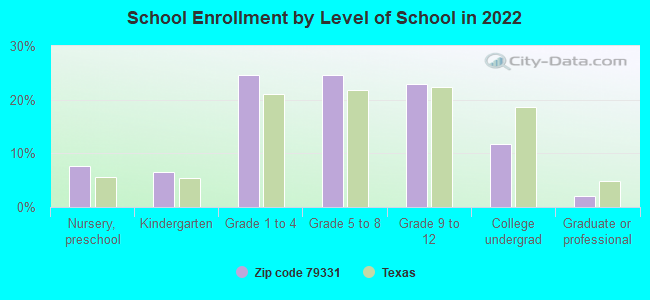
Private vs. public school enrollment:
Students in private schools in grades 1 to 8 (elementary and middle school): 19
Here:
1.3%
Texas:
8.8%
Students in private schools in grades 9 to 12 (high school): 32
Here:
4.7%
Texas:
8.0%
Students in private undergraduate colleges: 47
Here:
13.7%
Texas:
16.2%
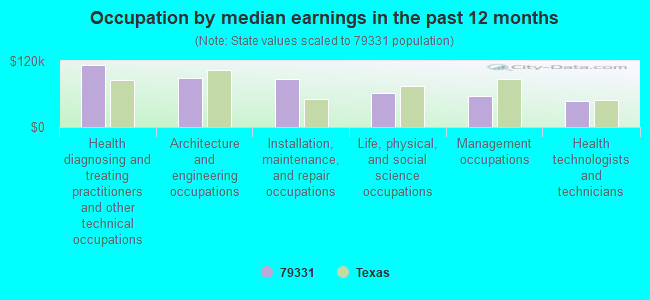
Occupation by median earnings in the past 12 months ($)
112,864Health diagnosing and treating practitioners and other technical occupations
88,359Architecture and engineering occupations
87,795Installation, maintenance, and repair occupations
61,342Life, physical, and social science occupations
57,124Management occupations
46,794Health technologists and technicians
Top industries in this zip code by the number of employees in 2005:
Finance and Insurance: Commercial Banking (20-49: 2)
People in group quarters in 2010:
2,060 people in state prisons
46 people in nursing facilities/skilled-nursing facilities
16 people in hospitals with patients who have no usual home elsewhere
12 people in workers' group living quarters and job corps centers
8 people in group homes intended for adults
4 people in group homes for juveniles (non-correctional)
People in group quarters in 2000:
2,158 people in other types of correctional institutions
68 people in nursing homes
30 people in local jails and other confinement facilities (including police lockups)
13 people in wards in general hospitals for patients who have no usual home elsewhere
3 people in homes or halfway houses for drug/alcohol abuse
Fatal accident statistics in 2014:
Fatal accident count: 4
Vehicles involved in fatal accidents: 6
Fatal accidents caused by drunken drivers: 0
Fatalities: 7
Persons involved in fatal accidents: 10
Pedestrians involved in fatal accidents: 0
Fatal accident statistics in 2013:
Fatal accident count: 3
Vehicles involved in fatal accidents: 5
Fatal accidents caused by drunken drivers: 2
Fatalities: 4
Persons involved in fatal accidents: 13
Pedestrians involved in fatal accidents: 1
2002 - 2018 National Fire Incident Reporting System (NFIRS) incidents
According to the data from the years 2002 - 2018 the average number of fire incidents per year is 99. The highest number of reported fires - 172 took place in 2008, and the least - 57 in 2013. The data has a rising trend.
When looking into fire subcategories, the most reports belonged to: Outside Fires (65.1%), and Structure Fires (14.9%).
Fire incident types reported to NFIRS in Zip Code 79331


+$14,278
-$9,403
(% of AGI for various income ranges: -34.3% for AGIs below $10k, 0.3% for AGIs $10k-25k, -0.3% for AGIs $25k-50k, 3.9% for AGIs $50k-75k, 8.9% for AGIs $75k-100k, 10.6% for AGIs over 100k) Nearest zip codes: 79377, 79713, 79351, 79783, 79342, 79749.
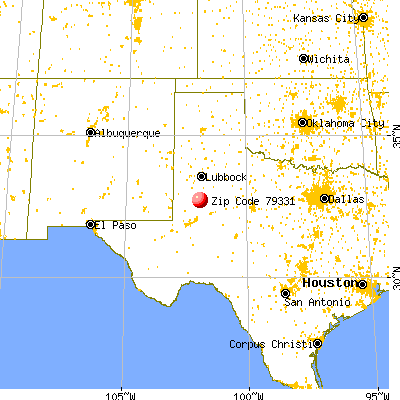
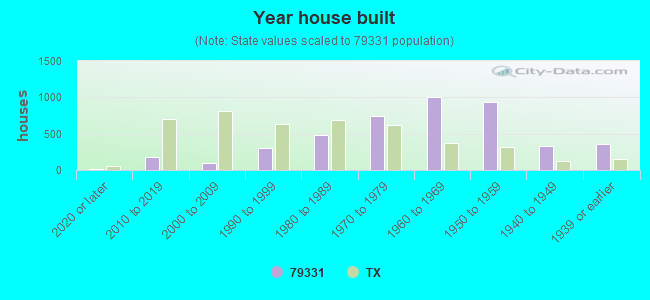


 According to the data from the years 2002 - 2018 the average number of fire incidents per year is 99. The highest number of reported fires - 172 took place in 2008, and the least - 57 in 2013. The data has a rising trend.
 When looking into fire subcategories, the most reports belonged to: Outside Fires (65.1%), and Structure Fires (14.9%).