Estimated zip code population in 2022: 1,551 Zip code population in 2010: 1,764 Zip code population in 2000: 1,765
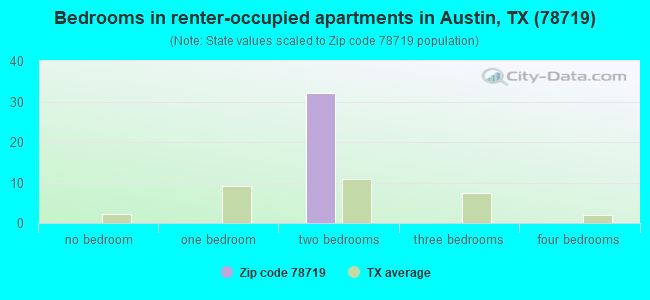
Houses and condos: 609 Renter-occupied apartments: 32
% of renters here:
6%
State:
38%
March 2022 cost of living index in zip code 78719: 77.3 (low, U.S. average is 100)
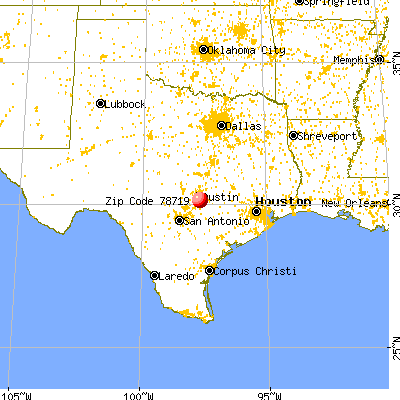
Land area: 18.7 sq. mi. Water area: 0.0 sq. mi.
Population density: 83 people per square mile
(very low).
OSM Map
General Map
Google Map
MSN Map
OSM Map
General Map
Google Map
MSN Map
OSM Map
General Map
Google Map
MSN Map
OSM Map
General Map
Google Map
MSN Map
Please wait while loading the map...
Real estate property taxes paid for housing units in 2022:
This zip code:
1.6% ($2,353)
Texas:
1.5% ($4,050)
Median real estate property taxes paid for housing units with mortgages in 2022: $2,298 (1.5%) Median real estate property taxes paid for housing units with no mortgage in 2022: $2,422 (1.6%)
Business Search- 14 Million verified businesses
Males: 836
(53.9%)
Females: 715
(46.1%)
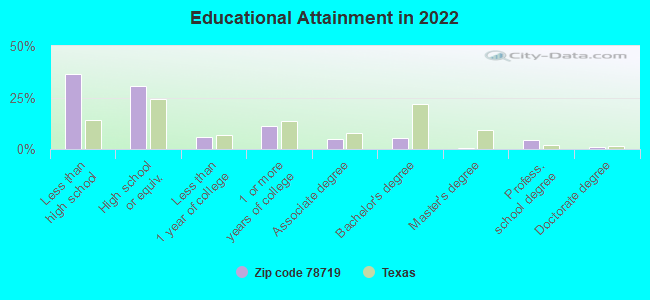
For population 25 years and over in 78719:
High school or higher: 63.0%
Bachelor's degree or higher: 11.1%
Graduate or professional degree: 5.9%
Unemployed: 0.4%
Mean travel time to work (commute): 31.3 minutes
For population 15 years and over in 78719:
Never married: 26.3%
Now married: 54.9%
Separated: 1.0%
Widowed: 8.3%
Divorced: 9.5%
Zip code 78719 compared to state average:
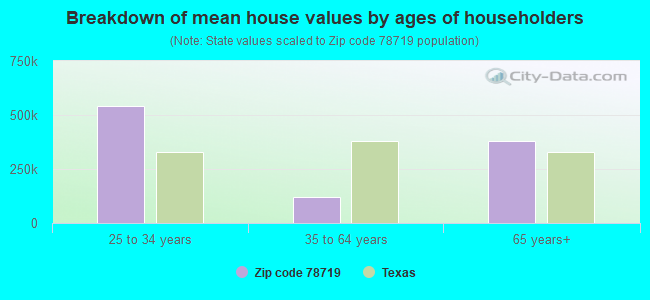
Median house value below state average.
Unemployed percentage significantly below state average.
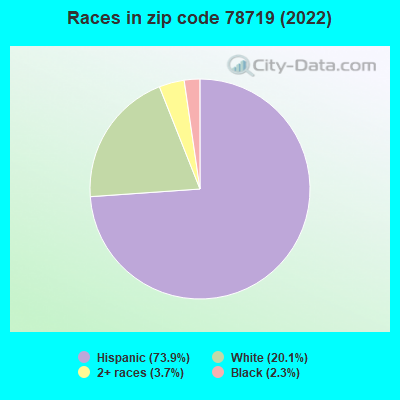
Black race population percentage significantly below state average.
Hispanic race population percentage above state average.
Median age significantly above state average.
Foreign-born population percentage significantly above state average.
Renting percentage significantly below state average.
Length of stay since moving in significantly above state average.
Number of college students below state average.
Percentage of population with a bachelor's degree or higher significantly below state average.
Averages for the 2020 tax year for zip code 78719, filed in 2021:
Average Adjusted Gross Income (AGI) in 2020: $38,240 (Individual Income Tax Returns)
Here:
$38,240
State:
$77,054
Salary/wage: $37,476 (reported on 77.6% of returns)
Here:
$37,476
State:
$62,766
(% of AGI for various income ranges: 1078.7% for AGIs below $25k, 3591.8% for AGIs $25k-50k, 7303.7% for AGIs $50k-75k, 9538.0% for AGIs $75k-100k, 18695.0% for AGIs $100k-200k)
Taxable interest for individuals: $333 (reported on 10.6% of returns)
This zip code:
$333
Texas:
$2,665
(% of AGI for various income ranges: 4.8% for AGIs below $25k, 3.8% for AGIs $50k-75k, 32.0% for AGIs $75k-100k)
Ordinary dividends: $1,433 (reported on 3.5% of returns)
Here:
$1,433
State:
$10,044
(% of AGI for various income ranges: 19.5% for AGIs $25k-50k)
Net capital gain/loss in AGI: +$2,033 (reported on 3.5% of returns)
Here:
+$2,033
State:
+$39,590
(% of AGI for various income ranges: 27.7% for AGIs $25k-50k)
Profit/loss from business: +$15,624 (reported on 24.7% of returns)
Here:
+$15,624
State:
+$10,888
(% of AGI for various income ranges: 476.1% for AGIs below $25k, 556.8% for AGIs $25k-50k, 1201.2% for AGIs $50k-75k)
Earned income credit: $2,941 (reported on 25.9% of returns)
Here:
$2,941
State:
$2,584
(% of AGI for various income ranges: 182.2% for AGIs below $25k, 103.6% for AGIs $25k-50k)
Percentage of individuals using paid preparers for their 2020 taxes: 85.9%
Here:
86%
State:
92%
(% for various income ranges: 84.8% for AGIs below $25k, 89.3% for AGIs $25k-50k, 84.6% for AGIs $50k-75k, 85.7% for AGIs $75k-100k, 75.0% for AGIs $100k-200k)
Averages for the 2012 tax year for zip code 78719, filed in 2013:
Average Adjusted Gross Income (AGI) in 2012: $31,337 (Individual Income Tax Returns)
Here:
$31,337
State:
$65,384
Salary/wage: $29,358 (reported on 81.6% of returns)
Here:
$29,358
State:
$52,524
(% of AGI for various income ranges: 71.0% for AGIs below $25k, 83.4% for AGIs $25k-50k, 72.5% for AGIs $50k-75k, 73.3% for AGIs $75k-100k)
Taxable interest for individuals: $989 (reported on 11.8% of returns)
This zip code:
$989
Texas:
$2,372
Ordinary dividends: $1,233 (reported on 3.9% of returns)
Here:
$1,233
State:
$9,721
Net capital gain/loss in AGI: +$750 (reported on 2.6% of returns)
Here:
+$750
State:
+$35,319
Profit/loss from business: +$11,582 (reported on 22.4% of returns)
Here:
+$11,582
State:
+$13,732
(% of AGI for various income ranges: 18.8% for AGIs below $25k, 7.5% for AGIs $25k-50k, 6.1% for AGIs $50k-75k)
Taxable individual retirement arrangement distribution: $4,400 (reported on 2.6% of returns)
78719:
$4,400
Texas:
$19,511
Total itemized deductions: $14,643 (30% of AGI, reported on 9.2% of returns)
Here:
$14,643
State:
$24,724
Here:
29.6% of AGI
State:
15.9% of AGI
Charity contributions: $1,867 (reported on 3.9% of returns)
Here:
$1,867
State:
$6,808
Taxes paid: $3,817 (reported on 7.9% of returns)
78719:
$3,817
State:
$6,921
Earned income credit: $2,668 (reported on 32.9% of returns)
Here:
$2,668
State:
$2,570
(% of AGI for various income ranges: 9.6% for AGIs below $25k, 1.6% for AGIs $25k-50k)
Percentage of individuals using paid preparers for their 2012 taxes: 48.7%
Here:
49%
State:
51%
(% for various income ranges: 48.7% for AGIs below $25k, 48.0% for AGIs $25k-50k, 57.1% for AGIs $50k-75k, 40.0% for AGIs $75k-100k)
Averages for the 2004 tax year for zip code 78719, filed in 2005:
Average Adjusted Gross Income (AGI) in 2004: $28,073 (Individual Income Tax Returns)
Here:
$28,073
State:
$47,881
Salary/wage: $26,465 (reported on 87.3% of returns)
Here:
$26,465
State:
$41,947
(% of AGI for various income ranges: 83.5% for AGIs below $10k, 82.9% for AGIs $10k-25k, 88.6% for AGIs $25k-50k, 77.3% for AGIs $50k-75k, 73.7% for AGIs $75k-100k)
Taxable interest for individuals: $504 (reported on 19.2% of returns)
This zip code:
$504
Texas:
$2,255
(% of AGI for various income ranges: 0.4% for AGIs $10k-25k, 0.2% for AGIs $25k-50k, 0.3% for AGIs $50k-75k, 0.6% for AGIs $75k-100k)
Taxable dividends: $167 (reported on 4.5% of returns)
Here:
$167
State:
$4,261
Net capital gain/loss: +$2,391 (reported on 3.5% of returns)
Here:
+$2,391
State:
+$16,110
Profit/loss from business: +$8,158 (reported on 15.3% of returns)
Here:
+$8,158
State:
+$11,013
(% of AGI for various income ranges: 19.2% for AGIs below $10k, 8.3% for AGIs $10k-25k, 4.9% for AGIs $25k-50k, 0.9% for AGIs $50k-75k)
Total itemized deductions: $13,319 (28% of AGI, reported on 10.5% of returns)
Here:
$13,319
State:
$19,631
Here:
27.6% of AGI
State:
18.9% of AGI
(% of AGI for various income ranges: 4.2% for AGIs $10k-25k, 3.5% for AGIs $25k-50k, 7.4% for AGIs $50k-75k, 7.0% for AGIs $75k-100k)
Charity contributions deductions: $2,189 (4% of AGI, reported on 8.0% of returns)
Here:
$2,189
State:
$4,753
Here:
4.1% of AGI
State:
4.2% of AGI
(% of AGI for various income ranges: 2.1% for AGIs below $10k, 0.3% for AGIs $25k-50k, 1.3% for AGIs $50k-75k, 1.0% for AGIs $75k-100k)
Total tax: $2,880 (reported on 65.5% of returns)
78719:
$2,880
State:
$9,058
(% of AGI for various income ranges: 3.5% for AGIs below $10k, 3.6% for AGIs $10k-25k, 5.4% for AGIs $25k-50k, 8.5% for AGIs $50k-75k, 11.7% for AGIs $75k-100k)
Earned income credit: $1,873 (reported on 29.8% of returns)
Here:
$1,873
State:
$2,024
Percentage of individuals using paid preparers for their 2004 taxes: 52.7%
Here:
53%
State:
57%
(% for various income ranges: 44.4% for AGIs below $10k, 60.7% for AGIs $10k-25k, 54.0% for AGIs $25k-50k, 45.9% for AGIs $50k-75k, 37.8% for AGIs $75k-100k)
Household received Food Stamps/SNAP in the past 12 months: 17 Household did not receive Food Stamps/SNAP in the past 12 months: 538
Women who had a birth in the past 12 months: 24 (12 now married, 11 unmarried) Women who did not have a birth in the past 12 months: 232 (123 now married, 108 unmarried)
Housing units in zip code 78719 with a mortgage: 88 Houses without a mortgage: 13
Median monthly owner costs for units with a mortgage: $1,201 Median monthly owner costs for units without a mortgage: $642
Residents with income below the poverty level in 2022:
This zip code:
9.5%
Whole state:
14.0%
Residents with income below 50% of the poverty level in 2022:
This zip code:
8.0%
Whole state:
7.4%
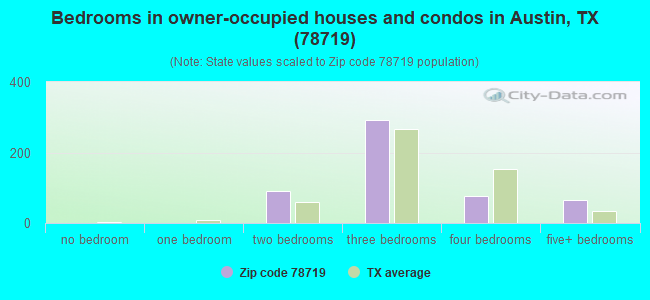
Median number of rooms in houses and condos:
Here:
5.8
State:
6.3
Notable locations in this zip code not listed on our city pages
Size of family households: 104 2-persons, 203 3-persons, 66 4-persons, 32 5-persons, 21 7-or-more-persons
Size of nonfamily households: 117 1-person, 11 2-persons
100 married couples with children.
0 single-parent households ().
40.8% of residents of 78719 zip code speak English at home.
56.9% of residents speak Spanish at home (58% very well, 23% well, 14% not well, 5% not at all).
2.1% of residents speak other Indo-European language at home (100% very well).
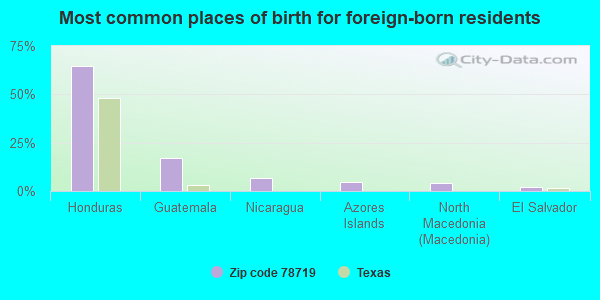
Foreign born population: 580 (37.4%) (37.0% of them are naturalized citizens)
This zip code:
37.4%
Whole state:
17.2%
65%Honduras
17%Guatemala
7%Nicaragua
5%Azores Islands
4%North Macedonia (Macedonia)
2%El Salvador
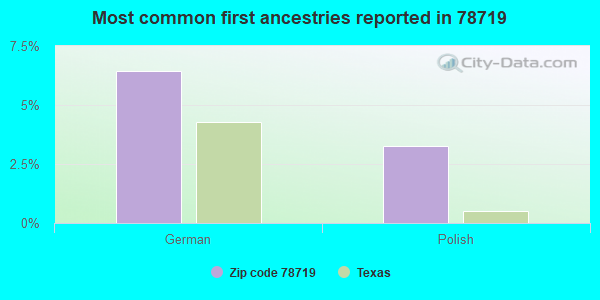
6%German
3%Polish
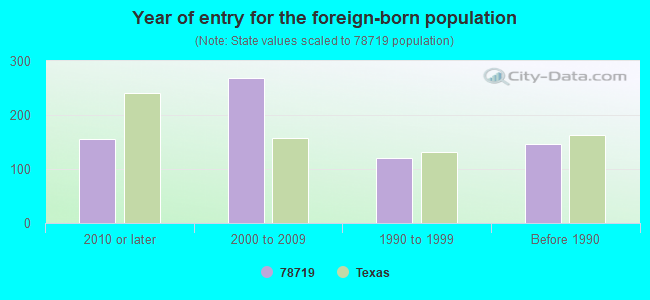
Year of entry for the foreign-born population
1562010 or later
2692000 to 2009
1201990 to 1999
147Before 1990
Facilities with environmental interests located in this zip code:
AUSTIN GATEWAY (9401 CARGO AVENUE BAY F in AUSTIN, TX)
Conditionally Exempt Small Quantity Generators, less than 100 kg/month of hazardous waste (Resource Conservation and Recovery Act (tracking hazardous waste)) - notification Organizations: UNITED PARCEL SERVICE (CONTACT/OWNER)
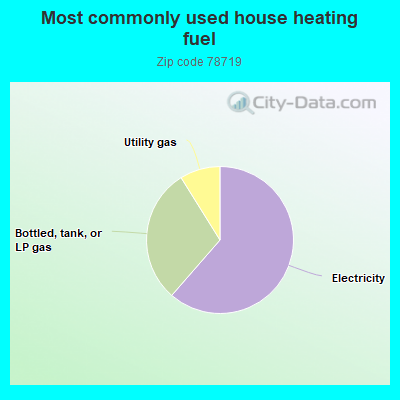
61.6%Electricity
29.8%Bottled, tank, or LP gas
8.9%Utility gas
Population in 1990: 5,368.
Place of birth for U.S.-born residents:
This state: 709
Northeast: 48
Midwest: 45
South: 8
West: 26
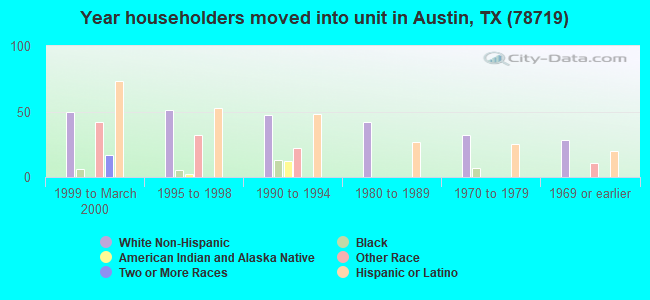
64% of the 78719 zip code residents lived in the same house 5 years ago. Out of people who lived in different houses, 75% lived in this county. Out of people who lived in different counties, 50% lived in Texas.
92% of the 78719 zip code residents lived in the same house 1 year ago. Out of people who lived in different houses, 76% moved from this county. Out of people who lived in different houses, 12% moved from different county within same state. Out of people who lived in different houses, 9% moved from different state.
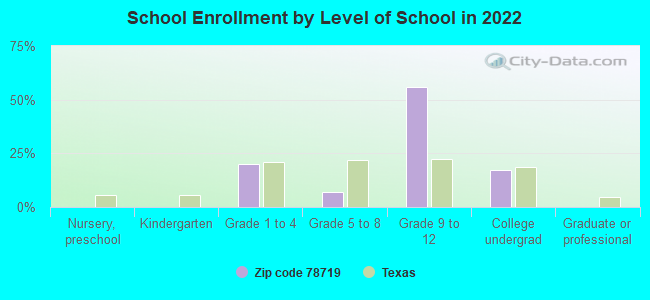
Private vs. public school enrollment:
Students in private schools in grades 1 to 8 (elementary and middle school):
Here:
0.0%
Texas:
8.8%
Students in private schools in grades 9 to 12 (high school):
Here:
0.0%
Texas:
8.0%
Students in private undergraduate colleges: 29
Here:
100.0%
Texas:
16.2%
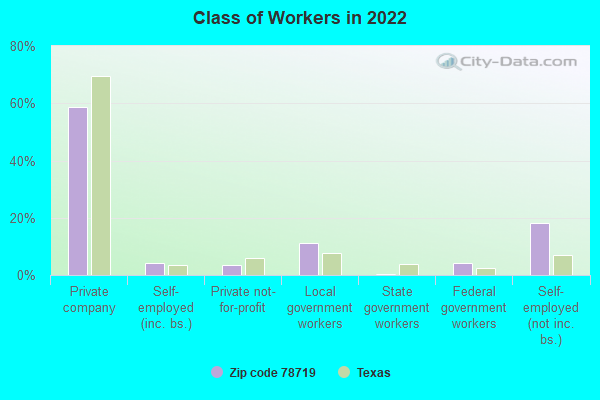
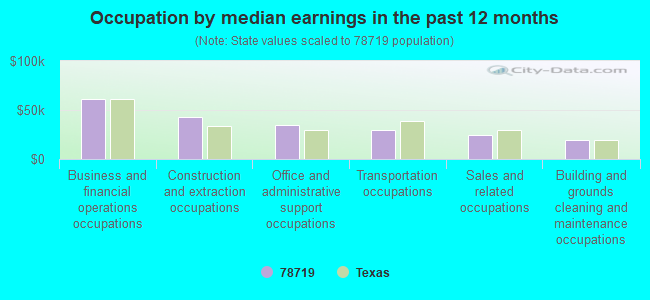
Occupation by median earnings in the past 12 months ($)
60,751Business and financial operations occupations
43,069Construction and extraction occupations
34,491Office and administrative support occupations
29,589Transportation occupations
24,324Sales and related occupations
19,651Building and grounds cleaning and maintenance occupations
Companies with federal contracts located in this zip code:
AUSTINAERO FBO LTD (4309 GENERAL AVIATION AVE in AUSTIN, TX; small business)
$1,252,800 with Defense Logistics Agency for Miscellaneous Waxes, Oils, and Fats. Signed on 2001-04-01. Completion date: 2004-03-31.
SIGNATURE FLIGHT SUPPORT CORPO (4321 GENRAL AVAITION AVE in AUSTIN, TX) : -$294,708 in 2 contractsin 1999
$0 with Defense Logistics Agency for Liquid Propellants and Fuels, Petroleum Base. Signed on 1999-10-20. Completion date: 1999-10-20.
-$294,708, same as above.Signed on 1999-10-20. Completion date: 1999-10-20.
Top industries in this zip code by the number of employees in 2005:
Real Estate and Rental and Leasing: Passenger Car Rental (50-99 employees: 1 establishment, 20-49 employees: 3 establishments, 5-9 employees: 1 establishment, 1-4 employees: 6 establishments)
Accommodation and Food Services: Hotels (except Casino Hotels) and Motels (100-249: 1)
Accommodation and Food Services: Food Service Contractors (50-99: 1, 20-49: 1)
Construction: Poured Concrete Foundation and Structure Contractors (50-99: 1)
Administrative and Support and Waste Management and Remediation Services: Solid Waste Collection (20-49: 1, 5-9: 1)
Administrative and Support and Waste Management and Remediation Services: Security Guards and Patrol Services (20-49: 1, 5-9: 1)
Fatal accident statistics in 2014:
Fatal accident count: 3
Vehicles involved in fatal accidents: 5
Fatal accidents caused by drunken drivers: 1
Fatalities: 4
Persons involved in fatal accidents: 18
Pedestrians involved in fatal accidents: 0
Fatal accident statistics in 2013:
Fatal accident count: 3
Vehicles involved in fatal accidents: 6
Fatal accidents caused by drunken drivers: 0
Fatalities: 3
Persons involved in fatal accidents: 9
Pedestrians involved in fatal accidents: 4
Home Mortgage Disclosure Act Aggregated Statistics For Year 2009 (Based on 6 partial tracts)
A) FHA, FSA/RHS & VA Home Purchase Loans
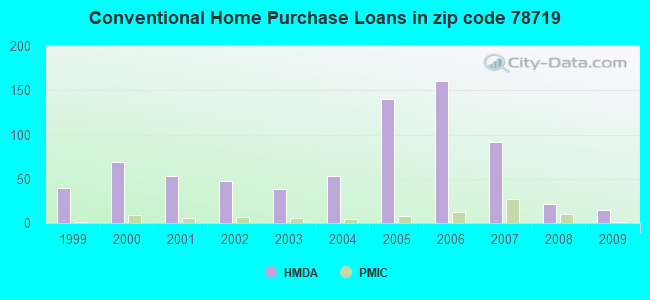
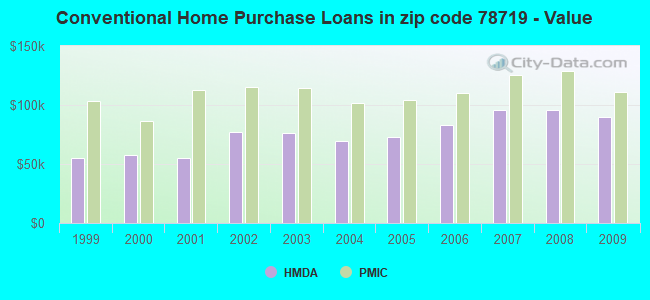
B) Conventional Home Purchase Loans
C) Refinancings
D) Home Improvement Loans
F) Non-occupant Loans on < 5 Family Dwellings (A B C & D)
G) Loans On Manufactured Home Dwelling (A B C & D)
Number
Average Value
Number
Average Value
Number
Average Value
Number
Average Value
Number
Average Value
Number
Average Value
LOANS ORIGINATED
59
$119,580
15
$89,589
23
$118,040
4
$35,135
6
$78,638
2
$46,325
APPLICATIONS APPROVED, NOT ACCEPTED
6
$103,058
1
$79,120
5
$93,760
1
$14,570
0
$0
1
$58,300
APPLICATIONS DENIED
29
$117,310
8
$86,880
33
$113,185
8
$37,954
3
$62,230
6
$60,088
APPLICATIONS WITHDRAWN
22
$115,244
4
$82,325
16
$120,908
2
$126,830
1
$125,270
1
$160,310
FILES CLOSED FOR INCOMPLETENESS
3
$104,793
0
$0
7
$115,600
0
$0
0
$0
1
$44,420
Aggregated Statistics For Year 2008 (Based on 6 partial tracts)
A) FHA, FSA/RHS & VA Home Purchase Loans
B) Conventional Home Purchase Loans
C) Refinancings
D) Home Improvement Loans
F) Non-occupant Loans on < 5 Family Dwellings (A B C & D)
G) Loans On Manufactured Home Dwelling (A B C & D)
Number
Average Value
Number
Average Value
Number
Average Value
Number
Average Value
Number
Average Value
Number
Average Value
LOANS ORIGINATED
60
$130,581
22
$95,867
24
$113,816
4
$32,358
7
$77,827
3
$59,337
APPLICATIONS APPROVED, NOT ACCEPTED
5
$109,166
5
$81,476
6
$101,323
1
$63,850
2
$80,330
6
$61,535
APPLICATIONS DENIED
27
$137,271
17
$103,252
62
$118,517
19
$30,481
6
$114,487
9
$67,929
APPLICATIONS WITHDRAWN
33
$133,530
9
$128,713
14
$118,129
2
$61,070
0
$0
1
$40,950
FILES CLOSED FOR INCOMPLETENESS
2
$153,895
1
$143,660
3
$101,093
1
$28,110
0
$0
0
$0
Aggregated Statistics For Year 2007 (Based on 6 partial tracts)
A) FHA, FSA/RHS & VA Home Purchase Loans
B) Conventional Home Purchase Loans
C) Refinancings
D) Home Improvement Loans
F) Non-occupant Loans on < 5 Family Dwellings (A B C & D)
G) Loans On Manufactured Home Dwelling (A B C & D)
Number
Average Value
Number
Average Value
Number
Average Value
Number
Average Value
Number
Average Value
Number
Average Value
LOANS ORIGINATED
47
$134,976
92
$95,448
24
$110,867
5
$41,154
18
$79,116
6
$60,437
APPLICATIONS APPROVED, NOT ACCEPTED
2
$109,130
14
$100,605
9
$90,220
0
$0
5
$99,380
3
$73,797
APPLICATIONS DENIED
12
$137,007
36
$100,341
77
$109,539
18
$37,052
7
$97,061
12
$61,998
APPLICATIONS WITHDRAWN
15
$129,399
23
$109,552
24
$109,710
0
$0
7
$102,167
2
$58,470
FILES CLOSED FOR INCOMPLETENESS
0
$0
7
$110,891
6
$110,288
0
$0
0
$0
0
$0
Aggregated Statistics For Year 2006 (Based on 6 partial tracts)
A) FHA, FSA/RHS & VA Home Purchase Loans
B) Conventional Home Purchase Loans
C) Refinancings
D) Home Improvement Loans
F) Non-occupant Loans on < 5 Family Dwellings (A B C & D)
G) Loans On Manufactured Home Dwelling (A B C & D)
Number
Average Value
Number
Average Value
Number
Average Value
Number
Average Value
Number
Average Value
Number
Average Value
LOANS ORIGINATED
35
$127,428
161
$83,233
19
$108,154
5
$27,482
28
$72,944
9
$61,998
APPLICATIONS APPROVED, NOT ACCEPTED
1
$48,580
28
$77,597
9
$85,401
2
$37,995
9
$84,956
5
$41,848
APPLICATIONS DENIED
11
$123,280
57
$80,601
64
$103,506
14
$31,478
10
$78,908
16
$63,458
APPLICATIONS WITHDRAWN
19
$126,985
46
$86,599
38
$110,867
1
$29,500
8
$71,091
1
$146,780
FILES CLOSED FOR INCOMPLETENESS
0
$0
7
$103,633
6
$115,147
0
$0
0
$0
0
$0
Aggregated Statistics For Year 2005 (Based on 6 partial tracts)
A) FHA, FSA/RHS & VA Home Purchase Loans
B) Conventional Home Purchase Loans
C) Refinancings
D) Home Improvement Loans
F) Non-occupant Loans on < 5 Family Dwellings (A B C & D)
G) Loans On Manufactured Home Dwelling (A B C & D)
Number
Average Value
Number
Average Value
Number
Average Value
Number
Average Value
Number
Average Value
Number
Average Value
LOANS ORIGINATED
45
$121,148
140
$72,908
31
$102,511
9
$38,626
27
$84,030
8
$69,398
APPLICATIONS APPROVED, NOT ACCEPTED
4
$106,650
25
$62,876
9
$99,628
2
$45,455
5
$87,560
12
$53,012
APPLICATIONS DENIED
14
$123,557
70
$69,840
76
$99,667
21
$31,610
17
$72,216
28
$50,154
APPLICATIONS WITHDRAWN
14
$125,614
35
$83,151
31
$108,029
5
$181,690
7
$93,046
2
$72,870
FILES CLOSED FOR INCOMPLETENESS
2
$115,205
4
$63,415
12
$114,712
0
$0
0
$0
0
$0
Aggregated Statistics For Year 2004 (Based on 6 partial tracts)
A) FHA, FSA/RHS & VA Home Purchase Loans
B) Conventional Home Purchase Loans
C) Refinancings
D) Home Improvement Loans
F) Non-occupant Loans on < 5 Family Dwellings (A B C & D)
G) Loans On Manufactured Home Dwelling (A B C & D)
Number
Average Value
Number
Average Value
Number
Average Value
Number
Average Value
Number
Average Value
Number
Average Value
LOANS ORIGINATED
70
$115,988
53
$69,168
50
$97,118
7
$50,711
8
$76,470
12
$60,262
APPLICATIONS APPROVED, NOT ACCEPTED
1
$121,450
10
$61,419
14
$101,621
1
$55,520
2
$82,415
8
$40,859
APPLICATIONS DENIED
18
$119,453
41
$71,994
76
$94,039
16
$30,578
3
$95,887
29
$51,488
APPLICATIONS WITHDRAWN
16
$124,341
12
$95,093
37
$92,738
5
$80,402
4
$75,170
3
$66,277
FILES CLOSED FOR INCOMPLETENESS
1
$187,730
2
$98,375
13
$99,771
0
$0
0
$0
0
$0
Aggregated Statistics For Year 2003 (Based on 6 partial tracts)
A) FHA, FSA/RHS & VA Home Purchase Loans
B) Conventional Home Purchase Loans
C) Refinancings
D) Home Improvement Loans
F) Non-occupant Loans on < 5 Family Dwellings (A B C & D)
Number
Average Value
Number
Average Value
Number
Average Value
Number
Average Value
Number
Average Value
LOANS ORIGINATED
54
$118,456
38
$75,898
71
$101,589
6
$17,498
10
$85,556
APPLICATIONS APPROVED, NOT ACCEPTED
3
$112,773
7
$64,443
10
$107,431
4
$69,835
0
$0
APPLICATIONS DENIED
37
$120,869
31
$60,731
85
$82,913
20
$17,610
3
$54,017
APPLICATIONS WITHDRAWN
39
$122,002
9
$81,583
53
$101,490
1
$11,100
2
$62,285
FILES CLOSED FOR INCOMPLETENESS
1
$101,670
2
$137,760
3
$102,250
0
$0
0
$0
Aggregated Statistics For Year 2002 (Based on 6 partial tracts)
A) FHA, FSA/RHS & VA Home Purchase Loans
B) Conventional Home Purchase Loans
C) Refinancings
D) Home Improvement Loans
F) Non-occupant Loans on < 5 Family Dwellings (A B C & D)
Number
Average Value
Number
Average Value
Number
Average Value
Number
Average Value
Number
Average Value
LOANS ORIGINATED
131
$135,111
47
$76,852
44
$90,667
13
$9,502
3
$46,383
APPLICATIONS APPROVED, NOT ACCEPTED
2
$102,540
31
$43,538
16
$66,859
5
$53,436
0
$0
APPLICATIONS DENIED
13
$123,638
74
$48,910
46
$70,958
35
$18,363
3
$52,627
APPLICATIONS WITHDRAWN
140
$132,098
21
$107,952
30
$86,374
3
$14,573
2
$90,740
FILES CLOSED FOR INCOMPLETENESS
14
$137,288
3
$119,713
2
$77,380
0
$0
0
$0
Aggregated Statistics For Year 2001 (Based on 6 partial tracts)
A) FHA, FSA/RHS & VA Home Purchase Loans
B) Conventional Home Purchase Loans
C) Refinancings
D) Home Improvement Loans
F) Non-occupant Loans on < 5 Family Dwellings (A B C & D)
Number
Average Value
Number
Average Value
Number
Average Value
Number
Average Value
Number
Average Value
LOANS ORIGINATED
66
$120,439
53
$55,308
33
$94,260
13
$13,933
8
$67,099
APPLICATIONS APPROVED, NOT ACCEPTED
7
$115,154
23
$53,136
7
$53,786
3
$35,280
2
$46,500
APPLICATIONS DENIED
8
$121,276
102
$49,195
26
$82,988
19
$17,343
4
$39,125
APPLICATIONS WITHDRAWN
34
$129,747
10
$83,864
26
$94,452
3
$23,827
1
$26,720
FILES CLOSED FOR INCOMPLETENESS
25
$131,763
3
$119,253
3
$122,607
1
$26,370
0
$0
Aggregated Statistics For Year 2000 (Based on 6 partial tracts)
A) FHA, FSA/RHS & VA Home Purchase Loans
B) Conventional Home Purchase Loans
C) Refinancings
D) Home Improvement Loans
F) Non-occupant Loans on < 5 Family Dwellings (A B C & D)
Number
Average Value
Number
Average Value
Number
Average Value
Number
Average Value
Number
Average Value
LOANS ORIGINATED
24
$86,266
69
$57,589
12
$75,617
4
$19,345
5
$51,218
APPLICATIONS APPROVED, NOT ACCEPTED
5
$57,370
31
$50,446
5
$38,552
1
$25,330
0
$0
APPLICATIONS DENIED
11
$82,775
117
$46,265
15
$46,470
9
$19,663
6
$32,965
APPLICATIONS WITHDRAWN
12
$81,612
6
$67,492
5
$65,444
1
$6,590
1
$16,310
FILES CLOSED FOR INCOMPLETENESS
1
$64,890
2
$89,875
6
$68,822
0
$0
0
$0
Aggregated Statistics For Year 1999 (Based on 3 partial tracts)
A) FHA, FSA/RHS & VA Home Purchase Loans
B) Conventional Home Purchase Loans
C) Refinancings
D) Home Improvement Loans
F) Non-occupant Loans on < 5 Family Dwellings (A B C & D)
Detailed PMIC statistics for the following Tracts:0023.03
, 0024.16
2002 - 2018 National Fire Incident Reporting System (NFIRS) incidents
Based on the data from the years 2002 - 2018 the average number of fire incidents per year is 9. The highest number of reported fires - 21 took place in 2014, and the least - 2 in 2004. The data has a dropping trend.
When looking into fire subcategories, the most incidents belonged to: Outside Fires (49.7%), and Mobile Property/Vehicle Fires (26.8%).
Fire incident types reported to NFIRS in Zip Code 78719


 Nearest zip codes: 78744, 78741, 78742, 78747, 78617, 78702.


 Based on the data from the years 2002 - 2018 the average number of fire incidents per year is 9. The highest number of reported fires - 21 took place in 2014, and the least - 2 in 2004. The data has a dropping trend.
 When looking into fire subcategories, the most incidents belonged to: Outside Fires (49.7%), and Mobile Property/Vehicle Fires (26.8%).