Estimated zip code population in 2022: 30,030
Zip code population in 2010: 22,210
Zip code population in 2000: 15,227
Houses and condos: 8,936
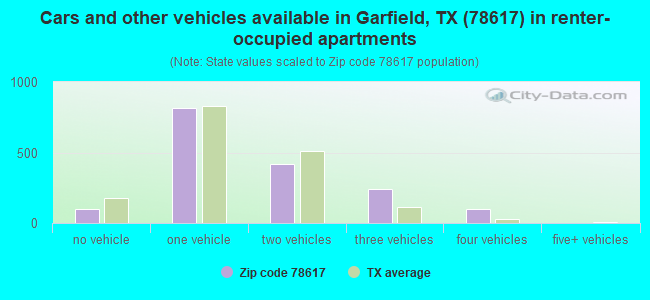
Renter-occupied apartments: 1,675
% of renters here:
20%State:
38%
March 2022 cost of living index in zip code 78617: 92.3
(less than average, U.S. average is 100)
Land area: 69.4
sq. mi.
Water area: 0.5
sq. mi.
Population density: 433 people per square mile (low).
OSM Map
General Map
Google Map
MSN Map
OSM Map
General Map
Google Map
MSN Map
OSM Map
General Map
Google Map
MSN Map
OSM Map
General Map
Google Map
MSN Map
Please wait while loading the map...
Real estate property taxes paid for housing units in 2022:
This zip code:
1.2% ($3,128)Texas:
1.5% ($4,050)
Median real estate property taxes paid for housing units with mortgages in 2022: $3,760 (1.4%)
Median real estate property taxes paid for housing units with no mortgage in 2022: $2,892 (1.2%)
Profiles of local businesses
Business Search - 14 Million verified businesses
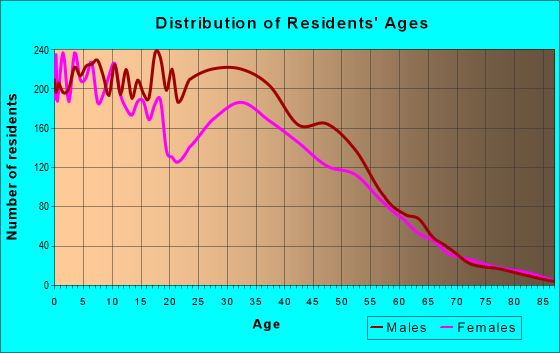
Males: 15,491 Females: 14,538
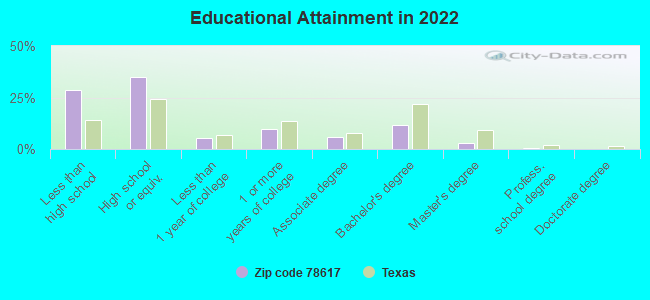
For population 25 years and over in 78617:
High school or higher: 69.4%Bachelor's degree or higher: 14.7%Graduate or professional degree: 3.5%Unemployed: 5.9%Mean travel time to work (commute): 33.0 minutes
For population 15 years and over in 78617:
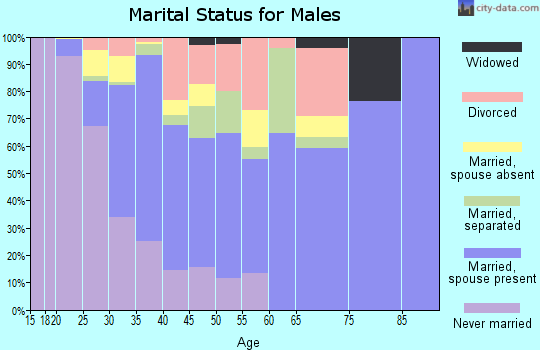
Never married: 41.8%Now married: 44.0%Separated: 1.5%Widowed: 2.2%Divorced: 10.4%
Zip code 78617 compared to state average:
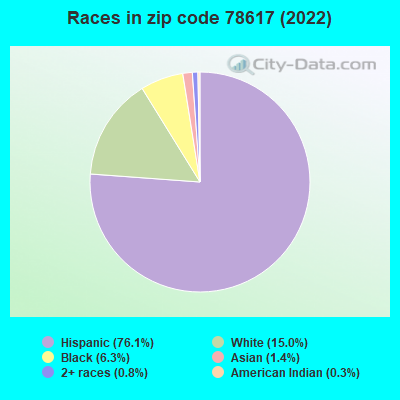
Black race population percentage below state average. Hispanic race population percentage above state average. Renting percentage below state average. Length of stay since moving in significantly above state average. House age below state average. Percentage of population with a bachelor's degree or higher significantly below state average. 22,841 76.1% Hispanic or Latino 4,513 15.0% White 1,901 6.3% Black 412 1.4% Asian 234 0.8% Two or more races 96 0.3% American Indian 30 0.10% Some other race
Data:
Median household income ($)
Median household income (% change since 2000)
Household income diversity
Ratio of average income to average house value (%)
Ratio of average income to average rent
Median household income ($) - White
Median household income ($) - Black or African American
Median household income ($) - Asian
Median household income ($) - Hispanic or Latino
Median household income ($) - American Indian and Alaska Native
Median household income ($) - Multirace
Median household income ($) - Other Race
Median household income for houses/condos with a mortgage ($)
Median household income for apartments without a mortgage ($)
Races - White alone (%)
Races - White alone (% change since 2000)
Races - Black alone (%)
Races - Black alone (% change since 2000)
Races - American Indian alone (%)
Races - American Indian alone (% change since 2000)
Races - Asian alone (%)
Races - Asian alone (% change since 2000)
Races - Hispanic (%)
Races - Hispanic (% change since 2000)
Races - Native Hawaiian and Other Pacific Islander alone (%)
Races - Native Hawaiian and Other Pacific Islander alone (% change since 2000)
Races - Two or more races (%)
Races - Two or more races (% change since 2000)
Races - Other race alone (%)
Races - Other race alone (% change since 2000)
Racial diversity
Unemployment (%)
Unemployment (% change since 2000)
Unemployment (%) - White
Unemployment (%) - Black or African American
Unemployment (%) - Asian
Unemployment (%) - Hispanic or Latino
Unemployment (%) - American Indian and Alaska Native
Unemployment (%) - Multirace
Unemployment (%) - Other Race
Population density (people per square mile)
Population - Males (%)
Population - Females (%)
Population - Males (%) - White
Population - Males (%) - Black or African American
Population - Males (%) - Asian
Population - Males (%) - Hispanic or Latino
Population - Males (%) - American Indian and Alaska Native
Population - Males (%) - Multirace
Population - Males (%) - Other Race
Population - Females (%) - White
Population - Females (%) - Black or African American
Population - Females (%) - Asian
Population - Females (%) - Hispanic or Latino
Population - Females (%) - American Indian and Alaska Native
Population - Females (%) - Multirace
Population - Females (%) - Other Race
Coronavirus confirmed cases (May 04, 2024)
Deaths caused by coronavirus (May 04, 2024)
Coronavirus confirmed cases (per 100k population) (May 04, 2024)
Deaths caused by coronavirus (per 100k population) (May 04, 2024)
Daily increase in number of cases (May 04, 2024)
Weekly increase in number of cases (May 04, 2024)
Cases doubled (in days) (May 04, 2024)
Hospitalized patients (Apr 18, 2022)
Negative test results (Apr 18, 2022)
Total test results (Apr 18, 2022)
COVID Vaccine doses distributed (per 100k population) (Sep 19, 2023)
COVID Vaccine doses administered (per 100k population) (Sep 19, 2023)
COVID Vaccine doses distributed (Sep 19, 2023)
COVID Vaccine doses administered (Sep 19, 2023)
Likely homosexual households (%)
Likely homosexual households (% change since 2000)
Likely homosexual households - Lesbian couples (%)
Likely homosexual households - Lesbian couples (% change since 2000)
Likely homosexual households - Gay men (%)
Likely homosexual households - Gay men (% change since 2000)
Cost of living index
Median gross rent ($)
Median contract rent ($)
Median monthly housing costs ($)
Median house or condo value ($)
Median house or condo value ($ change since 2000)
Mean house or condo value by units in structure - 1, detached ($)
Mean house or condo value by units in structure - 1, attached ($)
Mean house or condo value by units in structure - 2 ($)
Mean house or condo value by units in structure by units in structure - 3 or 4 ($)
Mean house or condo value by units in structure - 5 or more ($)
Mean house or condo value by units in structure - Boat, RV, van, etc. ($)
Mean house or condo value by units in structure - Mobile home ($)
Median house or condo value ($) - White
Median house or condo value ($) - Black or African American
Median house or condo value ($) - Asian
Median house or condo value ($) - Hispanic or Latino
Median house or condo value ($) - American Indian and Alaska Native
Median house or condo value ($) - Multirace
Median house or condo value ($) - Other Race
Median resident age
Resident age diversity
Median resident age - Males
Median resident age - Females
Median resident age - White
Median resident age - Black or African American
Median resident age - Asian
Median resident age - Hispanic or Latino
Median resident age - American Indian and Alaska Native
Median resident age - Multirace
Median resident age - Other Race
Median resident age - Males - White
Median resident age - Males - Black or African American
Median resident age - Males - Asian
Median resident age - Males - Hispanic or Latino
Median resident age - Males - American Indian and Alaska Native
Median resident age - Males - Multirace
Median resident age - Males - Other Race
Median resident age - Females - White
Median resident age - Females - Black or African American
Median resident age - Females - Asian
Median resident age - Females - Hispanic or Latino
Median resident age - Females - American Indian and Alaska Native
Median resident age - Females - Multirace
Median resident age - Females - Other Race
Commute - mean travel time to work (minutes)
Travel time to work - Less than 5 minutes (%)
Travel time to work - Less than 5 minutes (% change since 2000)
Travel time to work - 5 to 9 minutes (%)
Travel time to work - 5 to 9 minutes (% change since 2000)
Travel time to work - 10 to 19 minutes (%)
Travel time to work - 10 to 19 minutes (% change since 2000)
Travel time to work - 20 to 29 minutes (%)
Travel time to work - 20 to 29 minutes (% change since 2000)
Travel time to work - 30 to 39 minutes (%)
Travel time to work - 30 to 39 minutes (% change since 2000)
Travel time to work - 40 to 59 minutes (%)
Travel time to work - 40 to 59 minutes (% change since 2000)
Travel time to work - 60 to 89 minutes (%)
Travel time to work - 60 to 89 minutes (% change since 2000)
Travel time to work - 90 or more minutes (%)
Travel time to work - 90 or more minutes (% change since 2000)
Marital status - Never married (%)
Marital status - Now married (%)
Marital status - Separated (%)
Marital status - Widowed (%)
Marital status - Divorced (%)
Median family income ($)
Median family income (% change since 2000)
Median non-family income ($)
Median non-family income (% change since 2000)
Median per capita income ($)
Median per capita income (% change since 2000)
Median family income ($) - White
Median family income ($) - Black or African American
Median family income ($) - Asian
Median family income ($) - Hispanic or Latino
Median family income ($) - American Indian and Alaska Native
Median family income ($) - Multirace
Median family income ($) - Other Race
Median year house/condo built
Median year apartment built
Year house built - Built 2005 or later (%)
Year house built - Built 2000 to 2004 (%)
Year house built - Built 1990 to 1999 (%)
Year house built - Built 1980 to 1989 (%)
Year house built - Built 1970 to 1979 (%)
Year house built - Built 1960 to 1969 (%)
Year house built - Built 1950 to 1959 (%)
Year house built - Built 1940 to 1949 (%)
Year house built - Built 1939 or earlier (%)
Average household size
Household density (households per square mile)
Average household size - White
Average household size - Black or African American
Average household size - Asian
Average household size - Hispanic or Latino
Average household size - American Indian and Alaska Native
Average household size - Multirace
Average household size - Other Race
Occupied housing units (%)
Vacant housing units (%)
Owner occupied housing units (%)
Renter occupied housing units (%)
Vacancy status - For rent (%)
Vacancy status - For sale only (%)
Vacancy status - Rented or sold, not occupied (%)
Vacancy status - For seasonal, recreational, or occasional use (%)
Vacancy status - For migrant workers (%)
Vacancy status - Other vacant (%)
Residents with income below the poverty level (%)
Residents with income below 50% of the poverty level (%)
Children below poverty level (%)
Poor families by family type - Married-couple family (%)
Poor families by family type - Male, no wife present (%)
Poor families by family type - Female, no husband present (%)
Poverty status for native-born residents (%)
Poverty status for foreign-born residents (%)
Poverty among high school graduates not in families (%)
Poverty among people who did not graduate high school not in families (%)
Residents with income below the poverty level (%) - White
Residents with income below the poverty level (%) - Black or African American
Residents with income below the poverty level (%) - Asian
Residents with income below the poverty level (%) - Hispanic or Latino
Residents with income below the poverty level (%) - American Indian and Alaska Native
Residents with income below the poverty level (%) - Multirace
Residents with income below the poverty level (%) - Other Race
Air pollution - Air Quality Index (AQI)
Air pollution - CO
Air pollution - NO2
Air pollution - SO2
Air pollution - Ozone
Air pollution - PM10
Air pollution - PM25
Air pollution - Pb
Crime - Murders per 100,000 population
Crime - Rapes per 100,000 population
Crime - Robberies per 100,000 population
Crime - Assaults per 100,000 population
Crime - Burglaries per 100,000 population
Crime - Thefts per 100,000 population
Crime - Auto thefts per 100,000 population
Crime - Arson per 100,000 population
Crime - City-data.com crime index
Crime - Violent crime index
Crime - Property crime index
Crime - Murders per 100,000 population (5 year average)
Crime - Rapes per 100,000 population (5 year average)
Crime - Robberies per 100,000 population (5 year average)
Crime - Assaults per 100,000 population (5 year average)
Crime - Burglaries per 100,000 population (5 year average)
Crime - Thefts per 100,000 population (5 year average)
Crime - Auto thefts per 100,000 population (5 year average)
Crime - Arson per 100,000 population (5 year average)
Crime - City-data.com crime index (5 year average)
Crime - Violent crime index (5 year average)
Crime - Property crime index (5 year average)
1996 Presidential Elections Results (%) - Democratic Party (Clinton)
1996 Presidential Elections Results (%) - Republican Party (Dole)
1996 Presidential Elections Results (%) - Other
2000 Presidential Elections Results (%) - Democratic Party (Gore)
2000 Presidential Elections Results (%) - Republican Party (Bush)
2000 Presidential Elections Results (%) - Other
2004 Presidential Elections Results (%) - Democratic Party (Kerry)
2004 Presidential Elections Results (%) - Republican Party (Bush)
2004 Presidential Elections Results (%) - Other
2008 Presidential Elections Results (%) - Democratic Party (Obama)
2008 Presidential Elections Results (%) - Republican Party (McCain)
2008 Presidential Elections Results (%) - Other
2012 Presidential Elections Results (%) - Democratic Party (Obama)
2012 Presidential Elections Results (%) - Republican Party (Romney)
2012 Presidential Elections Results (%) - Other
2016 Presidential Elections Results (%) - Democratic Party (Clinton)
2016 Presidential Elections Results (%) - Republican Party (Trump)
2016 Presidential Elections Results (%) - Other
2020 Presidential Elections Results (%) - Democratic Party (Biden)
2020 Presidential Elections Results (%) - Republican Party (Trump)
2020 Presidential Elections Results (%) - Other
Ancestries Reported - Arab (%)
Ancestries Reported - Czech (%)
Ancestries Reported - Danish (%)
Ancestries Reported - Dutch (%)
Ancestries Reported - English (%)
Ancestries Reported - French (%)
Ancestries Reported - French Canadian (%)
Ancestries Reported - German (%)
Ancestries Reported - Greek (%)
Ancestries Reported - Hungarian (%)
Ancestries Reported - Irish (%)
Ancestries Reported - Italian (%)
Ancestries Reported - Lithuanian (%)
Ancestries Reported - Norwegian (%)
Ancestries Reported - Polish (%)
Ancestries Reported - Portuguese (%)
Ancestries Reported - Russian (%)
Ancestries Reported - Scotch-Irish (%)
Ancestries Reported - Scottish (%)
Ancestries Reported - Slovak (%)
Ancestries Reported - Subsaharan African (%)
Ancestries Reported - Swedish (%)
Ancestries Reported - Swiss (%)
Ancestries Reported - Ukrainian (%)
Ancestries Reported - United States (%)
Ancestries Reported - Welsh (%)
Ancestries Reported - West Indian (%)
Ancestries Reported - Other (%)
Educational Attainment - No schooling completed (%)
Educational Attainment - Less than high school (%)
Educational Attainment - High school or equivalent (%)
Educational Attainment - Less than 1 year of college (%)
Educational Attainment - 1 or more years of college (%)
Educational Attainment - Associate degree (%)
Educational Attainment - Bachelor's degree (%)
Educational Attainment - Master's degree (%)
Educational Attainment - Professional school degree (%)
Educational Attainment - Doctorate degree (%)
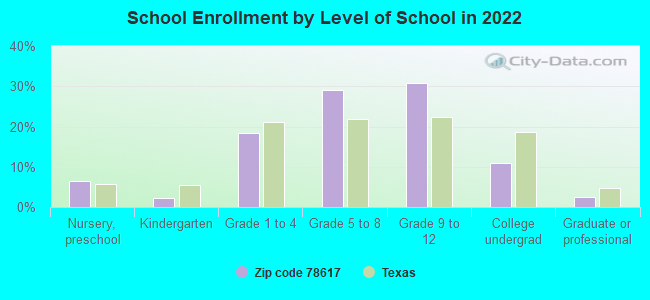
School Enrollment - Nursery, preschool (%)
School Enrollment - Kindergarten (%)
School Enrollment - Grade 1 to 4 (%)
School Enrollment - Grade 5 to 8 (%)
School Enrollment - Grade 9 to 12 (%)
School Enrollment - College undergrad (%)
School Enrollment - Graduate or professional (%)
School Enrollment - Not enrolled in school (%)
School enrollment - Public schools (%)
School enrollment - Private schools (%)
School enrollment - Not enrolled (%)
Median number of rooms in houses and condos
Median number of rooms in apartments
Housing units lacking complete plumbing facilities (%)
Housing units lacking complete kitchen facilities (%)
Density of houses
Urban houses (%)
Rural houses (%)
Households with people 60 years and over (%)
Households with people 65 years and over (%)
Households with people 75 years and over (%)
Households with one or more nonrelatives (%)
Households with no nonrelatives (%)
Population in households (%)
Family households (%)
Nonfamily households (%)
Population in families (%)
Family households with own children (%)
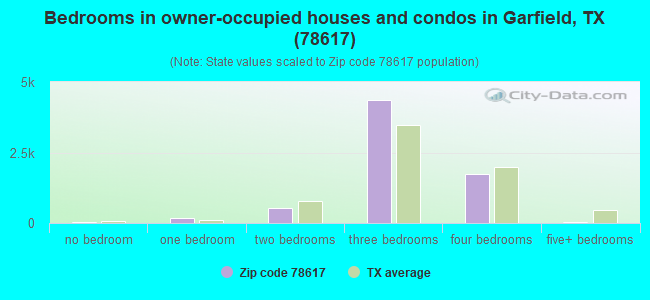
Median number of bedrooms in owner occupied houses
Mean number of bedrooms in owner occupied houses
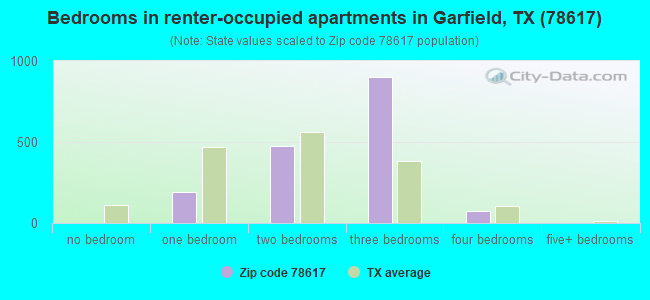
Median number of bedrooms in renter occupied houses
Mean number of bedrooms in renter occupied houses
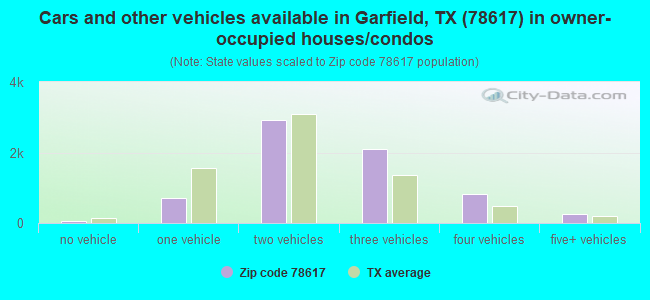
Median number of vehichles in owner occupied houses
Mean number of vehichles in owner occupied houses
Median number of vehichles in renter occupied houses
Mean number of vehichles in renter occupied houses
Mortgage status - with mortgage (%)
Mortgage status - with second mortgage (%)
Mortgage status - with home equity loan (%)
Mortgage status - with both second mortgage and home equity loan (%)
Mortgage status - without a mortgage (%)
Average family size
Average family size - White
Average family size - Black or African American
Average family size - Asian
Average family size - Hispanic or Latino
Average family size - American Indian and Alaska Native
Average family size - Multirace
Average family size - Other Race
Geographical mobility - Same house 1 year ago (%)
Geographical mobility - Moved within same county (%)
Geographical mobility - Moved from different county within same state (%)
Geographical mobility - Moved from different state (%)
Geographical mobility - Moved from abroad (%)
Place of birth - Born in state of residence (%)
Place of birth - Born in other state (%)
Place of birth - Native, outside of US (%)
Place of birth - Foreign born (%)
Housing units in structures - 1, detached (%)
Housing units in structures - 1, attached (%)
Housing units in structures - 2 (%)
Housing units in structures - 3 or 4 (%)
Housing units in structures - 5 to 9 (%)
Housing units in structures - 10 to 19 (%)
Housing units in structures - 20 to 49 (%)
Housing units in structures - 50 or more (%)
Housing units in structures - Mobile home (%)
Housing units in structures - Boat, RV, van, etc. (%)
House/condo owner moved in on average (years ago)
Renter moved in on average (years ago)
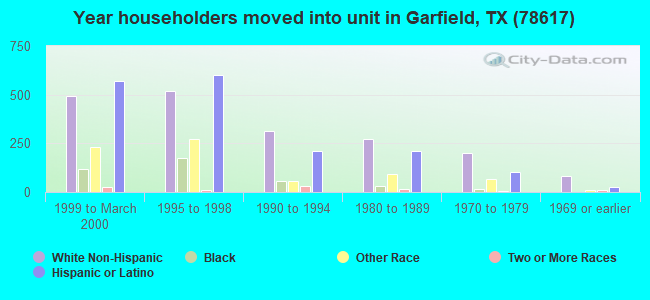
Year householder moved into unit - Moved in 1999 to March 2000 (%)
Year householder moved into unit - Moved in 1995 to 1998 (%)
Year householder moved into unit - Moved in 1990 to 1994 (%)
Year householder moved into unit - Moved in 1980 to 1989 (%)
Year householder moved into unit - Moved in 1970 to 1979 (%)
Year householder moved into unit - Moved in 1969 or earlier (%)
Means of transportation to work - Drove car alone (%)
Means of transportation to work - Carpooled (%)
Means of transportation to work - Public transportation (%)
Means of transportation to work - Bus or trolley bus (%)
Means of transportation to work - Streetcar or trolley car (%)
Means of transportation to work - Subway or elevated (%)
Means of transportation to work - Railroad (%)
Means of transportation to work - Ferryboat (%)
Means of transportation to work - Taxicab (%)
Means of transportation to work - Motorcycle (%)
Means of transportation to work - Bicycle (%)
Means of transportation to work - Walked (%)
Means of transportation to work - Other means (%)
Working at home (%)
Industry diversity
Most Common Industries - Agriculture, forestry, fishing and hunting, and mining (%)
Most Common Industries - Agriculture, forestry, fishing and hunting (%)
Most Common Industries - Mining, quarrying, and oil and gas extraction (%)
Most Common Industries - Construction (%)
Most Common Industries - Manufacturing (%)
Most Common Industries - Wholesale trade (%)
Most Common Industries - Retail trade (%)
Most Common Industries - Transportation and warehousing, and utilities (%)
Most Common Industries - Transportation and warehousing (%)
Most Common Industries - Utilities (%)
Most Common Industries - Information (%)
Most Common Industries - Finance and insurance, and real estate and rental and leasing (%)
Most Common Industries - Finance and insurance (%)
Most Common Industries - Real estate and rental and leasing (%)
Most Common Industries - Professional, scientific, and management, and administrative and waste management services (%)
Most Common Industries - Professional, scientific, and technical services (%)
Most Common Industries - Management of companies and enterprises (%)
Most Common Industries - Administrative and support and waste management services (%)
Most Common Industries - Educational services, and health care and social assistance (%)
Most Common Industries - Educational services (%)
Most Common Industries - Health care and social assistance (%)
Most Common Industries - Arts, entertainment, and recreation, and accommodation and food services (%)
Most Common Industries - Arts, entertainment, and recreation (%)
Most Common Industries - Accommodation and food services (%)
Most Common Industries - Other services, except public administration (%)
Most Common Industries - Public administration (%)
Occupation diversity
Most Common Occupations - Management, business, science, and arts occupations (%)
Most Common Occupations - Management, business, and financial occupations (%)
Most Common Occupations - Management occupations (%)
Most Common Occupations - Business and financial operations occupations (%)
Most Common Occupations - Computer, engineering, and science occupations (%)
Most Common Occupations - Computer and mathematical occupations (%)
Most Common Occupations - Architecture and engineering occupations (%)
Most Common Occupations - Life, physical, and social science occupations (%)
Most Common Occupations - Education, legal, community service, arts, and media occupations (%)
Most Common Occupations - Community and social service occupations (%)
Most Common Occupations - Legal occupations (%)
Most Common Occupations - Education, training, and library occupations (%)
Most Common Occupations - Arts, design, entertainment, sports, and media occupations (%)
Most Common Occupations - Healthcare practitioners and technical occupations (%)
Most Common Occupations - Health diagnosing and treating practitioners and other technical occupations (%)
Most Common Occupations - Health technologists and technicians (%)
Most Common Occupations - Service occupations (%)
Most Common Occupations - Healthcare support occupations (%)
Most Common Occupations - Protective service occupations (%)
Most Common Occupations - Fire fighting and prevention, and other protective service workers including supervisors (%)
Most Common Occupations - Law enforcement workers including supervisors (%)
Most Common Occupations - Food preparation and serving related occupations (%)
Most Common Occupations - Building and grounds cleaning and maintenance occupations (%)
Most Common Occupations - Personal care and service occupations (%)
Most Common Occupations - Sales and office occupations (%)
Most Common Occupations - Sales and related occupations (%)
Most Common Occupations - Office and administrative support occupations (%)
Most Common Occupations - Natural resources, construction, and maintenance occupations (%)
Most Common Occupations - Farming, fishing, and forestry occupations (%)
Most Common Occupations - Construction and extraction occupations (%)
Most Common Occupations - Installation, maintenance, and repair occupations (%)
Most Common Occupations - Production, transportation, and material moving occupations (%)
Most Common Occupations - Production occupations (%)
Most Common Occupations - Transportation occupations (%)
Most Common Occupations - Material moving occupations (%)
People in Group quarters - Institutionalized population (%)
People in Group quarters - Correctional institutions (%)
People in Group quarters - Federal prisons and detention centers (%)
People in Group quarters - Halfway houses (%)
People in Group quarters - Local jails and other confinement facilities (including police lockups) (%)
People in Group quarters - Military disciplinary barracks (%)
People in Group quarters - State prisons (%)
People in Group quarters - Other types of correctional institutions (%)
People in Group quarters - Nursing homes (%)
People in Group quarters - Hospitals/wards, hospices, and schools for the handicapped (%)
People in Group quarters - Hospitals/wards and hospices for chronically ill (%)
People in Group quarters - Hospices or homes for chronically ill (%)
People in Group quarters - Military hospitals or wards for chronically ill (%)
People in Group quarters - Other hospitals or wards for chronically ill (%)
People in Group quarters - Hospitals or wards for drug/alcohol abuse (%)
People in Group quarters - Mental (Psychiatric) hospitals or wards (%)
People in Group quarters - Schools, hospitals, or wards for the mentally retarded (%)
People in Group quarters - Schools, hospitals, or wards for the physically handicapped (%)
People in Group quarters - Institutions for the deaf (%)
People in Group quarters - Institutions for the blind (%)
People in Group quarters - Orthopedic wards and institutions for the physically handicapped (%)
People in Group quarters - Wards in general hospitals for patients who have no usual home elsewhere (%)
People in Group quarters - Wards in military hospitals for patients who have no usual home elsewhere (%)
People in Group quarters - Juvenile institutions (%)
People in Group quarters - Long-term care (%)
People in Group quarters - Homes for abused, dependent, and neglected children (%)
People in Group quarters - Residential treatment centers for emotionally disturbed children (%)
People in Group quarters - Training schools for juvenile delinquents (%)
People in Group quarters - Short-term care, detention or diagnostic centers for delinquent children (%)
People in Group quarters - Type of juvenile institution unknown (%)
People in Group quarters - Noninstitutionalized population (%)
People in Group quarters - College dormitories (includes college quarters off campus) (%)
People in Group quarters - Military quarters (%)
People in Group quarters - On base (%)
People in Group quarters - Barracks, unaccompanied personnel housing (UPH), (Enlisted/Officer), ;and similar group living quarters for military personnel (%)
People in Group quarters - Transient quarters for temporary residents (%)
People in Group quarters - Military ships (%)
People in Group quarters - Group homes (%)
People in Group quarters - Homes or halfway houses for drug/alcohol abuse (%)
People in Group quarters - Homes for the mentally ill (%)
People in Group quarters - Homes for the mentally retarded (%)
People in Group quarters - Homes for the physically handicapped (%)
People in Group quarters - Other group homes (%)
People in Group quarters - Religious group quarters (%)
People in Group quarters - Dormitories (%)
People in Group quarters - Agriculture workers' dormitories on farms (%)
People in Group quarters - Job Corps and vocational training facilities (%)
People in Group quarters - Other workers' dormitories (%)
People in Group quarters - Crews of maritime vessels (%)
People in Group quarters - Other nonhousehold living situations (%)
People in Group quarters - Other noninstitutional group quarters (%)
Residents speaking English at home (%)
Residents speaking English at home - Born in the United States (%)
Residents speaking English at home - Native, born elsewhere (%)
Residents speaking English at home - Foreign born (%)
Residents speaking Spanish at home (%)
Residents speaking Spanish at home - Born in the United States (%)
Residents speaking Spanish at home - Native, born elsewhere (%)
Residents speaking Spanish at home - Foreign born (%)
Residents speaking other language at home (%)
Residents speaking other language at home - Born in the United States (%)
Residents speaking other language at home - Native, born elsewhere (%)
Residents speaking other language at home - Foreign born (%)
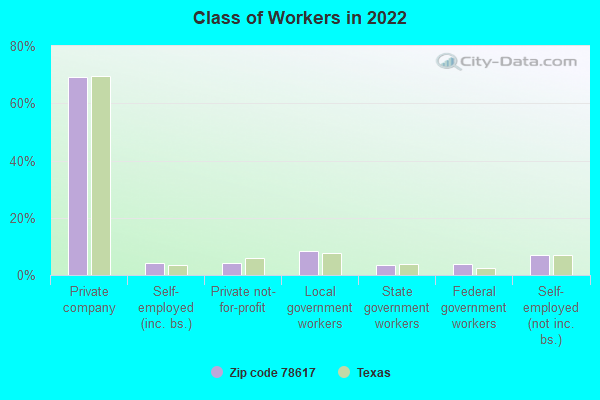
Class of Workers - Employee of private company (%)
Class of Workers - Self-employed in own incorporated business (%)
Class of Workers - Private not-for-profit wage and salary workers (%)
Class of Workers - Local government workers (%)
Class of Workers - State government workers (%)
Class of Workers - Federal government workers (%)
Class of Workers - Self-employed workers in own not incorporated business and Unpaid family workers (%)
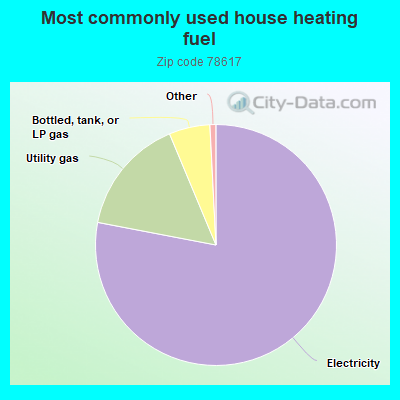
House heating fuel used in houses and condos - Utility gas (%)
House heating fuel used in houses and condos - Bottled, tank, or LP gas (%)
House heating fuel used in houses and condos - Electricity (%)
House heating fuel used in houses and condos - Fuel oil, kerosene, etc. (%)
House heating fuel used in houses and condos - Coal or coke (%)
House heating fuel used in houses and condos - Wood (%)
House heating fuel used in houses and condos - Solar energy (%)
House heating fuel used in houses and condos - Other fuel (%)
House heating fuel used in houses and condos - No fuel used (%)
House heating fuel used in apartments - Utility gas (%)
House heating fuel used in apartments - Bottled, tank, or LP gas (%)
House heating fuel used in apartments - Electricity (%)
House heating fuel used in apartments - Fuel oil, kerosene, etc. (%)
House heating fuel used in apartments - Coal or coke (%)
House heating fuel used in apartments - Wood (%)
House heating fuel used in apartments - Solar energy (%)
House heating fuel used in apartments - Other fuel (%)
House heating fuel used in apartments - No fuel used (%)
Armed forces status - In Armed Forces (%)
Armed forces status - Civilian (%)
Armed forces status - Civilian - Veteran (%)
Armed forces status - Civilian - Nonveteran (%)
Fatal accidents locations in years 2005-2021
Fatal accidents locations in 2005
Fatal accidents locations in 2006
Fatal accidents locations in 2007
Fatal accidents locations in 2008
Fatal accidents locations in 2009
Fatal accidents locations in 2010
Fatal accidents locations in 2011
Fatal accidents locations in 2012
Fatal accidents locations in 2013
Fatal accidents locations in 2014
Fatal accidents locations in 2015
Fatal accidents locations in 2016
Fatal accidents locations in 2017
Fatal accidents locations in 2018
Fatal accidents locations in 2019
Fatal accidents locations in 2020
Fatal accidents locations in 2021
Alcohol use - People drinking some alcohol every month (%)
Alcohol use - People not drinking at all (%)
Alcohol use - Average days/month drinking alcohol
Alcohol use - Average drinks/week
Alcohol use - Average days/year people drink much
Audiometry - Average condition of hearing (%)
Audiometry - People that can hear a whisper from across a quiet room (%)
Audiometry - People that can hear normal voice from across a quiet room (%)
Audiometry - Ears ringing, roaring, buzzing (%)
Audiometry - Had a job exposure to loud noise (%)
Audiometry - Had off-work exposure to loud noise (%)
Blood Pressure & Cholesterol - Has high blood pressure (%)
Blood Pressure & Cholesterol - Checking blood pressure at home (%)
Blood Pressure & Cholesterol - Frequently checking blood cholesterol (%)
Blood Pressure & Cholesterol - Has high cholesterol level (%)
Consumer Behavior - Money monthly spent on food at supermarket/grocery store
Consumer Behavior - Money monthly spent on food at other stores
Consumer Behavior - Money monthly spent on eating out
Consumer Behavior - Money monthly spent on carryout/delivered foods
Consumer Behavior - Income spent on food at supermarket/grocery store (%)
Consumer Behavior - Income spent on food at other stores (%)
Consumer Behavior - Income spent on eating out (%)
Consumer Behavior - Income spent on carryout/delivered foods (%)
Current Health Status - General health condition (%)
Current Health Status - Blood donors (%)
Current Health Status - Has blood ever tested for HIV virus (%)
Current Health Status - Left-handed people (%)
Dermatology - People using sunscreen (%)
Diabetes - Diabetics (%)
Diabetes - Had a blood test for high blood sugar (%)
Diabetes - People taking insulin (%)
Diet Behavior & Nutrition - Diet health (%)
Diet Behavior & Nutrition - Milk product consumption (# of products/month)
Diet Behavior & Nutrition - Meals not home prepared (#/week)
Diet Behavior & Nutrition - Meals from fast food or pizza place (#/week)
Diet Behavior & Nutrition - Ready-to-eat foods (#/month)
Diet Behavior & Nutrition - Frozen meals/pizza (#/month)
Drug Use - People that ever used marijuana or hashish (%)
Drug Use - Ever used hard drugs (%)
Drug Use - Ever used any form of cocaine (%)
Drug Use - Ever used heroin (%)
Drug Use - Ever used methamphetamine (%)
Health Insurance - People covered by health insurance (%)
Kidney Conditions-Urology - Avg. # of times urinating at night
Medical Conditions - People with asthma (%)
Medical Conditions - People with anemia (%)
Medical Conditions - People with psoriasis (%)
Medical Conditions - People with overweight (%)
Medical Conditions - Elderly people having difficulties in thinking or remembering (%)
Medical Conditions - People who ever received blood transfusion (%)
Medical Conditions - People having trouble seeing even with glass/contacts (%)
Medical Conditions - People with arthritis (%)
Medical Conditions - People with gout (%)
Medical Conditions - People with congestive heart failure (%)
Medical Conditions - People with coronary heart disease (%)
Medical Conditions - People with angina pectoris (%)
Medical Conditions - People who ever had heart attack (%)
Medical Conditions - People who ever had stroke (%)
Medical Conditions - People with emphysema (%)
Medical Conditions - People with thyroid problem (%)
Medical Conditions - People with chronic bronchitis (%)
Medical Conditions - People with any liver condition (%)
Medical Conditions - People who ever had cancer or malignancy (%)
Mental Health - People who have little interest in doing things (%)
Mental Health - People feeling down, depressed, or hopeless (%)
Mental Health - People who have trouble sleeping or sleeping too much (%)
Mental Health - People feeling tired or having little energy (%)
Mental Health - People with poor appetite or overeating (%)
Mental Health - People feeling bad about themself (%)
Mental Health - People who have trouble concentrating on things (%)
Mental Health - People moving or speaking slowly or too fast (%)
Mental Health - People having thoughts they would be better off dead (%)
Oral Health - Average years since last visit a dentist
Oral Health - People embarrassed because of mouth (%)
Oral Health - People with gum disease (%)
Oral Health - General health of teeth and gums (%)
Oral Health - Average days a week using dental floss/device
Oral Health - Average days a week using mouthwash for dental problem
Oral Health - Average number of teeth
Pesticide Use - Households using pesticides to control insects (%)
Pesticide Use - Households using pesticides to kill weeds (%)
Physical Activity - People doing vigorous-intensity work activities (%)
Physical Activity - People doing moderate-intensity work activities (%)
Physical Activity - People walking or bicycling (%)
Physical Activity - People doing vigorous-intensity recreational activities (%)
Physical Activity - People doing moderate-intensity recreational activities (%)
Physical Activity - Average hours a day doing sedentary activities
Physical Activity - Average hours a day watching TV or videos
Physical Activity - Average hours a day using computer
Physical Functioning - People having limitations keeping them from working (%)
Physical Functioning - People limited in amount of work they can do (%)
Physical Functioning - People that need special equipment to walk (%)
Physical Functioning - People experiencing confusion/memory problems (%)
Physical Functioning - People requiring special healthcare equipment (%)
Prescription Medications - Average number of prescription medicines taking
Preventive Aspirin Use - Adults 40+ taking low-dose aspirin (%)
Reproductive Health - Vaginal deliveries (%)
Reproductive Health - Cesarean deliveries (%)
Reproductive Health - Deliveries resulted in a live birth (%)
Reproductive Health - Pregnancies resulted in a delivery (%)
Reproductive Health - Women breastfeeding newborns (%)
Reproductive Health - Women that had a hysterectomy (%)
Reproductive Health - Women that had both ovaries removed (%)
Reproductive Health - Women that have ever taken birth control pills (%)
Reproductive Health - Women taking birth control pills (%)
Reproductive Health - Women that have ever used Depo-Provera or injectables (%)
Reproductive Health - Women that have ever used female hormones (%)
Sexual Behavior - People 18+ that ever had sex (vaginal, anal, or oral) (%)
Sexual Behavior - Males 18+ that ever had vaginal sex with a woman (%)
Sexual Behavior - Males 18+ that ever performed oral sex on a woman (%)
Sexual Behavior - Males 18+ that ever had anal sex with a woman (%)
Sexual Behavior - Males 18+ that ever had any sex with a man (%)
Sexual Behavior - Females 18+ that ever had vaginal sex with a man (%)
Sexual Behavior - Females 18+ that ever performed oral sex on a man (%)
Sexual Behavior - Females 18+ that ever had anal sex with a man (%)
Sexual Behavior - Females 18+ that ever had any kind of sex with a woman (%)
Sexual Behavior - Average age people first had sex
Sexual Behavior - Average number of female sex partners in lifetime (males 18+)
Sexual Behavior - Average number of female vaginal sex partners in lifetime (males 18+)
Sexual Behavior - Average age people first performed oral sex on a woman (18+)
Sexual Behavior - Average number of woman performed oral sex on in lifetime (18+)
Sexual Behavior - Average number of male sex partners in lifetime (males 18+)
Sexual Behavior - Average number of male anal sex partners in lifetime (males 18+)
Sexual Behavior - Average age people first performed oral sex on a man (18+)
Sexual Behavior - Average number of male oral sex partners in lifetime (18+)
Sexual Behavior - People using protection when performing oral sex (%)
Sexual Behavior - Average number of times people have vaginal or anal sex a year
Sexual Behavior - People having sex without condom (%)
Sexual Behavior - Average number of male sex partners in lifetime (females 18+)
Sexual Behavior - Average number of male vaginal sex partners in lifetime (females 18+)
Sexual Behavior - Average number of female sex partners in lifetime (females 18+)
Sexual Behavior - Circumcised males 18+ (%)
Sleep Disorders - Average hours sleeping at night
Sleep Disorders - People that has trouble sleeping (%)
Smoking-Cigarette Use - People smoking cigarettes (%)
Taste & Smell - People 40+ having problems with smell (%)
Taste & Smell - People 40+ having problems with taste (%)
Taste & Smell - People 40+ that ever had wisdom teeth removed (%)
Taste & Smell - People 40+ that ever had tonsils teeth removed (%)
Taste & Smell - People 40+ that ever had a loss of consciousness because of a head injury (%)
Taste & Smell - People 40+ that ever had a broken nose or other serious injury to face or skull (%)
Taste & Smell - People 40+ that ever had two or more sinus infections (%)
Weight - Average height (inches)
Weight - Average weight (pounds)
Weight - Average BMI
Weight - People that are obese (%)
Weight - People that ever were obese (%)
Weight - People trying to lose weight (%)
Urban population: 11,988
Rural population: 18,041
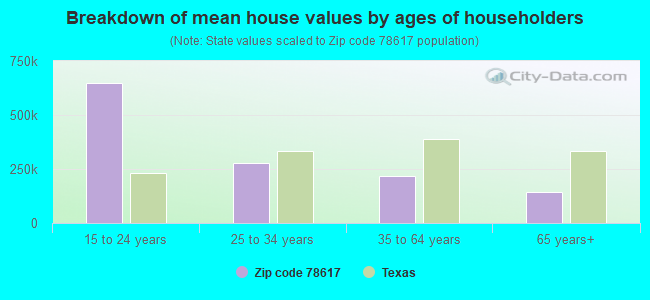
Estimated median house/condo value in 2022: $257,001
78617:
$257,001Texas:
$275,400
Median resident age: This zip code:
33.9 yearsTexas median age:
35.6 years
Average household size: This zip code:
3.2 peopleTexas:
2.6 people
Averages for the 2020 tax year for zip code 78617, filed in 2021:
Average Adjusted Gross Income (AGI) in 2020: $40,909 (Individual Income Tax Returns) Here:
$40,909State:
$77,054
Salary/wage: $39,462 (reported on 82.5% of returns )Here:
$39,462State:
$62,766
(% of AGI for various income ranges: 1197.1% for AGIs below $25k , 3778.3% for AGIs $25k-50k , 7120.1% for AGIs $50k-75k , 10684.0% for AGIs $75k-100k , 16507.1% for AGIs $100k-200k ) Taxable interest for individuals: $656 (reported on 9.0% of returns )This zip code:
$656Texas:
$2,665
(% of AGI for various income ranges: 1.6% for AGIs below $25k , 2.7% for AGIs $25k-50k , 8.4% for AGIs $50k-75k , 15.3% for AGIs $75k-100k , 41.2% for AGIs $100k-200k ) Ordinary dividends: $1,697 (reported on 3.1% of returns )(% of AGI for various income ranges: 3.1% for AGIs below $25k , 5.3% for AGIs $25k-50k , 4.3% for AGIs $50k-75k , 10.9% for AGIs $75k-100k , 47.6% for AGIs $100k-200k ) Net capital gain/loss in AGI: +$10,170 (reported on 3.6% of returns )Here:
+$10,170State:
+$39,590
(% of AGI for various income ranges: 2.2% for AGIs below $25k , 3.2% for AGIs $25k-50k , 40.8% for AGIs $50k-75k , 57.5% for AGIs $75k-100k , 372.7% for AGIs $100k-200k ) Profit/loss from business: +$14,180 (reported on 24.6% of returns )Here:
+$14,180State:
+$10,888
(% of AGI for various income ranges: 407.7% for AGIs below $25k , 437.6% for AGIs $25k-50k , 585.3% for AGIs $50k-75k , 454.9% for AGIs $75k-100k , 705.9% for AGIs $100k-200k ) Taxable individual retirement arrangement distribution: $10,370 (reported on 1.7% of returns )78617:
$10,370Texas:
$24,740
(% of AGI for various income ranges: 9.0% for AGIs below $25k , 11.8% for AGIs $25k-50k , 44.6% for AGIs $50k-75k , 192.2% for AGIs $100k-200k ) Total itemized deductions: $24,761 (reported on 2.6% of returns )Here:
$24,761State:
$40,428
(% of AGI for various income ranges: 12.4% for AGIs below $25k , 52.0% for AGIs $25k-50k , 140.2% for AGIs $50k-75k , 260.6% for AGIs $75k-100k , 566.1% for AGIs $100k-200k ) Charity contributions: $8,432 (reported on 1.6% of returns )(% of AGI for various income ranges: 6.6% for AGIs $25k-50k , 23.4% for AGIs $50k-75k , 66.4% for AGIs $75k-100k , 176.3% for AGIs $100k-200k ) Taxes paid: $6,207 (reported on 2.5% of returns )(% of AGI for various income ranges: 2.6% for AGIs below $25k , 11.7% for AGIs $25k-50k , 33.8% for AGIs $50k-75k , 61.9% for AGIs $75k-100k , 150.2% for AGIs $100k-200k ) Earned income credit: $2,667 (reported on 25.6% of returns )(% of AGI for various income ranges: 149.6% for AGIs below $25k , 99.0% for AGIs $25k-50k , 2.5% for AGIs $50k-75k ) Percentage of individuals using paid preparers for their 2020 taxes: 88.3%(% for various income ranges: 85.9% for AGIs below $25k , 90.4% for AGIs $25k-50k , 88.9% for AGIs $50k-75k , 89.6% for AGIs $75k-100k , 90.9% for AGIs $100k-200k , 71.4% for AGIs over 200k )
Averages for the 2012 tax year for zip code 78617, filed in 2013:
Average Adjusted Gross Income (AGI) in 2012: $34,220 (Individual Income Tax Returns) Here:
$34,220State:
$65,384
Salary/wage: $32,717 (reported on 87.0% of returns )Here:
$32,717State:
$52,524
(% of AGI for various income ranges: 76.0% for AGIs below $25k , 89.3% for AGIs $25k-50k , 87.9% for AGIs $50k-75k , 83.5% for AGIs $75k-100k , 93.7% for AGIs $100k-200k ) Taxable interest for individuals: $584 (reported on 10.2% of returns )This zip code:
$584Texas:
$2,372
(% of AGI for various income ranges: 0.2% for AGIs below $25k , 0.3% for AGIs $50k-75k , 0.2% for AGIs $75k-100k , 0.2% for AGIs $100k-200k ) Ordinary dividends: $1,028 (reported on 3.1% of returns )(% of AGI for various income ranges: 0.2% for AGIs $50k-75k , 0.3% for AGIs $100k-200k ) Net capital gain/loss in AGI: +$16,827 (reported on 1.8% of returns )Here:
+$16,827State:
+$35,319
(% of AGI for various income ranges: 9.7% for AGIs $100k-200k ) Profit/loss from business: +$12,171 (reported on 19.4% of returns )Here:
+$12,171State:
+$13,732
(% of AGI for various income ranges: 18.5% for AGIs below $25k , 5.4% for AGIs $25k-50k , 3.4% for AGIs $50k-75k , 2.6% for AGIs $75k-100k , 5.2% for AGIs $100k-200k ) Taxable individual retirement arrangement distribution: $8,090 (reported on 2.6% of returns )78617:
$8,090Texas:
$19,511
(% of AGI for various income ranges: 0.5% for AGIs below $25k , 0.5% for AGIs $25k-50k , 0.6% for AGIs $50k-75k , 1.9% for AGIs $75k-100k ) Total itemized deductions: $14,939 (25% of AGI, reported on 14.6% of returns )Here:
$14,939State:
$24,724
Here:
25.3% of AGIState:
15.9% of AGI
(% of AGI for various income ranges: 3.7% for AGIs below $25k , 6.9% for AGIs $25k-50k , 7.6% for AGIs $50k-75k , 6.7% for AGIs $75k-100k , 9.0% for AGIs $100k-200k ) Charity contributions: $2,662 (reported on 8.1% of returns )(% of AGI for various income ranges: 0.2% for AGIs below $25k , 0.5% for AGIs $25k-50k , 0.6% for AGIs $50k-75k , 1.0% for AGIs $75k-100k , 1.7% for AGIs $100k-200k ) Taxes paid: $4,197 (reported on 14.2% of returns )(% of AGI for various income ranges: 1.1% for AGIs below $25k , 1.8% for AGIs $25k-50k , 2.0% for AGIs $50k-75k , 2.0% for AGIs $75k-100k , 2.7% for AGIs $100k-200k ) Earned income credit: $2,678 (reported on 34.1% of returns )(% of AGI for various income ranges: 10.7% for AGIs below $25k , 1.9% for AGIs $25k-50k ) Percentage of individuals using paid preparers for their 2012 taxes: 43.5%(% for various income ranges: 45.3% for AGIs below $25k , 40.5% for AGIs $25k-50k , 45.3% for AGIs $50k-75k , 38.5% for AGIs $75k-100k , 57.1% for AGIs $100k-200k )
Averages for the 2004 tax year for zip code 78617, filed in 2005:
Average Adjusted Gross Income (AGI) in 2004: $29,334 (Individual Income Tax Returns) Here:
$29,334State:
$47,881
Salary/wage: $28,607 (reported on 88.5% of returns )Here:
$28,607State:
$41,947
(% of AGI for various income ranges: 111.2% for AGIs below $10k , 85.7% for AGIs $10k-25k , 90.3% for AGIs $25k-50k , 88.4% for AGIs $50k-75k , 87.7% for AGIs $75k-100k , 56.4% for AGIs over 100k ) Taxable interest for individuals: $878 (reported on 15.6% of returns )This zip code:
$878Texas:
$2,255
(% of AGI for various income ranges: 2.7% for AGIs below $10k , 0.4% for AGIs $10k-25k , 0.3% for AGIs $25k-50k , 0.6% for AGIs $50k-75k , 0.2% for AGIs $75k-100k , 0.8% for AGIs over 100k ) Taxable dividends: $635 (reported on 4.5% of returns )(% of AGI for various income ranges: 0.3% for AGIs below $10k , 0.1% for AGIs $10k-25k , 0.0% for AGIs $25k-50k , 0.1% for AGIs $50k-75k , 0.1% for AGIs $75k-100k , 0.2% for AGIs over 100k ) Net capital gain/loss: +$5,781 (reported on 5.1% of returns )Here:
+$5,781State:
+$16,110
(% of AGI for various income ranges: 0.8% for AGIs below $10k , 0.1% for AGIs $10k-25k , 0.1% for AGIs $25k-50k , 0.6% for AGIs $50k-75k , -0.0% for AGIs $75k-100k , 9.1% for AGIs over 100k ) Profit/loss from business: +$9,045 (reported on 15.3% of returns )Here:
+$9,045State:
+$11,013
(% of AGI for various income ranges: 14.6% for AGIs below $10k , 9.1% for AGIs $10k-25k , 3.8% for AGIs $25k-50k , 2.1% for AGIs $50k-75k , 3.6% for AGIs $75k-100k , 3.2% for AGIs over 100k ) IRA payment deduction: $2,520 (reported on 0.9% of returns )(% of AGI for various income ranges: 0.1% for AGIs $10k-25k , 0.0% for AGIs $25k-50k , 0.1% for AGIs $50k-75k , 0.3% for AGIs $75k-100k ) Total itemized deductions: $13,215 (25% of AGI, reported on 17.7% of returns )Here:
$13,215State:
$19,631
Here:
25.1% of AGIState:
18.9% of AGI
(% of AGI for various income ranges: 5.4% for AGIs below $10k , 5.0% for AGIs $10k-25k , 8.1% for AGIs $25k-50k , 10.1% for AGIs $50k-75k , 9.0% for AGIs $75k-100k , 8.7% for AGIs over 100k ) Charity contributions deductions: $2,198 (4% of AGI, reported on 10.7% of returns )Here:
3.7% of AGIState:
4.2% of AGI
(% of AGI for various income ranges: 0.3% for AGIs $10k-25k , 0.5% for AGIs $25k-50k , 1.3% for AGIs $50k-75k , 1.0% for AGIs $75k-100k , 1.8% for AGIs over 100k ) Total tax: $3,246 (reported on 63.4% of returns )(% of AGI for various income ranges: 3.9% for AGIs below $10k , 3.9% for AGIs $10k-25k , 5.5% for AGIs $25k-50k , 7.7% for AGIs $50k-75k , 10.7% for AGIs $75k-100k , 16.0% for AGIs over 100k ) Earned income credit: $1,985 (reported on 32.4% of returns )Percentage of individuals using paid preparers for their 2004 taxes: 56.8%(% for various income ranges: 55.4% for AGIs below $10k , 59.9% for AGIs $10k-25k , 56.9% for AGIs $25k-50k , 53.0% for AGIs $50k-75k , 44.0% for AGIs $75k-100k , 56.2% for AGIs over 100k )
Estimated median household income in 2022: This zip code:
$74,004Texas:
$72,284
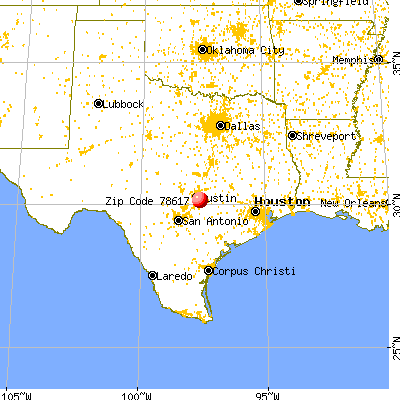
Nearest zip codes: 78725 ,
78719 ,
78742 ,
78744 ,
78612 ,
78741 .
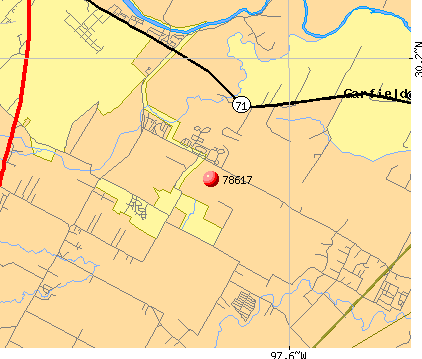
Garfield Zip Code Map
Percentage of family households: This zip code:
61.5%Texas:
50.5%
Percentage of households with unmarried partners: This zip code:
6.6%Texas:
48.7%
Likely homosexual households (counted as self-reported same-sex unmarried-partner households)
Lesbian couples: 0.1% of all households Gay men: 0.0% of all households
Household received Food Stamps/SNAP in the past 12 months: 552Household did not receive Food Stamps/SNAP in the past 12 months: 8,002
Women who had a birth in the past 12 months: 425 (191 now married , 228 unmarried) Women who did not have a birth in the past 12 months: 7,927 (3,598 now married , 4,325 unmarried)
Housing units in zip code 78617 with a mortgage: 3,419 (242
second mortgage , 243
both second mortgage and home equity loan )
Houses without a mortgage: 46
Median monthly owner costs for units with a mortgage: $1,602
Median monthly owner costs for units without a mortgage: $633
Residents with income below the poverty level in 2022:
This zip code:
10.2%Whole state:
14.0%
Residents with income below 50% of the poverty level in 2022:
This zip code:
4.9%Whole state:
7.4%
Median number of rooms in houses and condos: Median number of rooms in apartments: Notable locations in this zip code not listed on our city pages
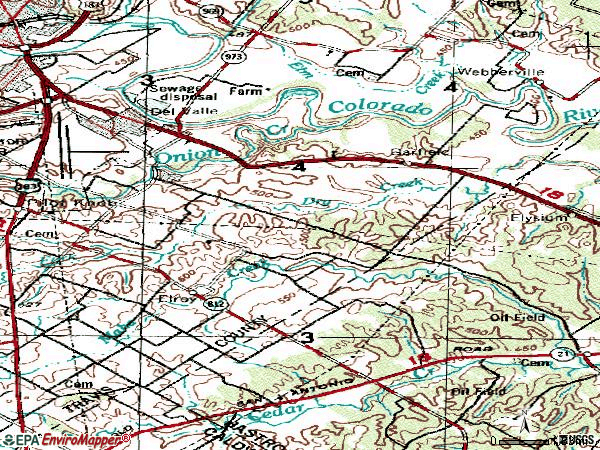
Click to draw/clear zip code borders Notable locations in zip code 78617: (A) , Moores Crossing Historic District (B) , City of Austin DBA Austin Energy Facility (C) , City of Austin South Regional Wastewater Treatment Plant (D) , Travis County Fire Rescue Emergency Services District 11 Station 1 (E) , Austin Fire Department Station 42 (F) , Austin / Travis County Emergency Medical Service - Medic 30 (G) . Display/hide their locations on the map
Churches in zip code 78617 include: (A) , Cottonwood Baptist Church (B) , Neighborhood Baptist Church (C) , Haynie Chapel United Church (D) , The Church of Jesus Christ of Latter Day Saints (E) . Display/hide their locations on the map
Cemeteries: (1) , Haynie Cemetery (2) , Comanche Cemeteries (3) , Fowler Cemetery (4) , Garfield Cemetery (5) , Ingram Cemetery (6) . Display/hide their locations on the map
Reservoir: (A) . Display/hide its location on the map
Creeks: (A) , North Fork Dry Creek (B) , South Fork Dry Creek (C) . Display/hide their locations on the map
Parks in zip code 78617 include: (1) , Cardinal Stadium - Del Valle (2) , Del Valle High School Baseball Field (3) . Display/hide their locations on the map
Year house built (houses)
229 2020 or later2,160 2010 to 20192,926 2000 to 20091,287 1990 to 19991,075 1980 to 1989898 1970 to 1979146 1960 to 196968 1950 to 195945 1940 to 194977 1939 or earlier
Zip code 78617 household income distribution in 2022 272 Less than $10,000331 $10,000 to $14,999121 $15,000 to $19,999173 $20,000 to $24,999146 $25,000 to $29,999339 $30,000 to $34,999190 $35,000 to $39,999399 $40,000 to $44,999483 $45,000 to $49,999753 $50,000 to $59,9991,148 $60,000 to $74,9991,095 $75,000 to $99,999899 $100,000 to $124,999799 $125,000 to $149,999820 $150,000 to $199,999589 $200,000 or moreEstimate of home value of owner-occupied houses/condos in 2022 in zip code 78617 358 Less than $10,000150 $10,000 to $14,99995 $15,000 to $19,99926 $20,000 to $24,99955 $25,000 to $29,99961 $30,000 to $34,99918 $40,000 to $49,99972 $50,000 to $59,99991 $60,000 to $69,99925 $70,000 to $79,999218 $80,000 to $89,9997 $90,000 to $99,999438 $100,000 to $124,999171 $125,000 to $149,999257 $150,000 to $174,999246 $175,000 to $199,9991,720 $200,000 to $249,999952 $250,000 to $299,9991,010 $300,000 to $399,999337 $400,000 to $499,999215 $500,000 to $749,99925 $1,000,000 to $1,499,9995 $1,500,000 to $1,999,999106 $2,000,000 or moreRent paid by renters in 2022 in zip code 78617 19 $200 to $24940 $300 to $34940 $550 to $599130 $600 to $64997 $700 to $74990 $750 to $79920 $800 to $89972 $900 to $999357 $1,000 to $1,249186 $1,250 to $1,499440 $1,500 to $1,999118 $2,000 to $2,49995 No cash rent
Median gross rent in 2022: $1,409.
Estimated median house (or condo) value in 2022 for: White Non-Hispanic householders: $338,282Black or African American householders: $403,693American Indian or Alaska Native householders: $490,779Asian householders: $572,447Native Hawaiian and other Pacific Islander householders: $367,697Some other race householders: $316,994Two or more races householders: $210,555Hispanic or Latino householders: $278,289Estimated median house or condo value in 2022: $257,001
78617:
$257,001Texas:
$275,400
Lower value quartile - upper value quartile: $146,323 - $323,042
Mean price in 2022: Detached houses: $271,447Here:
$271,447State:
$369,058
Mobile homes: $111,646Here:
$111,646State:
$124,413
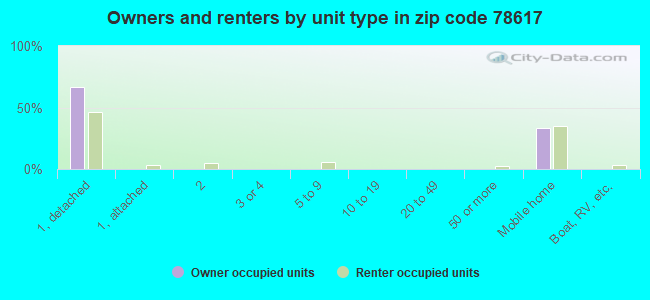
Housing units in structures:
One, detached: 5,545One, attached: 136Two: 915 to 9: 8620 to 49: 2850 or more: 45Mobile homes: 2,795Boats, RVs, vans, etc.: 62Unemployment : 5.9%
Means of transportation to work in zip code 78617 73.4% 11,004 Drove a car alone13.0% 1,950 Carpooled0.3% 44 Bus or trolley bus1.6% 245 Walked2.4% 356 Other means7.8% 1,168 Worked at homeTravel time to work (commute) in zip code 78617 202 Less than 5 minutes206 5 to 9 minutes780 10 to 14 minutes1,369 15 to 19 minutes1,300 20 to 24 minutes1,043 25 to 29 minutes3,927 30 to 34 minutes486 35 to 39 minutes988 40 to 44 minutes1,836 45 to 59 minutes1,083 60 to 89 minutes314 90 or more minutes
Percentage of zip code residents living and working in this county: 78.3%
Household type by relationship:
Households: 30,030
Male householders: 4,342 (647 living alone ), Female householders: 4,235 (290 living alone )4,532 spouses (4,532 opposite-sex spouses ), 859 unmarried partners , (836 opposite-sex unmarried partners ), 9,701 children (9,214 natural , 102 adopted , 383 stepchildren ), 1,011 grandchildren , 288 brothers or sisters , 674 parents , 0 foster children , 989 other relatives , 860 non-relatives In group quarters: 2,349 (-1 institutionalized population )
Size of family households: 1,559 2-persons , 2,103 3-persons , 1,181 4-persons , 1,271 5-persons , 347 6-persons , 286 7-or-more-persons
Size of nonfamily households: 938 1-person , 691 2-persons , 61 3-persons , 80 4-persons
4,331 married couples with children. single-parent households (81 men , 1,785 women ).
40.6% of residents of 78617 zip code speak English at home. of residents speak Spanish at home (62% very well, 21% well, 14% not well, 3% not at all ).of residents speak other Indo-European language at home (100% very well ).of residents speak Asian or Pacific Island language at home (33% very well, 52% well, 14% not well ).of residents speak other language at home (26% very well, 18% well, 56% not at all ).
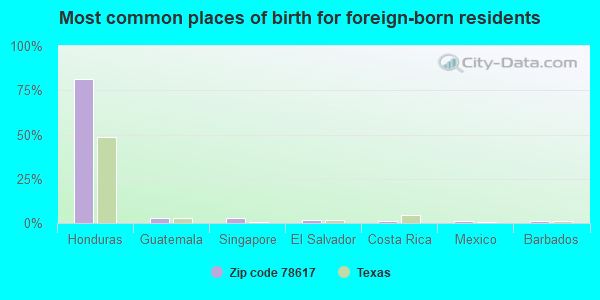
Foreign born population: 7,058 (23.5%)
(35.3%
of them are naturalized citizens )
This zip code:
23.5%Whole state:
17.2%
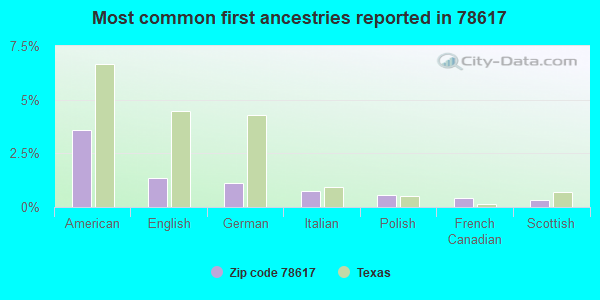
81% Honduras 3% Guatemala 3% Singapore 2% El Salvador 1% Costa Rica 1% Mexico 1% Barbados 4% American 1% English 1% German 1% Italian 1% Polish 0% French Canadian 0% Scottish
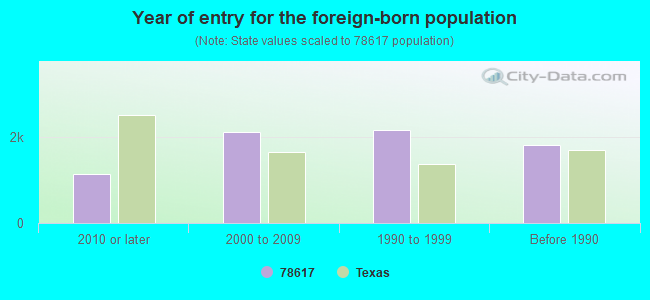
Year of entry for the foreign-born population
1,152 2010 or later 2,118 2000 to 2009 2,166 1990 to 1999 1,815 Before 1990
Housing units lacking complete plumbing facilities: 0.5%
Housing units lacking complete kitchen facilities: 1.5%
78.1% Electricity 15.7% Utility gas 5.5% Bottled, tank, or LP gas
Population in 1990: 5,635. Population change in the 1990s: +9,592 (+170.2%).
Place of birth for U.S.-born residents:
This state: 18,359Northeast: 351Midwest: 1,221South: 781West: 1,712
47% of the 78617 zip code residents lived in the same house 5 years ago.
Out of people who lived in different houses, 53% lived in this county.
Out of people who lived in different counties, 50% lived in Texas.
84% of the 78617 zip code residents lived in the same house 1 year ago.
Out of people who lived in different houses, 61% moved from this county.
Out of people who lived in different houses, 26% moved from different county within same state.
Out of people who lived in different houses, 9% moved from different state.
Out of people who lived in different houses, 1% moved from abroad.
Private vs. public school enrollment:
Students in private schools in grades 1 to 8 (elementary and middle school): 229
Students in private schools in grades 9 to 12 (high school): 89
Students in private undergraduate colleges: 172
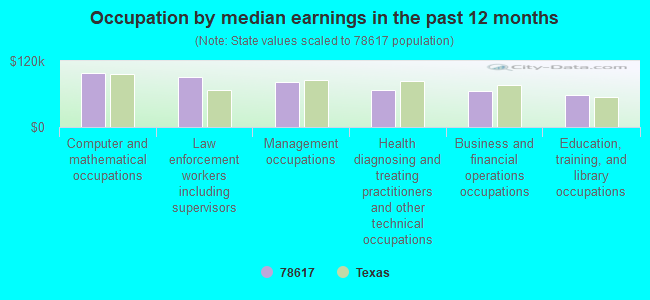
Occupation by median earnings in the past 12 months ($)
97,838 Computer and mathematical occupations 90,915 Law enforcement workers including supervisors 82,293 Management occupations 66,757 Health diagnosing and treating practitioners and other technical occupations 66,233 Business and financial operations occupations 58,417 Education, training, and library occupations
Companies with federal contracts located in this zip code:
A & R DEMOLITION, INC (13201 FM 812 in DEL VALLE, TX; small business) in 2 contracts in 2001
$594,000 with Navy for Maintenance, Repair or Alteration of Real Property -- Maintenance Buildings. Signed on 2001-04-19. Completion date: 2001-10-31.
, same as above. Signed on 2001-11-27. Completion date: 2001-12-15.
Top industries in this zip code by the number of employees in 2005:
Construction: Site Preparation Contractors (50-99 employees: 1 establishment, 20-49 employees: 1 establishment, 5-9 employees: 1 establishment, 1-4 employees: 1 establishment)Accommodation and Food Services: Limited-Service Restaurants (20-49: 1, 5-9: 1)Other Services (except Public Administration): Parking Lots and Garages (20-49: 1)Health Care and Social Assistance: Other Residential Care Facilities (20-49: 1)Administrative and Support and Waste Management and Remediation Services: Facilities Support Services (20-49: 1)Construction: Water and Sewer Line and Related Structures Construction (10-19: 2)Accommodation and Food Services: Hotels (except Casino Hotels) and Motels (10-19: 1, 5-9: 1)
People in group quarters in 2010:
1,684 people in local jails and other municipal confinement facilities
261 people in correctional residential facilities
6 people in other noninstitutional facilities
People in group quarters in 2000:
1,906 people in local jails and other confinement facilities (including police lockups)
89 people in other types of correctional institutions
8 people in religious group quarters
Fatal accident statistics in 2014:
Fatal accident count: 10Vehicles involved in fatal accidents: 17Fatal accidents caused by drunken drivers: 2Fatalities: 10Persons involved in fatal accidents: 26Pedestrians involved in fatal accidents: 0
Fatal accident statistics in 2013:
Fatal accident count: 9Vehicles involved in fatal accidents: 15Fatal accidents caused by drunken drivers: 4Fatalities: 10Persons involved in fatal accidents: 22Pedestrians involved in fatal accidents: 1
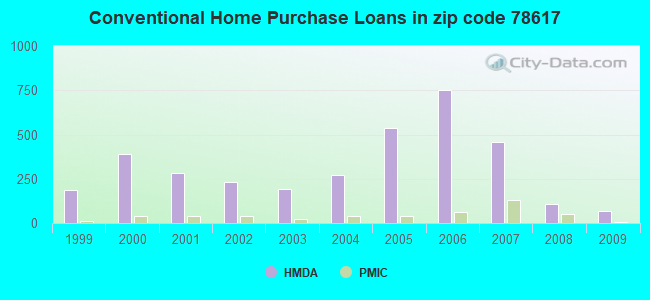
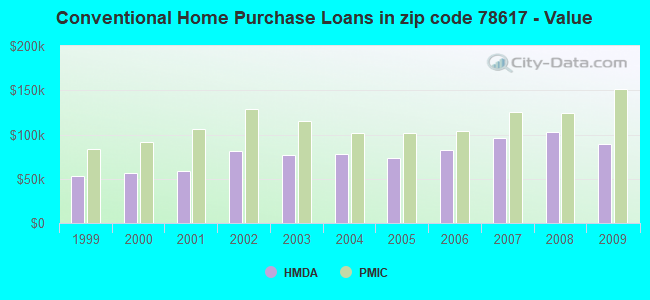
Home Mortgage Disclosure Act Aggregated Statistics For Year 2009(Based on 6 partial tracts) A) FHA, FSA/RHS & VA B) Conventional C) Refinancings D) Home Improvement Loans F) Non-occupant Loans on G) Loans On Manufactured Number Average Value Number Average Value Number Average Value Number Average Value Number Average Value Number Average Value
LOANS ORIGINATED 268 $121,080 68 $89,089 118 $125,505 23 $35,029 19 $73,416 23 $60,390 APPLICATIONS APPROVED, NOT ACCEPTED 25 $109,782 8 $68,722 26 $99,394 5 $19,792 0 $0 10 $53,422 APPLICATIONS DENIED 131 $116,068 44 $91,839 171 $110,500 40 $38,560 15 $80,503 39 $65,788 APPLICATIONS WITHDRAWN 82 $116,222 20 $83,924 77 $120,818 12 $114,254 5 $110,728 8 $104,642 FILES CLOSED FOR INCOMPLETENESS 12 $111,604 2 $422,460 32 $114,376 1 $55,540 0 $0 5 $79,172
Aggregated Statistics For Year 2008(Based on 6 partial tracts) A) FHA, FSA/RHS & VA B) Conventional C) Refinancings D) Home Improvement Loans F) Non-occupant Loans on G) Loans On Manufactured Number Average Value Number Average Value Number Average Value Number Average Value Number Average Value Number Average Value
LOANS ORIGINATED 266 $129,989 109 $103,229 121 $112,548 23 $36,630 32 $86,701 28 $77,231 APPLICATIONS APPROVED, NOT ACCEPTED 24 $106,630 28 $83,587 32 $96,172 7 $39,743 12 $89,916 31 $65,478 APPLICATIONS DENIED 127 $135,037 76 $96,155 302 $117,552 98 $30,365 22 $90,137 61 $65,587 APPLICATIONS WITHDRAWN 103 $129,637 36 $130,409 72 $115,787 12 $49,502 4 $106,735 6 $62,192 FILES CLOSED FOR INCOMPLETENESS 10 $131,116 7 $99,154 14 $105,146 5 $31,536 0 $0 1 $53,470
Aggregated Statistics For Year 2007(Based on 6 partial tracts) A) FHA, FSA/RHS & VA B) Conventional C) Refinancings D) Home Improvement Loans F) Non-occupant Loans on G) Loans On Manufactured Number Average Value Number Average Value Number Average Value Number Average Value Number Average Value Number Average Value
LOANS ORIGINATED 209 $134,216 460 $95,596 131 $108,825 29 $43,491 96 $83,022 58 $65,492 APPLICATIONS APPROVED, NOT ACCEPTED 11 $101,918 72 $99,519 43 $93,526 5 $32,736 20 $108,254 24 $63,229 APPLICATIONS DENIED 52 $138,382 195 $95,843 375 $108,154 97 $35,983 47 $93,523 96 $60,118 APPLICATIONS WITHDRAWN 51 $133,045 99 $106,520 131 $108,836 4 $26,058 35 $100,375 11 $63,258 FILES CLOSED FOR INCOMPLETENESS 0 $0 30 $117,159 33 $107,571 2 $41,340 2 $99,245 2 $110,010
Aggregated Statistics For Year 2006(Based on 6 partial tracts) A) FHA, FSA/RHS & VA B) Conventional C) Refinancings D) Home Improvement Loans F) Non-occupant Loans on G) Loans On Manufactured Number Average Value Number Average Value Number Average Value Number Average Value Number Average Value Number Average Value
LOANS ORIGINATED 157 $126,593 752 $82,598 106 $107,363 29 $32,834 150 $72,378 59 $69,014 APPLICATIONS APPROVED, NOT ACCEPTED 4 $88,480 132 $72,372 49 $82,734 11 $35,326 36 $74,658 36 $50,663 APPLICATIONS DENIED 54 $115,328 279 $79,520 319 $103,000 79 $35,386 57 $76,943 100 $62,877 APPLICATIONS WITHDRAWN 75 $123,276 217 $85,897 187 $107,454 11 $33,501 46 $72,483 10 $92,508 FILES CLOSED FOR INCOMPLETENESS 2 $133,860 29 $86,649 32 $112,211 0 $0 3 $116,523 1 $70,720
Aggregated Statistics For Year 2005(Based on 6 partial tracts) A) FHA, FSA/RHS & VA B) Conventional C) Refinancings D) Home Improvement Loans F) Non-occupant Loans on G) Loans On Manufactured Number Average Value Number Average Value Number Average Value Number Average Value Number Average Value Number Average Value
LOANS ORIGINATED 188 $118,609 537 $73,143 170 $100,128 45 $45,463 131 $76,908 63 $74,276 APPLICATIONS APPROVED, NOT ACCEPTED 11 $89,172 103 $69,445 43 $96,700 12 $46,937 17 $93,260 58 $60,727 APPLICATIONS DENIED 67 $117,906 296 $67,099 369 $99,338 111 $29,340 68 $67,927 158 $51,205 APPLICATIONS WITHDRAWN 59 $129,694 134 $83,426 168 $107,084 29 $161,595 31 $91,186 14 $81,828 FILES CLOSED FOR INCOMPLETENESS 8 $128,167 20 $69,902 68 $110,163 0 $0 3 $85,253 0 $0
Aggregated Statistics For Year 2004(Based on 6 partial tracts) A) FHA, FSA/RHS & VA B) Conventional C) Refinancings D) Home Improvement Loans E) Loans on Dwellings For 5+ Families F) Non-occupant Loans on G) Loans On Manufactured Number Average Value Number Average Value Number Average Value Number Average Value Number Average Value Number Average Value Number Average Value
LOANS ORIGINATED 123 $110,937 271 $77,983 272 $95,793 39 $52,161 0 $0 60 $88,956 79 $65,228 APPLICATIONS APPROVED, NOT ACCEPTED 6 $110,953 46 $69,148 75 $97,925 7 $62,964 0 $0 11 $67,877 41 $51,632 APPLICATIONS DENIED 73 $118,601 202 $67,011 387 $95,804 81 $39,544 0 $0 24 $84,693 173 $54,185 APPLICATIONS WITHDRAWN 62 $126,068 46 $92,985 211 $97,994 21 $61,140 1 $3,843,520 17 $74,062 20 $74,884 FILES CLOSED FOR INCOMPLETENESS 6 $140,242 8 $112,185 62 $102,154 1 $164,080 0 $0 0 $0 0 $0
Aggregated Statistics For Year 2003(Based on 6 partial tracts) A) FHA, FSA/RHS & VA B) Conventional C) Refinancings D) Home Improvement Loans E) Loans on Dwellings For 5+ Families F) Non-occupant Loans on Number Average Value Number Average Value Number Average Value Number Average Value Number Average Value Number Average Value
LOANS ORIGINATED 245 $117,532 190 $77,372 387 $100,143 25 $17,436 0 $0 49 $80,796 APPLICATIONS APPROVED, NOT ACCEPTED 15 $107,422 44 $63,909 69 $99,697 19 $65,982 0 $0 7 $99,083 APPLICATIONS DENIED 163 $119,688 171 $60,215 455 $81,911 102 $17,508 1 $369,550 23 $66,564 APPLICATIONS WITHDRAWN 170 $121,186 44 $90,044 264 $102,708 6 $18,842 0 $0 13 $92,343 FILES CLOSED FOR INCOMPLETENESS 5 $101,044 14 $106,151 18 $114,034 2 $23,405 0 $0 3 $85,617
Aggregated Statistics For Year 2002(Based on 6 partial tracts) A) FHA, FSA/RHS & VA B) Conventional C) Refinancings D) Home Improvement Loans F) Non-occupant Loans on Number Average Value Number Average Value Number Average Value Number Average Value Number Average Value
LOANS ORIGINATED 564 $134,670 230 $81,390 226 $90,888 70 $10,851 39 $70,939 APPLICATIONS APPROVED, NOT ACCEPTED 10 $111,926 87 $54,945 74 $79,681 15 $43,881 2 $106,530 APPLICATIONS DENIED 56 $126,211 267 $59,683 214 $74,712 164 $17,370 19 $45,663 APPLICATIONS WITHDRAWN 600 $131,781 85 $115,287 162 $86,638 17 $13,229 14 $80,909 FILES CLOSED FOR INCOMPLETENESS 58 $142,548 17 $100,509 18 $93,122 0 $0 0 $0
Aggregated Statistics For Year 2001(Based on 6 partial tracts) A) FHA, FSA/RHS & VA B) Conventional C) Refinancings D) Home Improvement Loans F) Non-occupant Loans on Number Average Value Number Average Value Number Average Value Number Average Value Number Average Value
LOANS ORIGINATED 285 $120,375 285 $58,678 179 $91,734 72 $18,188 47 $80,995 APPLICATIONS APPROVED, NOT ACCEPTED 32 $110,111 125 $52,110 39 $58,878 17 $32,183 9 $53,371 APPLICATIONS DENIED 37 $116,012 486 $49,513 144 $79,613 93 $20,444 27 $41,046 APPLICATIONS WITHDRAWN 149 $127,844 55 $89,575 122 $84,595 18 $20,052 7 $51,599 FILES CLOSED FOR INCOMPLETENESS 108 $130,196 14 $111,496 18 $112,158 3 $37,447 0 $0
Aggregated Statistics For Year 2000(Based on 6 partial tracts) A) FHA, FSA/RHS & VA B) Conventional C) Refinancings D) Home Improvement Loans F) Non-occupant Loans on Number Average Value Number Average Value Number Average Value Number Average Value Number Average Value
LOANS ORIGINATED 101 $80,311 391 $56,844 78 $75,487 31 $17,253 32 $54,571 APPLICATIONS APPROVED, NOT ACCEPTED 26 $49,479 140 $48,385 18 $58,334 10 $20,796 2 $38,760 APPLICATIONS DENIED 51 $66,570 603 $45,751 68 $58,660 55 $17,791 28 $36,271 APPLICATIONS WITHDRAWN 22 $90,519 39 $79,176 30 $71,316 4 $8,748 4 $47,460 FILES CLOSED FOR INCOMPLETENESS 3 $110,080 11 $87,142 35 $79,646 1 $59,130 3 $83,060
Aggregated Statistics For Year 1999(Based on 3 partial tracts) A) FHA, FSA/RHS & VA B) Conventional C) Refinancings D) Home Improvement Loans F) Non-occupant Loans on Number Average Value Number Average Value Number Average Value Number Average Value Number Average Value
LOANS ORIGINATED 42 $89,373 189 $53,120 44 $69,566 11 $35,811 16 $57,490 APPLICATIONS APPROVED, NOT ACCEPTED 5 $70,870 114 $49,835 22 $55,306 5 $18,872 5 $31,274 APPLICATIONS DENIED 16 $87,307 356 $46,963 49 $58,898 35 $15,449 16 $56,009 APPLICATIONS WITHDRAWN 10 $90,339 23 $67,163 19 $63,454 1 $7,410 0 $0 FILES CLOSED FOR INCOMPLETENESS 1 $165,200 4 $87,975 8 $74,232 0 $0 0 $0
Detailed HMDA statistics for the following Tracts:
0023.10
,
0024.16 ,
9508.00
Private Mortgage Insurance Companies Aggregated Statistics For Year 2009(Based on 6 partial tracts) A) Conventional B) Refinancings Number Average Value Number Average Value
LOANS ORIGINATED 6 $151,710 3 $124,287 APPLICATIONS APPROVED, NOT ACCEPTED 7 $163,170 1 $217,300 APPLICATIONS DENIED 0 $0 1 $120,750 APPLICATIONS WITHDRAWN 0 $0 2 $102,915 FILES CLOSED FOR INCOMPLETENESS 2 $141,130 0 $0
Aggregated Statistics For Year 2008(Based on 6 partial tracts) A) Conventional B) Refinancings C) Non-occupant Loans on Number Average Value Number Average Value Number Average Value
LOANS ORIGINATED 50 $124,452 14 $141,288 6 $116,748 APPLICATIONS APPROVED, NOT ACCEPTED 24 $137,653 2 $178,170 7 $125,264 APPLICATIONS DENIED 6 $114,313 2 $151,900 3 $120,227 APPLICATIONS WITHDRAWN 1 $385,810 0 $0 0 $0 FILES CLOSED FOR INCOMPLETENESS 3 $90,063 0 $0 1 $119,730
Aggregated Statistics For Year 2007(Based on 6 partial tracts) A) Conventional B) Refinancings C) Non-occupant Loans on D) Loans On Manufactured Number Average Value Number Average Value Number Average Value Number Average Value
LOANS ORIGINATED 128 $125,425 13 $121,299 15 $102,230 2 $100,380 APPLICATIONS APPROVED, NOT ACCEPTED 23 $111,375 6 $126,878 6 $110,782 0 $0 APPLICATIONS DENIED 5 $119,156 0 $0 0 $0 0 $0 APPLICATIONS WITHDRAWN 9 $128,468 0 $0 0 $0 0 $0 FILES CLOSED FOR INCOMPLETENESS 0 $0 1 $130,080 0 $0 0 $0
Aggregated Statistics For Year 2006(Based on 6 partial tracts) A) Conventional B) Refinancings C) Non-occupant Loans on D) Loans On Manufactured Number Average Value Number Average Value Number Average Value Number Average Value
LOANS ORIGINATED 64 $103,699 2 $140,860 13 $101,409 5 $67,452 APPLICATIONS APPROVED, NOT ACCEPTED 6 $110,307 1 $192,160 1 $158,660 0 $0 APPLICATIONS DENIED 0 $0 0 $0 0 $0 0 $0 APPLICATIONS WITHDRAWN 2 $58,270 1 $193,640 1 $84,800 0 $0 FILES CLOSED FOR INCOMPLETENESS 0 $0 0 $0 0 $0 0 $0
Aggregated Statistics For Year 2005(Based on 4 partial tracts) A) Conventional B) Refinancings C) Non-occupant Loans on D) Loans On Manufactured Number Average Value Number Average Value Number Average Value Number Average Value
LOANS ORIGINATED 41 $102,250 5 $135,132 15 $110,527 2 $83,660 APPLICATIONS APPROVED, NOT ACCEPTED 7 $128,419 1 $66,580 3 $84,257 1 $28,630 APPLICATIONS DENIED 2 $71,350 0 $0 0 $0 0 $0 APPLICATIONS WITHDRAWN 2 $102,390 1 $153,730 0 $0 0 $0 FILES CLOSED FOR INCOMPLETENESS 0 $0 0 $0 0 $0 0 $0
Aggregated Statistics For Year 2004(Based on 6 partial tracts) A) Conventional B) Refinancings C) Non-occupant Loans on D) Loans On Manufactured Number Average Value Number Average Value Number Average Value Number Average Value
LOANS ORIGINATED 37 $101,268 14 $110,776 9 $97,593 4 $81,742 APPLICATIONS APPROVED, NOT ACCEPTED 1 $48,990 7 $102,480 0 $0 0 $0 APPLICATIONS DENIED 0 $0 1 $56,580 0 $0 0 $0 APPLICATIONS WITHDRAWN 2 $154,215 3 $104,447 0 $0 1 $192,170 FILES CLOSED FOR INCOMPLETENESS 0 $0 0 $0 0 $0 0 $0
Aggregated Statistics For Year 2003(Based on 6 partial tracts) A) Conventional B) Refinancings C) Non-occupant Loans on Number Average Value Number Average Value Number Average Value
LOANS ORIGINATED 25 $115,280 29 $111,963 8 $104,764 APPLICATIONS APPROVED, NOT ACCEPTED 2 $102,620 14 $90,845 4 $109,128 APPLICATIONS DENIED 2 $120,675 2 $118,360 1 $208,430 APPLICATIONS WITHDRAWN 4 $122,375 3 $122,777 3 $132,650 FILES CLOSED FOR INCOMPLETENESS 2 $94,115 1 $128,600 0 $0
Aggregated Statistics For Year 2002(Based on 6 partial tracts) A) Conventional B) Refinancings C) Non-occupant Loans on Number Average Value Number Average Value Number Average Value
LOANS ORIGINATED 41 $128,300 22 $126,525 6 $96,380 APPLICATIONS APPROVED, NOT ACCEPTED 8 $126,769 3 $112,507 4 $116,948 APPLICATIONS DENIED 3 $118,260 0 $0 0 $0 APPLICATIONS WITHDRAWN 5 $114,730 2 $76,285 0 $0 FILES CLOSED FOR INCOMPLETENESS 0 $0 0 $0 0 $0
Aggregated Statistics For Year 2001(Based on 6 partial tracts) A) Conventional B) Refinancings C) Non-occupant Loans on Number Average Value Number Average Value Number Average Value
LOANS ORIGINATED 38 $106,629 14 $111,689 5 $90,954 APPLICATIONS APPROVED, NOT ACCEPTED 8 $143,362 4 $99,830 0 $0 APPLICATIONS DENIED 3 $84,250 0 $0 0 $0 APPLICATIONS WITHDRAWN 0 $0 0 $0 0 $0 FILES CLOSED FOR INCOMPLETENESS 0 $0 1 $72,790 0 $0
Aggregated Statistics For Year 2000(Based on 6 partial tracts) A) Conventional B) Refinancings C) Non-occupant Loans on Number Average Value Number Average Value Number Average Value
LOANS ORIGINATED 39 $92,010 10 $84,267 6 $81,302 APPLICATIONS APPROVED, NOT ACCEPTED 3 $100,517 2 $96,660 0 $0 APPLICATIONS DENIED 2 $62,165 0 $0 1 $59,130 APPLICATIONS WITHDRAWN 1 $83,440 0 $0 1 $83,440 FILES CLOSED FOR INCOMPLETENESS 0 $0 1 $74,860 0 $0
Aggregated Statistics For Year 1999(Based on 3 partial tracts) A) Conventional B) Refinancings C) Non-occupant Loans on Number Average Value Number Average Value Number Average Value
LOANS ORIGINATED 11 $83,267 1 $134,630 6 $61,597 APPLICATIONS APPROVED, NOT ACCEPTED 2 $93,580 1 $160,090 0 $0 APPLICATIONS DENIED 3 $90,757 1 $141,490 0 $0 APPLICATIONS WITHDRAWN 0 $0 0 $0 0 $0 FILES CLOSED FOR INCOMPLETENESS 0 $0 0 $0 0 $0
Detailed PMIC statistics for the following Tracts:
0023.10
,
0024.16 ,
9508.00
2002 - 2018 National Fire Incident Reporting System (NFIRS) incidents See full 2006 National Fire Incident Reporting System statistics for zip code 78617, Texas
Most common first names in zip code 78617 among deceased individuals Name Count Lived (average)
William 23 72.8 years James 19 65.3 years John 18 72.4 years Mary 18 76.9 years Robert 17 68.0 years Charles 14 63.0 years Joe 10 67.8 years Frank 10 74.4 years Betty 10 70.7 years Henry 9 76.5 years
Most common last names in zip code 78617 among deceased individuals Last name Count Lived (average)
Johnson 15 78.8 years Nelson 12 77.9 years White 12 71.0 years Jones 10 68.7 years Rodriguez 10 70.5 years Smith 8 72.7 years Brown 7 70.4 years Hernandez 7 68.4 years Davis 6 86.0 years Perkins 6 64.5 years
Businesses in zip code 78617
Name Count Name Count
Circle K 1 Subway 1 SONIC Drive-In 1 U-Haul 1


 Nearest zip codes: 78725, 78719, 78742, 78744, 78612, 78741.
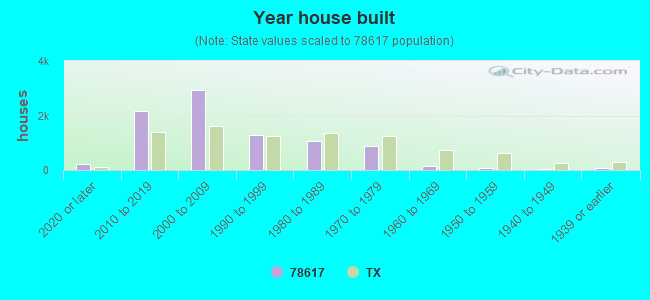


 : $590,517 in 2 contracts in 2001
 Based on the data from the years 2002 - 2018 the average number of fires per year is 60. The highest number of fires - 211 took place in 2014, and the least - 16 in 2003. The data has a rising trend.
 When looking into fire subcategories, the most reports belonged to: Outside Fires (57.8%), and Structure Fires (25.1%).