Estimated zip code population in 2022: 4,773 Zip code population in 2010: 8,056 Zip code population in 2000: 3,729
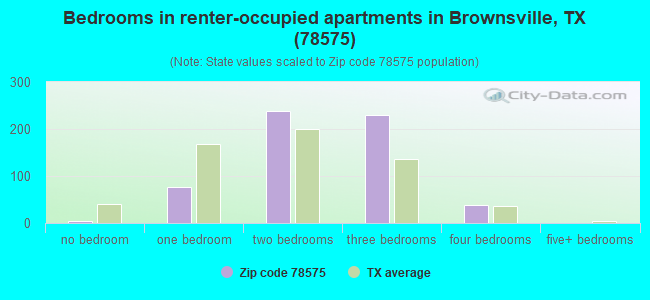
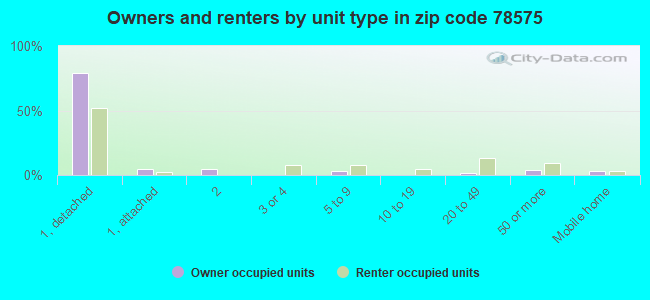
Houses and condos: 1,938 Renter-occupied apartments: 598
% of renters here:
35%
State:
38%
March 2022 cost of living index in zip code 78575: 80.1 (low, U.S. average is 100)
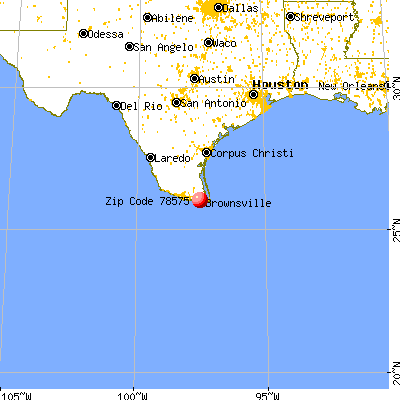
Land area: 12.3 sq. mi. Water area: 0.5 sq. mi.
Population density: 387 people per square mile
(very low).
OSM Map
General Map
Google Map
MSN Map
OSM Map
General Map
Google Map
MSN Map
OSM Map
General Map
Google Map
MSN Map
OSM Map
General Map
Google Map
MSN Map
Please wait while loading the map...
Real estate property taxes paid for housing units in 2022:
This zip code:
1.5% ($3,134)
Texas:
1.5% ($4,050)
Median real estate property taxes paid for housing units with mortgages in 2022: $4,825 (1.6%) Median real estate property taxes paid for housing units with no mortgage in 2022: $2,433 (1.5%)
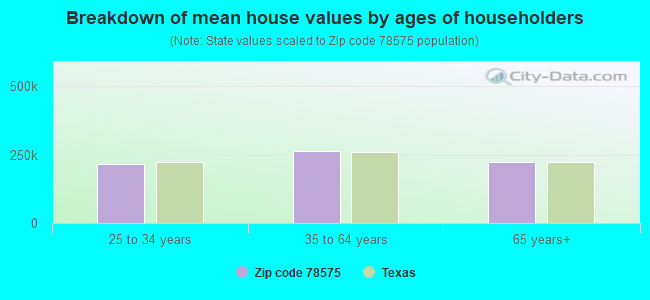
Estimated median house/condo value in 2022: $206,087
78575:
$206,087
Texas:
$275,400
According to our research of Texas and other state lists, there were 11 registered sex offenders living in 78575 zip code as of May 22, 2024. The ratio of all residents to sex offenders in zip code 78575 is 887 to 1. The ratio of registered sex offenders to all residents in this zip code is lower than the state average.
Median resident age:
This zip code:
38.8 years
Texas median age:
35.6 years
Average household size:
This zip code:
2.8 people
Texas:
2.6 people
Averages for the 2020 tax year for zip code 78575, filed in 2021:
Average Adjusted Gross Income (AGI) in 2020: $75,493 (Individual Income Tax Returns)
Here:
$75,493
State:
$77,054
Salary/wage: $60,313 (reported on 79.4% of returns)
Here:
$60,313
State:
$62,766
(% of AGI for various income ranges: 1107.4% for AGIs below $25k, 3522.3% for AGIs $25k-50k, 6566.4% for AGIs $50k-75k, 10076.0% for AGIs $75k-100k, 19710.0% for AGIs $100k-200k, 105427.5% for AGIs over 200k)
Taxable interest for individuals: $2,667 (reported on 20.6% of returns)
This zip code:
$2,667
Texas:
$2,665
(% of AGI for various income ranges: 10.0% for AGIs below $25k, 25.3% for AGIs $25k-50k, 21.8% for AGIs $50k-75k, 110.0% for AGIs $75k-100k, 327.3% for AGIs $100k-200k, 1357.5% for AGIs over 200k)
Ordinary dividends: $18,686 (reported on 11.5% of returns)
Here:
$18,686
State:
$10,044
(% of AGI for various income ranges: 17.0% for AGIs below $25k, 36.2% for AGIs $25k-50k, 75.5% for AGIs $50k-75k, 418.7% for AGIs $100k-200k, 10815.0% for AGIs over 200k)
Net capital gain/loss in AGI: +$33,516 (reported on 12.6% of returns)
Here:
+$33,516
State:
+$39,590
(% of AGI for various income ranges: 4.3% for AGIs below $25k, 11.1% for AGIs $25k-50k, 193.6% for AGIs $50k-75k, 747.3% for AGIs $100k-200k, 22732.5% for AGIs over 200k)
Profit/loss from business: +$16,948 (reported on 23.7% of returns)
Here:
+$16,948
State:
+$10,888
(% of AGI for various income ranges: 228.4% for AGIs below $25k, 73.2% for AGIs $25k-50k, 413.6% for AGIs $50k-75k, 364.0% for AGIs $75k-100k, 1092.0% for AGIs $100k-200k, 12942.5% for AGIs over 200k)
Taxable individual retirement arrangement distribution: $20,669 (reported on 5.1% of returns)
78575:
$20,669
Texas:
$24,740
(% of AGI for various income ranges: 75.7% for AGIs $25k-50k, 386.8% for AGIs $50k-75k, 986.7% for AGIs $100k-200k)
Total itemized deductions: $37,942 (reported on 4.7% of returns)
Here:
$37,942
State:
$40,428
(% of AGI for various income ranges: 469.1% for AGIs $50k-75k, 1093.3% for AGIs $100k-200k, 4702.5% for AGIs over 200k)
Charity contributions: $10,164 (reported on 4.3% of returns)
Here:
$10,164
State:
$18,201
(% of AGI for various income ranges: 33.2% for AGIs $25k-50k, 337.3% for AGIs $100k-200k, 1140.0% for AGIs over 200k)
Taxes paid: $8,367 (reported on 4.7% of returns)
78575:
$8,367
State:
$7,821
(% of AGI for various income ranges: 126.4% for AGIs $50k-75k, 223.3% for AGIs $100k-200k, 977.5% for AGIs over 200k)
Earned income credit: $2,691 (reported on 26.1% of returns)
Here:
$2,691
State:
$2,584
(% of AGI for various income ranges: 168.3% for AGIs below $25k, 105.7% for AGIs $25k-50k)
Percentage of individuals using paid preparers for their 2020 taxes: 90.5%
Here:
91%
State:
92%
(% for various income ranges: 88.9% for AGIs below $25k, 93.1% for AGIs $25k-50k, 90.9% for AGIs $50k-75k, 87.5% for AGIs $75k-100k, 90.0% for AGIs $100k-200k, 94.1% for AGIs over 200k)
Averages for the 2012 tax year for zip code 78575, filed in 2013:
Average Adjusted Gross Income (AGI) in 2012: $68,003 (Individual Income Tax Returns)
Here:
$68,003
State:
$65,384
Salary/wage: $52,478 (reported on 81.3% of returns)
Here:
$52,478
State:
$52,524
(% of AGI for various income ranges: 71.2% for AGIs below $25k, 80.0% for AGIs $25k-50k, 81.5% for AGIs $50k-75k, 75.6% for AGIs $75k-100k, 73.0% for AGIs $100k-200k, 43.3% for AGIs over 200k)
Taxable interest for individuals: $3,567 (reported on 24.7% of returns)
This zip code:
$3,567
Texas:
$2,372
(% of AGI for various income ranges: 1.1% for AGIs below $25k, 0.9% for AGIs $25k-50k, 0.2% for AGIs $50k-75k, 1.4% for AGIs $75k-100k, 0.7% for AGIs $100k-200k, 2.0% for AGIs over 200k)
Ordinary dividends: $10,144 (reported on 13.6% of returns)
Here:
$10,144
State:
$9,721
(% of AGI for various income ranges: 1.0% for AGIs below $25k, 0.9% for AGIs $25k-50k, 1.6% for AGIs $50k-75k, 1.3% for AGIs $75k-100k, 1.8% for AGIs $100k-200k, 3.0% for AGIs over 200k)
Net capital gain/loss in AGI: +$28,626 (reported on 11.6% of returns)
Here:
+$28,626
State:
+$35,319
(% of AGI for various income ranges: 1.0% for AGIs $25k-50k, 0.6% for AGIs $75k-100k, 1.5% for AGIs $100k-200k, 10.9% for AGIs over 200k)
Profit/loss from business: +$22,842 (reported on 24.2% of returns)
Here:
+$22,842
State:
+$13,732
(% of AGI for various income ranges: 16.8% for AGIs below $25k, 4.5% for AGIs $25k-50k, 5.0% for AGIs $50k-75k, 2.3% for AGIs $75k-100k, 4.5% for AGIs $100k-200k, 11.5% for AGIs over 200k)
Taxable individual retirement arrangement distribution: $22,775 (reported on 6.1% of returns)
78575:
$22,775
Texas:
$19,511
(% of AGI for various income ranges: 1.6% for AGIs below $25k, 2.4% for AGIs $25k-50k, 3.8% for AGIs $75k-100k, 6.1% for AGIs $100k-200k)
Self-employment retirement plans: $21,650 (reported on 1.0% of returns)
78575:
$21,650
Texas:
$23,938
(% of AGI for various income ranges: 3.4% for AGIs $50k-75k)
Total itemized deductions: $21,964 (14% of AGI, reported on 25.3% of returns)
Here:
$21,964
State:
$24,724
Here:
14.2% of AGI
State:
15.9% of AGI
(% of AGI for various income ranges: 4.1% for AGIs below $25k, 9.3% for AGIs $25k-50k, 11.1% for AGIs $50k-75k, 12.8% for AGIs $75k-100k, 9.7% for AGIs $100k-200k, 6.1% for AGIs over 200k)
Charity contributions: $3,919 (reported on 18.7% of returns)
Here:
$3,919
State:
$6,808
(% of AGI for various income ranges: 0.9% for AGIs $25k-50k, 0.9% for AGIs $50k-75k, 1.6% for AGIs $75k-100k, 1.6% for AGIs $100k-200k, 1.0% for AGIs over 200k)
Taxes paid: $7,429 (reported on 24.7% of returns)
78575:
$7,429
State:
$6,921
(% of AGI for various income ranges: 1.3% for AGIs below $25k, 2.5% for AGIs $25k-50k, 2.7% for AGIs $50k-75k, 3.4% for AGIs $75k-100k, 3.4% for AGIs $100k-200k, 2.5% for AGIs over 200k)
Earned income credit: $2,743 (reported on 28.3% of returns)
Here:
$2,743
State:
$2,570
(% of AGI for various income ranges: 11.8% for AGIs below $25k, 1.5% for AGIs $25k-50k)
Percentage of individuals using paid preparers for their 2012 taxes: 61.1%
Here:
61%
State:
51%
(% for various income ranges: 60.5% for AGIs below $25k, 55.8% for AGIs $25k-50k, 57.1% for AGIs $50k-75k, 60.0% for AGIs $75k-100k, 61.9% for AGIs $100k-200k, 91.7% for AGIs over 200k)
Averages for the 2004 tax year for zip code 78575, filed in 2005:
Average Adjusted Gross Income (AGI) in 2004: $64,318 (Individual Income Tax Returns)
Here:
$64,318
State:
$47,881
Salary/wage: $42,377 (reported on 81.4% of returns)
Here:
$42,377
State:
$41,947
(% of AGI for various income ranges: 76.9% for AGIs $10k-25k, 82.6% for AGIs $25k-50k, 74.5% for AGIs $50k-75k, 80.7% for AGIs $75k-100k, 35.5% for AGIs over 100k)
Taxable interest for individuals: $4,834 (reported on 32.5% of returns)
This zip code:
$4,834
Texas:
$2,255
(% of AGI for various income ranges: 2.1% for AGIs $10k-25k, 2.3% for AGIs $25k-50k, 1.5% for AGIs $50k-75k, 1.6% for AGIs $75k-100k, 2.6% for AGIs over 100k)
Taxable dividends: $7,649 (reported on 17.9% of returns)
Here:
$7,649
State:
$4,261
(% of AGI for various income ranges: 0.8% for AGIs $10k-25k, 1.5% for AGIs $25k-50k, 1.7% for AGIs $50k-75k, 2.0% for AGIs $75k-100k, 2.4% for AGIs over 100k)
Net capital gain/loss: +$17,502 (reported on 15.4% of returns)
Here:
+$17,502
State:
+$16,110
(% of AGI for various income ranges: 0.3% for AGIs $10k-25k, 0.7% for AGIs $25k-50k, 1.7% for AGIs $50k-75k, 0.2% for AGIs $75k-100k, 6.2% for AGIs over 100k)
Profit/loss from business: +$16,312 (reported on 23.2% of returns)
Here:
+$16,312
State:
+$11,013
(% of AGI for various income ranges: 11.5% for AGIs $10k-25k, 4.2% for AGIs $25k-50k, 3.7% for AGIs $50k-75k, 0.9% for AGIs $75k-100k, 6.5% for AGIs over 100k)
IRA payment deduction: $3,898 (reported on 2.6% of returns)
78575:
$3,898
Texas:
$3,120
Self-employed pension: $25,333 (reported on 1.0% of returns)
Here:
$25,333
Texas:
$16,401
Total itemized deductions: $18,746 (16% of AGI, reported on 24.1% of returns)
Here:
$18,746
State:
$19,631
Here:
15.9% of AGI
State:
18.9% of AGI
(% of AGI for various income ranges: 4.8% for AGIs $10k-25k, 9.5% for AGIs $25k-50k, 13.3% for AGIs $50k-75k, 13.4% for AGIs $75k-100k, 4.7% for AGIs over 100k)
Charity contributions deductions: $3,303 (3% of AGI, reported on 19.0% of returns)
Here:
$3,303
State:
$4,753
Here:
2.5% of AGI
State:
4.2% of AGI
(% of AGI for various income ranges: 0.4% for AGIs $10k-25k, 1.0% for AGIs $25k-50k, 1.1% for AGIs $50k-75k, 2.1% for AGIs $75k-100k, 0.9% for AGIs over 100k)
Total tax: $15,382 (reported on 65.7% of returns)
78575:
$15,382
State:
$9,058
(% of AGI for various income ranges: 3.5% for AGIs $10k-25k, 6.3% for AGIs $25k-50k, 8.7% for AGIs $50k-75k, 10.1% for AGIs $75k-100k, 20.8% for AGIs over 100k)
Earned income credit: $2,189 (reported on 30.4% of returns)
Here:
$2,189
State:
$2,024
Percentage of individuals using paid preparers for their 2004 taxes: 68.2%
Here:
68%
State:
57%
(% for various income ranges: 66.2% for AGIs below $10k, 71.8% for AGIs $10k-25k, 63.5% for AGIs $25k-50k, 60.4% for AGIs $50k-75k, 64.9% for AGIs $75k-100k, 81.5% for AGIs over 100k)
Likely homosexual households (counted as self-reported same-sex unmarried-partner households)
Lesbian couples: 0.0% of all households
Gay men: 0.9% of all households
Household received Food Stamps/SNAP in the past 12 months: 241 Household did not receive Food Stamps/SNAP in the past 12 months: 1,490
Women who had a birth in the past 12 months: 38 (7 now married, 29 unmarried) Women who did not have a birth in the past 12 months: 1,077 (633 now married, 438 unmarried)
Housing units in zip code 78575 with a mortgage: 376 (5 second mortgage) Median monthly owner costs for units with a mortgage: $2,161 Median monthly owner costs for units without a mortgage: $572
Residents with income below the poverty level in 2022:
This zip code:
15.5%
Whole state:
14.0%
Residents with income below 50% of the poverty level in 2022:
This zip code:
10.2%
Whole state:
7.4%
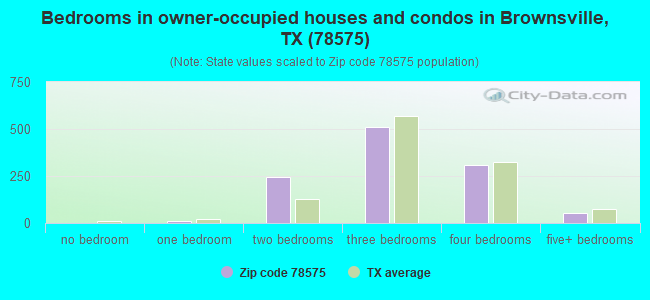
Median number of rooms in houses and condos:
Here:
5.7
State:
6.3
Median number of rooms in apartments:
Here:
4.1
State:
4.0
Notable locations in this zip code not listed on our city pages
Notable locations in zip code 78575: Rancho Viejo Chief of Police (A), Rancho Viejo Volunteer Fire Department (B), Rancho Viejo Police Department (C), Cameron County Sheriff's Office (D). Display/hide their locations on the map
In group quarters: 4 (-1 institutionalized population)
Size of family households: 512 2-persons, 350 3-persons, 276 4-persons, 122 5-persons, 40 6-persons, 8 7-or-more-persons
Size of nonfamily households: 350 1-person, 62 2-persons
598 married couples with children.
439 single-parent households (98 men, 341 women).
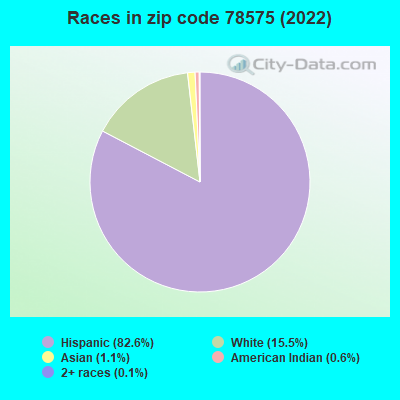
22.0% of residents of 78575 zip code speak English at home.
75.9% of residents speak Spanish at home (73% very well, 12% well, 10% not well, 5% not at all).
0.7% of residents speak other Indo-European language at home (77% very well, 23% well).
0.8% of residents speak Asian or Pacific Island language at home (100% very well).
0.2% of residents speak other language at home (100% very well).
Foreign born population: 1,418 (29.7%) (48.2% of them are naturalized citizens)
This zip code:
29.7%
Whole state:
17.2%
85%Honduras
2%Philippines
1%Bhutan
1%Mexico
0%Sweden
0%Greece
0%India
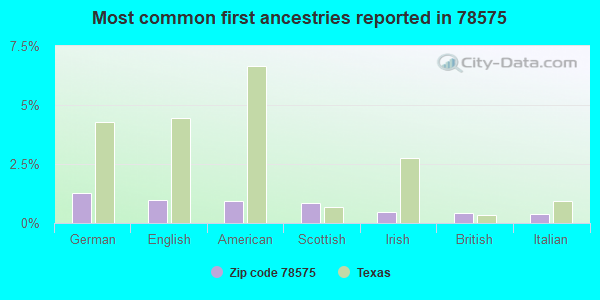
1%German
1%English
1%American
1%Scottish
0%Irish
0%British
0%Italian
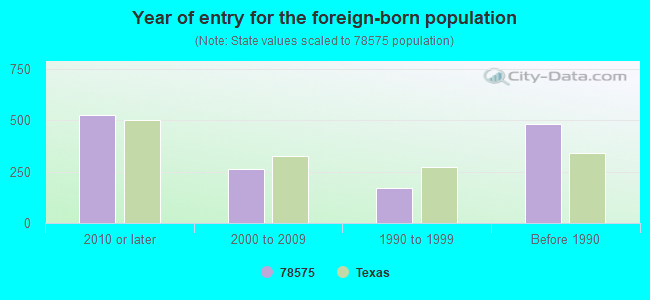
Year of entry for the foreign-born population
5252010 or later
2612000 to 2009
1711990 to 1999
482Before 1990
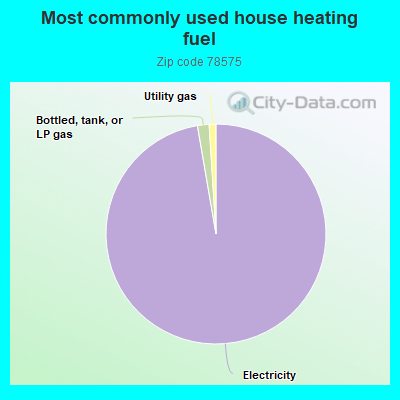
Housing units lacking complete kitchen facilities: 0.3%
97.3%Electricity
1.7%Bottled, tank, or LP gas
1.0%Utility gas
Place of birth for U.S.-born residents:
This state: 2,866
Northeast: 29
Midwest: 159
South: 159
West: 106
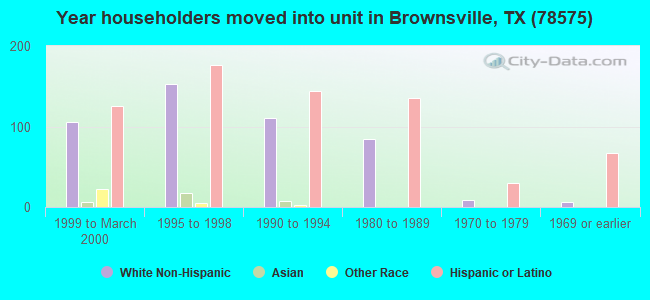
59% of the 78575 zip code residents lived in the same house 5 years ago. Out of people who lived in different houses, 61% lived in this county. Out of people who lived in different counties, 50% lived in Texas.
90% of the 78575 zip code residents lived in the same house 1 year ago. Out of people who lived in different houses, 89% moved from this county. Out of people who lived in different houses, 2% moved from different county within same state. Out of people who lived in different houses, 3% moved from abroad.
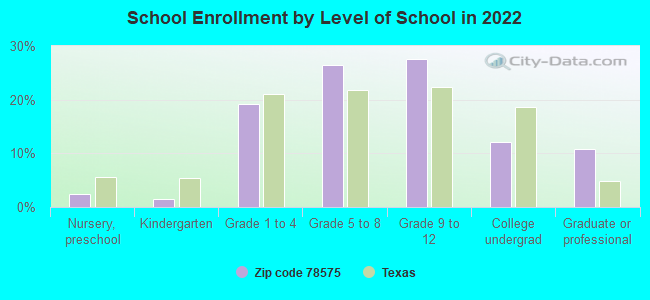
Private vs. public school enrollment:
Students in private schools in grades 1 to 8 (elementary and middle school): 116
Here:
17.6%
Texas:
8.8%
Students in private schools in grades 9 to 12 (high school): 30
Here:
7.7%
Texas:
8.0%
Students in private undergraduate colleges:
Here:
0.0%
Texas:
16.2%
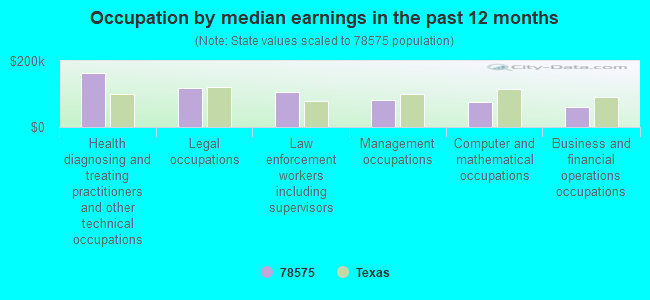
Occupation by median earnings in the past 12 months ($)
165,031Health diagnosing and treating practitioners and other technical occupations
119,522Legal occupations
106,632Law enforcement workers including supervisors
80,571Management occupations
75,446Computer and mathematical occupations
59,364Business and financial operations occupations
Top industries in this zip code by the number of employees in 2005:
Accommodation and Food Services: Hotels (except Casino Hotels) and Motels (50-99 employees: 1 establishment)
Administrative and Support and Waste Management and Remediation Services: Solid Waste Collection (10-19: 1, 1-4: 1)
Utilities: Water Supply and Irrigation Systems (10-19: 1)
Construction: Plumbing, Heating, and Air-Conditioning Contractors (10-19: 1)
Finance and Insurance: Commercial Banking (10-19: 1)
Administrative and Support and Waste Management and Remediation Services: Landscaping Services (5-9: 1, 1-4: 3)
Wholesale Trade: Industrial Machinery and Equipment Merchant Wholesalers (1-4: 4)
Real Estate and Rental and Leasing: Video Tape and Disc Rental (5-9: 1)
Fatal accident statistics in 2014:
Fatal accident count: 1
Vehicles involved in fatal accidents: 2
Fatal accidents caused by drunken drivers: 0
Fatalities: 2
Persons involved in fatal accidents: 2
Pedestrians involved in fatal accidents: 0
Fatal accident statistics in 2013:
Fatal accident count: 1
Vehicles involved in fatal accidents: 4
Fatal accidents caused by drunken drivers: 0
Fatalities: 1
Persons involved in fatal accidents: 4
Pedestrians involved in fatal accidents: 0
Home Mortgage Disclosure Act Aggregated Statistics For Year 2009 (Based on 6 partial tracts)
A) FHA, FSA/RHS & VA Home Purchase Loans
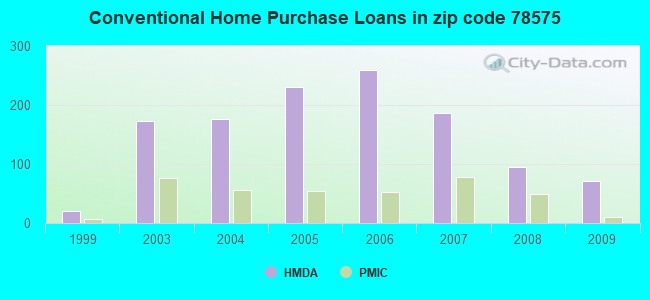
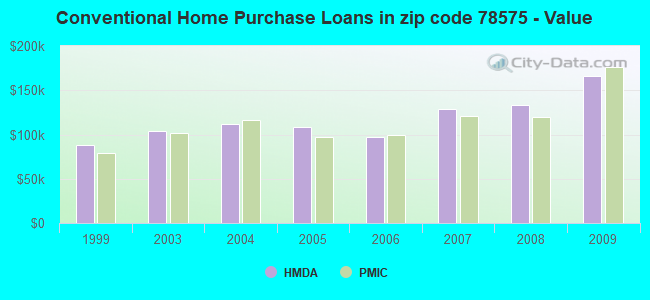
B) Conventional Home Purchase Loans
C) Refinancings
D) Home Improvement Loans
F) Non-occupant Loans on < 5 Family Dwellings (A B C & D)
G) Loans On Manufactured Home Dwelling (A B C & D)
Number
Average Value
Number
Average Value
Number
Average Value
Number
Average Value
Number
Average Value
Number
Average Value
LOANS ORIGINATED
59
$118,730
72
$166,010
87
$160,799
10
$45,420
20
$116,616
2
$170,260
APPLICATIONS APPROVED, NOT ACCEPTED
3
$117,110
11
$102,994
21
$135,375
2
$126,835
2
$46,275
2
$54,150
APPLICATIONS DENIED
8
$122,432
16
$169,239
83
$131,116
33
$29,204
9
$82,331
1
$55,950
APPLICATIONS WITHDRAWN
9
$119,759
7
$133,074
37
$143,172
5
$15,414
3
$148,913
0
$0
FILES CLOSED FOR INCOMPLETENESS
2
$84,280
0
$0
8
$102,459
0
$0
0
$0
0
$0
Aggregated Statistics For Year 2008 (Based on 6 partial tracts)
A) FHA, FSA/RHS & VA Home Purchase Loans
B) Conventional Home Purchase Loans
C) Refinancings
D) Home Improvement Loans
F) Non-occupant Loans on < 5 Family Dwellings (A B C & D)
G) Loans On Manufactured Home Dwelling (A B C & D)
Number
Average Value
Number
Average Value
Number
Average Value
Number
Average Value
Number
Average Value
Number
Average Value
LOANS ORIGINATED
40
$120,605
95
$133,180
78
$177,070
14
$101,772
51
$128,021
0
$0
APPLICATIONS APPROVED, NOT ACCEPTED
4
$93,160
11
$84,073
18
$114,813
1
$41,280
7
$92,729
0
$0
APPLICATIONS DENIED
10
$77,701
44
$149,131
98
$131,850
38
$18,417
25
$85,913
1
$18,100
APPLICATIONS WITHDRAWN
7
$126,437
9
$132,723
22
$147,929
4
$20,555
5
$71,642
0
$0
FILES CLOSED FOR INCOMPLETENESS
4
$88,298
3
$207,543
8
$123,312
0
$0
0
$0
0
$0
Aggregated Statistics For Year 2007 (Based on 6 partial tracts)
A) FHA, FSA/RHS & VA Home Purchase Loans
B) Conventional Home Purchase Loans
C) Refinancings
D) Home Improvement Loans
F) Non-occupant Loans on < 5 Family Dwellings (A B C & D)
G) Loans On Manufactured Home Dwelling (A B C & D)
Number
Average Value
Number
Average Value
Number
Average Value
Number
Average Value
Number
Average Value
Number
Average Value
LOANS ORIGINATED
27
$107,006
186
$128,895
102
$149,198
17
$63,589
36
$102,891
0
$0
APPLICATIONS APPROVED, NOT ACCEPTED
3
$147,757
29
$150,968
33
$140,848
10
$31,803
0
$0
2
$78,510
APPLICATIONS DENIED
4
$85,262
65
$112,491
145
$129,809
37
$36,287
17
$93,433
0
$0
APPLICATIONS WITHDRAWN
2
$69,340
22
$126,352
84
$118,765
4
$30,275
6
$60,902
2
$35,535
FILES CLOSED FOR INCOMPLETENESS
0
$0
10
$90,054
32
$178,584
2
$7,630
4
$69,002
0
$0
Aggregated Statistics For Year 2006 (Based on 6 partial tracts)
A) FHA, FSA/RHS & VA Home Purchase Loans
B) Conventional Home Purchase Loans
C) Refinancings
D) Home Improvement Loans
F) Non-occupant Loans on < 5 Family Dwellings (A B C & D)
G) Loans On Manufactured Home Dwelling (A B C & D)
Number
Average Value
Number
Average Value
Number
Average Value
Number
Average Value
Number
Average Value
Number
Average Value
LOANS ORIGINATED
21
$109,211
259
$97,361
82
$121,548
16
$66,634
48
$86,235
2
$49,920
APPLICATIONS APPROVED, NOT ACCEPTED
1
$85,470
36
$115,736
27
$150,595
9
$38,183
7
$99,850
2
$16,995
APPLICATIONS DENIED
3
$120,993
90
$102,348
102
$113,084
25
$41,972
27
$85,723
0
$0
APPLICATIONS WITHDRAWN
1
$114,510
43
$110,249
58
$113,360
3
$45,977
7
$205,850
0
$0
FILES CLOSED FOR INCOMPLETENESS
0
$0
8
$100,978
17
$121,559
2
$28,765
0
$0
0
$0
Aggregated Statistics For Year 2005 (Based on 6 partial tracts)
A) FHA, FSA/RHS & VA Home Purchase Loans
B) Conventional Home Purchase Loans
C) Refinancings
D) Home Improvement Loans
F) Non-occupant Loans on < 5 Family Dwellings (A B C & D)
G) Loans On Manufactured Home Dwelling (A B C & D)
Number
Average Value
Number
Average Value
Number
Average Value
Number
Average Value
Number
Average Value
Number
Average Value
LOANS ORIGINATED
22
$115,485
231
$108,249
95
$115,913
29
$59,868
52
$114,594
0
$0
APPLICATIONS APPROVED, NOT ACCEPTED
1
$56,950
52
$149,026
30
$106,393
10
$26,578
9
$88,664
3
$82,917
APPLICATIONS DENIED
3
$88,017
64
$89,619
118
$106,523
39
$33,797
21
$91,907
7
$14,259
APPLICATIONS WITHDRAWN
0
$0
36
$103,934
68
$123,991
15
$149,303
3
$201,223
0
$0
FILES CLOSED FOR INCOMPLETENESS
2
$69,380
14
$135,445
31
$168,480
0
$0
2
$84,610
0
$0
Aggregated Statistics For Year 2004 (Based on 6 partial tracts)
A) FHA, FSA/RHS & VA Home Purchase Loans
B) Conventional Home Purchase Loans
C) Refinancings
D) Home Improvement Loans
E) Loans on Dwellings For 5+ Families
F) Non-occupant Loans on < 5 Family Dwellings (A B C & D)
G) Loans On Manufactured Home Dwelling (A B C & D)
Number
Average Value
Number
Average Value
Number
Average Value
Number
Average Value
Number
Average Value
Number
Average Value
Number
Average Value
LOANS ORIGINATED
19
$86,179
176
$111,454
143
$115,481
18
$44,506
3
$67,177
43
$64,281
3
$34,407
APPLICATIONS APPROVED, NOT ACCEPTED
0
$0
42
$81,839
36
$147,108
4
$41,675
0
$0
11
$75,345
2
$28,975
APPLICATIONS DENIED
1
$107,840
43
$93,553
100
$101,067
29
$33,345
0
$0
14
$91,027
4
$51,872
APPLICATIONS WITHDRAWN
7
$113,747
22
$96,603
54
$118,539
1
$47,740
0
$0
3
$56,407
0
$0
FILES CLOSED FOR INCOMPLETENESS
0
$0
5
$153,670
19
$144,029
0
$0
0
$0
2
$211,525
0
$0
Aggregated Statistics For Year 2003 (Based on 6 partial tracts)
A) FHA, FSA/RHS & VA Home Purchase Loans
B) Conventional Home Purchase Loans
C) Refinancings
D) Home Improvement Loans
F) Non-occupant Loans on < 5 Family Dwellings (A B C & D)
Number
Average Value
Number
Average Value
Number
Average Value
Number
Average Value
Number
Average Value
LOANS ORIGINATED
24
$102,308
173
$104,064
195
$127,841
7
$8,430
46
$76,579
APPLICATIONS APPROVED, NOT ACCEPTED
2
$134,090
19
$79,378
39
$147,854
2
$12,645
4
$57,928
APPLICATIONS DENIED
1
$57,760
33
$100,288
116
$112,141
16
$12,983
12
$73,300
APPLICATIONS WITHDRAWN
6
$103,268
22
$161,565
70
$146,934
0
$0
0
$0
FILES CLOSED FOR INCOMPLETENESS
0
$0
0
$0
13
$184,702
0
$0
2
$51,610
Aggregated Statistics For Year 1999 (Based on 2 partial tracts)
A) FHA, FSA/RHS & VA Home Purchase Loans
B) Conventional Home Purchase Loans
C) Refinancings
D) Home Improvement Loans
F) Non-occupant Loans on < 5 Family Dwellings (A B C & D)
2002 - 2017 National Fire Incident Reporting System (NFIRS) incidents
According to the data from the years 2002 - 2017 the average number of fire incidents per year is 8. The highest number of fire incidents - 31 took place in 2005, and the least - 0 in 2012. The data has a declining trend.
When looking into fire subcategories, the most incidents belonged to: Outside Fires (68.2%), and Structure Fires (15.5%).
Fire incident types reported to NFIRS in Zip Code 78575


 Nearest zip codes: 78520, 78526, 78586, 78566, 78578, 78567.


 According to the data from the years 2002 - 2017 the average number of fire incidents per year is 8. The highest number of fire incidents - 31 took place in 2005, and the least - 0 in 2012. The data has a declining trend.
 When looking into fire subcategories, the most incidents belonged to: Outside Fires (68.2%), and Structure Fires (15.5%).