Cities: Brownsville, TX (7.15%) ,
Bayview, TX (2.77%) ,
Los Fresnos, TX (1.84%) ,
Port Isabel, TX (0.97%) ,
Del Mar Heights, TX (0.27%) ,
Laureles, TX (0.23%) ,
Orason, TX (0.20%) ,
Indian Lake, TX (0.15%) ,
Chula Vista, TX (0.11%) County: Cameron County, TX Estimated zip code population in 2022: 24,883
Zip code population in 2010: 16,230
Zip code population in 2000: 12,274
Houses and condos: 8,442
Renter-occupied apartments: 1,868
% of renters here:
25%State:
38%
March 2022 cost of living index in zip code 78566: 79.2
(low, U.S. average is 100)
Land area: 115.0
sq. mi.
Water area: 51.5
sq. mi.
Population density: 216 people per square mile (very low).
OSM Map
General Map
Google Map
MSN Map
OSM Map
General Map
Google Map
MSN Map
OSM Map
General Map
Google Map
MSN Map
OSM Map
General Map
Google Map
MSN Map
Please wait while loading the map...
Real estate property taxes paid for housing units in 2022:
This zip code:
1.5% ($2,120)Texas:
1.5% ($4,050)
Median real estate property taxes paid for housing units with mortgages in 2022: $2,530 (1.5%)
Median real estate property taxes paid for housing units with no mortgage in 2022: $1,812 (1.4%)
Profiles of local businesses
Business Search - 14 Million verified businesses
Males: 13,031 Females: 11,851
For population 25 years and over in 78566:
High school or higher: 72.0%Bachelor's degree or higher: 20.4%Graduate or professional degree: 6.0%Unemployed: 5.7%Mean travel time to work (commute): 24.2 minutes
For population 15 years and over in 78566:
Never married: 35.0%Now married: 49.0%Separated: 1.9%Widowed: 5.9%Divorced: 8.3%
Zip code 78566 compared to state average:
Median house value below state average. Black race population percentage significantly below state average. Hispanic race population percentage above state average. Length of stay since moving in significantly above state average. House age below state average. Percentage of population with a bachelor's degree or higher below state average. 22,155 89.0% Hispanic or Latino 2,370 9.5% White 242 1.0% Black 57 0.2% American Indian 35 0.1% Asian 14 0.06% Two or more races 8 0.03% Some other race
Data:
Median household income ($)
Median household income (% change since 2000)
Household income diversity
Ratio of average income to average house value (%)
Ratio of average income to average rent
Median household income ($) - White
Median household income ($) - Black or African American
Median household income ($) - Asian
Median household income ($) - Hispanic or Latino
Median household income ($) - American Indian and Alaska Native
Median household income ($) - Multirace
Median household income ($) - Other Race
Median household income for houses/condos with a mortgage ($)
Median household income for apartments without a mortgage ($)
Races - White alone (%)
Races - White alone (% change since 2000)
Races - Black alone (%)
Races - Black alone (% change since 2000)
Races - American Indian alone (%)
Races - American Indian alone (% change since 2000)
Races - Asian alone (%)
Races - Asian alone (% change since 2000)
Races - Hispanic (%)
Races - Hispanic (% change since 2000)
Races - Native Hawaiian and Other Pacific Islander alone (%)
Races - Native Hawaiian and Other Pacific Islander alone (% change since 2000)
Races - Two or more races (%)
Races - Two or more races (% change since 2000)
Races - Other race alone (%)
Races - Other race alone (% change since 2000)
Racial diversity
Unemployment (%)
Unemployment (% change since 2000)
Unemployment (%) - White
Unemployment (%) - Black or African American
Unemployment (%) - Asian
Unemployment (%) - Hispanic or Latino
Unemployment (%) - American Indian and Alaska Native
Unemployment (%) - Multirace
Unemployment (%) - Other Race
Population density (people per square mile)
Population - Males (%)
Population - Females (%)
Population - Males (%) - White
Population - Males (%) - Black or African American
Population - Males (%) - Asian
Population - Males (%) - Hispanic or Latino
Population - Males (%) - American Indian and Alaska Native
Population - Males (%) - Multirace
Population - Males (%) - Other Race
Population - Females (%) - White
Population - Females (%) - Black or African American
Population - Females (%) - Asian
Population - Females (%) - Hispanic or Latino
Population - Females (%) - American Indian and Alaska Native
Population - Females (%) - Multirace
Population - Females (%) - Other Race
Coronavirus confirmed cases (May 15, 2024)
Deaths caused by coronavirus (May 15, 2024)
Coronavirus confirmed cases (per 100k population) (May 15, 2024)
Deaths caused by coronavirus (per 100k population) (May 15, 2024)
Daily increase in number of cases (May 15, 2024)
Weekly increase in number of cases (May 15, 2024)
Cases doubled (in days) (May 15, 2024)
Hospitalized patients (Apr 18, 2022)
Negative test results (Apr 18, 2022)
Total test results (Apr 18, 2022)
COVID Vaccine doses distributed (per 100k population) (Sep 19, 2023)
COVID Vaccine doses administered (per 100k population) (Sep 19, 2023)
COVID Vaccine doses distributed (Sep 19, 2023)
COVID Vaccine doses administered (Sep 19, 2023)
Likely homosexual households (%)
Likely homosexual households (% change since 2000)
Likely homosexual households - Lesbian couples (%)
Likely homosexual households - Lesbian couples (% change since 2000)
Likely homosexual households - Gay men (%)
Likely homosexual households - Gay men (% change since 2000)
Cost of living index
Median gross rent ($)
Median contract rent ($)
Median monthly housing costs ($)
Median house or condo value ($)
Median house or condo value ($ change since 2000)
Mean house or condo value by units in structure - 1, detached ($)
Mean house or condo value by units in structure - 1, attached ($)
Mean house or condo value by units in structure - 2 ($)
Mean house or condo value by units in structure by units in structure - 3 or 4 ($)
Mean house or condo value by units in structure - 5 or more ($)
Mean house or condo value by units in structure - Boat, RV, van, etc. ($)
Mean house or condo value by units in structure - Mobile home ($)
Median house or condo value ($) - White
Median house or condo value ($) - Black or African American
Median house or condo value ($) - Asian
Median house or condo value ($) - Hispanic or Latino
Median house or condo value ($) - American Indian and Alaska Native
Median house or condo value ($) - Multirace
Median house or condo value ($) - Other Race
Median resident age
Resident age diversity
Median resident age - Males
Median resident age - Females
Median resident age - White
Median resident age - Black or African American
Median resident age - Asian
Median resident age - Hispanic or Latino
Median resident age - American Indian and Alaska Native
Median resident age - Multirace
Median resident age - Other Race
Median resident age - Males - White
Median resident age - Males - Black or African American
Median resident age - Males - Asian
Median resident age - Males - Hispanic or Latino
Median resident age - Males - American Indian and Alaska Native
Median resident age - Males - Multirace
Median resident age - Males - Other Race
Median resident age - Females - White
Median resident age - Females - Black or African American
Median resident age - Females - Asian
Median resident age - Females - Hispanic or Latino
Median resident age - Females - American Indian and Alaska Native
Median resident age - Females - Multirace
Median resident age - Females - Other Race
Commute - mean travel time to work (minutes)
Travel time to work - Less than 5 minutes (%)
Travel time to work - Less than 5 minutes (% change since 2000)
Travel time to work - 5 to 9 minutes (%)
Travel time to work - 5 to 9 minutes (% change since 2000)
Travel time to work - 10 to 19 minutes (%)
Travel time to work - 10 to 19 minutes (% change since 2000)
Travel time to work - 20 to 29 minutes (%)
Travel time to work - 20 to 29 minutes (% change since 2000)
Travel time to work - 30 to 39 minutes (%)
Travel time to work - 30 to 39 minutes (% change since 2000)
Travel time to work - 40 to 59 minutes (%)
Travel time to work - 40 to 59 minutes (% change since 2000)
Travel time to work - 60 to 89 minutes (%)
Travel time to work - 60 to 89 minutes (% change since 2000)
Travel time to work - 90 or more minutes (%)
Travel time to work - 90 or more minutes (% change since 2000)
Marital status - Never married (%)
Marital status - Now married (%)
Marital status - Separated (%)
Marital status - Widowed (%)
Marital status - Divorced (%)
Median family income ($)
Median family income (% change since 2000)
Median non-family income ($)
Median non-family income (% change since 2000)
Median per capita income ($)
Median per capita income (% change since 2000)
Median family income ($) - White
Median family income ($) - Black or African American
Median family income ($) - Asian
Median family income ($) - Hispanic or Latino
Median family income ($) - American Indian and Alaska Native
Median family income ($) - Multirace
Median family income ($) - Other Race
Median year house/condo built
Median year apartment built
Year house built - Built 2005 or later (%)
Year house built - Built 2000 to 2004 (%)
Year house built - Built 1990 to 1999 (%)
Year house built - Built 1980 to 1989 (%)
Year house built - Built 1970 to 1979 (%)
Year house built - Built 1960 to 1969 (%)
Year house built - Built 1950 to 1959 (%)
Year house built - Built 1940 to 1949 (%)
Year house built - Built 1939 or earlier (%)
Average household size
Household density (households per square mile)
Average household size - White
Average household size - Black or African American
Average household size - Asian
Average household size - Hispanic or Latino
Average household size - American Indian and Alaska Native
Average household size - Multirace
Average household size - Other Race
Occupied housing units (%)
Vacant housing units (%)
Owner occupied housing units (%)
Renter occupied housing units (%)
Vacancy status - For rent (%)
Vacancy status - For sale only (%)
Vacancy status - Rented or sold, not occupied (%)
Vacancy status - For seasonal, recreational, or occasional use (%)
Vacancy status - For migrant workers (%)
Vacancy status - Other vacant (%)
Residents with income below the poverty level (%)
Residents with income below 50% of the poverty level (%)
Children below poverty level (%)
Poor families by family type - Married-couple family (%)
Poor families by family type - Male, no wife present (%)
Poor families by family type - Female, no husband present (%)
Poverty status for native-born residents (%)
Poverty status for foreign-born residents (%)
Poverty among high school graduates not in families (%)
Poverty among people who did not graduate high school not in families (%)
Residents with income below the poverty level (%) - White
Residents with income below the poverty level (%) - Black or African American
Residents with income below the poverty level (%) - Asian
Residents with income below the poverty level (%) - Hispanic or Latino
Residents with income below the poverty level (%) - American Indian and Alaska Native
Residents with income below the poverty level (%) - Multirace
Residents with income below the poverty level (%) - Other Race
Air pollution - Air Quality Index (AQI)
Air pollution - CO
Air pollution - NO2
Air pollution - SO2
Air pollution - Ozone
Air pollution - PM10
Air pollution - PM25
Air pollution - Pb
Crime - Murders per 100,000 population
Crime - Rapes per 100,000 population
Crime - Robberies per 100,000 population
Crime - Assaults per 100,000 population
Crime - Burglaries per 100,000 population
Crime - Thefts per 100,000 population
Crime - Auto thefts per 100,000 population
Crime - Arson per 100,000 population
Crime - City-data.com crime index
Crime - Violent crime index
Crime - Property crime index
Crime - Murders per 100,000 population (5 year average)
Crime - Rapes per 100,000 population (5 year average)
Crime - Robberies per 100,000 population (5 year average)
Crime - Assaults per 100,000 population (5 year average)
Crime - Burglaries per 100,000 population (5 year average)
Crime - Thefts per 100,000 population (5 year average)
Crime - Auto thefts per 100,000 population (5 year average)
Crime - Arson per 100,000 population (5 year average)
Crime - City-data.com crime index (5 year average)
Crime - Violent crime index (5 year average)
Crime - Property crime index (5 year average)
1996 Presidential Elections Results (%) - Democratic Party (Clinton)
1996 Presidential Elections Results (%) - Republican Party (Dole)
1996 Presidential Elections Results (%) - Other
2000 Presidential Elections Results (%) - Democratic Party (Gore)
2000 Presidential Elections Results (%) - Republican Party (Bush)
2000 Presidential Elections Results (%) - Other
2004 Presidential Elections Results (%) - Democratic Party (Kerry)
2004 Presidential Elections Results (%) - Republican Party (Bush)
2004 Presidential Elections Results (%) - Other
2008 Presidential Elections Results (%) - Democratic Party (Obama)
2008 Presidential Elections Results (%) - Republican Party (McCain)
2008 Presidential Elections Results (%) - Other
2012 Presidential Elections Results (%) - Democratic Party (Obama)
2012 Presidential Elections Results (%) - Republican Party (Romney)
2012 Presidential Elections Results (%) - Other
2016 Presidential Elections Results (%) - Democratic Party (Clinton)
2016 Presidential Elections Results (%) - Republican Party (Trump)
2016 Presidential Elections Results (%) - Other
2020 Presidential Elections Results (%) - Democratic Party (Biden)
2020 Presidential Elections Results (%) - Republican Party (Trump)
2020 Presidential Elections Results (%) - Other
Ancestries Reported - Arab (%)
Ancestries Reported - Czech (%)
Ancestries Reported - Danish (%)
Ancestries Reported - Dutch (%)
Ancestries Reported - English (%)
Ancestries Reported - French (%)
Ancestries Reported - French Canadian (%)
Ancestries Reported - German (%)
Ancestries Reported - Greek (%)
Ancestries Reported - Hungarian (%)
Ancestries Reported - Irish (%)
Ancestries Reported - Italian (%)
Ancestries Reported - Lithuanian (%)
Ancestries Reported - Norwegian (%)
Ancestries Reported - Polish (%)
Ancestries Reported - Portuguese (%)
Ancestries Reported - Russian (%)
Ancestries Reported - Scotch-Irish (%)
Ancestries Reported - Scottish (%)
Ancestries Reported - Slovak (%)
Ancestries Reported - Subsaharan African (%)
Ancestries Reported - Swedish (%)
Ancestries Reported - Swiss (%)
Ancestries Reported - Ukrainian (%)
Ancestries Reported - United States (%)
Ancestries Reported - Welsh (%)
Ancestries Reported - West Indian (%)
Ancestries Reported - Other (%)
Educational Attainment - No schooling completed (%)
Educational Attainment - Less than high school (%)
Educational Attainment - High school or equivalent (%)
Educational Attainment - Less than 1 year of college (%)
Educational Attainment - 1 or more years of college (%)
Educational Attainment - Associate degree (%)
Educational Attainment - Bachelor's degree (%)
Educational Attainment - Master's degree (%)
Educational Attainment - Professional school degree (%)
Educational Attainment - Doctorate degree (%)
School Enrollment - Nursery, preschool (%)
School Enrollment - Kindergarten (%)
School Enrollment - Grade 1 to 4 (%)
School Enrollment - Grade 5 to 8 (%)
School Enrollment - Grade 9 to 12 (%)
School Enrollment - College undergrad (%)
School Enrollment - Graduate or professional (%)
School Enrollment - Not enrolled in school (%)
School enrollment - Public schools (%)
School enrollment - Private schools (%)
School enrollment - Not enrolled (%)
Median number of rooms in houses and condos
Median number of rooms in apartments
Housing units lacking complete plumbing facilities (%)
Housing units lacking complete kitchen facilities (%)
Density of houses
Urban houses (%)
Rural houses (%)
Households with people 60 years and over (%)
Households with people 65 years and over (%)
Households with people 75 years and over (%)
Households with one or more nonrelatives (%)
Households with no nonrelatives (%)
Population in households (%)
Family households (%)
Nonfamily households (%)
Population in families (%)
Family households with own children (%)
Median number of bedrooms in owner occupied houses
Mean number of bedrooms in owner occupied houses
Median number of bedrooms in renter occupied houses
Mean number of bedrooms in renter occupied houses
Median number of vehichles in owner occupied houses
Mean number of vehichles in owner occupied houses
Median number of vehichles in renter occupied houses
Mean number of vehichles in renter occupied houses
Mortgage status - with mortgage (%)
Mortgage status - with second mortgage (%)
Mortgage status - with home equity loan (%)
Mortgage status - with both second mortgage and home equity loan (%)
Mortgage status - without a mortgage (%)
Average family size
Average family size - White
Average family size - Black or African American
Average family size - Asian
Average family size - Hispanic or Latino
Average family size - American Indian and Alaska Native
Average family size - Multirace
Average family size - Other Race
Geographical mobility - Same house 1 year ago (%)
Geographical mobility - Moved within same county (%)
Geographical mobility - Moved from different county within same state (%)
Geographical mobility - Moved from different state (%)
Geographical mobility - Moved from abroad (%)
Place of birth - Born in state of residence (%)
Place of birth - Born in other state (%)
Place of birth - Native, outside of US (%)
Place of birth - Foreign born (%)
Housing units in structures - 1, detached (%)
Housing units in structures - 1, attached (%)
Housing units in structures - 2 (%)
Housing units in structures - 3 or 4 (%)
Housing units in structures - 5 to 9 (%)
Housing units in structures - 10 to 19 (%)
Housing units in structures - 20 to 49 (%)
Housing units in structures - 50 or more (%)
Housing units in structures - Mobile home (%)
Housing units in structures - Boat, RV, van, etc. (%)
House/condo owner moved in on average (years ago)
Renter moved in on average (years ago)
Year householder moved into unit - Moved in 1999 to March 2000 (%)
Year householder moved into unit - Moved in 1995 to 1998 (%)
Year householder moved into unit - Moved in 1990 to 1994 (%)
Year householder moved into unit - Moved in 1980 to 1989 (%)
Year householder moved into unit - Moved in 1970 to 1979 (%)
Year householder moved into unit - Moved in 1969 or earlier (%)
Means of transportation to work - Drove car alone (%)
Means of transportation to work - Carpooled (%)
Means of transportation to work - Public transportation (%)
Means of transportation to work - Bus or trolley bus (%)
Means of transportation to work - Streetcar or trolley car (%)
Means of transportation to work - Subway or elevated (%)
Means of transportation to work - Railroad (%)
Means of transportation to work - Ferryboat (%)
Means of transportation to work - Taxicab (%)
Means of transportation to work - Motorcycle (%)
Means of transportation to work - Bicycle (%)
Means of transportation to work - Walked (%)
Means of transportation to work - Other means (%)
Working at home (%)
Industry diversity
Most Common Industries - Agriculture, forestry, fishing and hunting, and mining (%)
Most Common Industries - Agriculture, forestry, fishing and hunting (%)
Most Common Industries - Mining, quarrying, and oil and gas extraction (%)
Most Common Industries - Construction (%)
Most Common Industries - Manufacturing (%)
Most Common Industries - Wholesale trade (%)
Most Common Industries - Retail trade (%)
Most Common Industries - Transportation and warehousing, and utilities (%)
Most Common Industries - Transportation and warehousing (%)
Most Common Industries - Utilities (%)
Most Common Industries - Information (%)
Most Common Industries - Finance and insurance, and real estate and rental and leasing (%)
Most Common Industries - Finance and insurance (%)
Most Common Industries - Real estate and rental and leasing (%)
Most Common Industries - Professional, scientific, and management, and administrative and waste management services (%)
Most Common Industries - Professional, scientific, and technical services (%)
Most Common Industries - Management of companies and enterprises (%)
Most Common Industries - Administrative and support and waste management services (%)
Most Common Industries - Educational services, and health care and social assistance (%)
Most Common Industries - Educational services (%)
Most Common Industries - Health care and social assistance (%)
Most Common Industries - Arts, entertainment, and recreation, and accommodation and food services (%)
Most Common Industries - Arts, entertainment, and recreation (%)
Most Common Industries - Accommodation and food services (%)
Most Common Industries - Other services, except public administration (%)
Most Common Industries - Public administration (%)
Occupation diversity
Most Common Occupations - Management, business, science, and arts occupations (%)
Most Common Occupations - Management, business, and financial occupations (%)
Most Common Occupations - Management occupations (%)
Most Common Occupations - Business and financial operations occupations (%)
Most Common Occupations - Computer, engineering, and science occupations (%)
Most Common Occupations - Computer and mathematical occupations (%)
Most Common Occupations - Architecture and engineering occupations (%)
Most Common Occupations - Life, physical, and social science occupations (%)
Most Common Occupations - Education, legal, community service, arts, and media occupations (%)
Most Common Occupations - Community and social service occupations (%)
Most Common Occupations - Legal occupations (%)
Most Common Occupations - Education, training, and library occupations (%)
Most Common Occupations - Arts, design, entertainment, sports, and media occupations (%)
Most Common Occupations - Healthcare practitioners and technical occupations (%)
Most Common Occupations - Health diagnosing and treating practitioners and other technical occupations (%)
Most Common Occupations - Health technologists and technicians (%)
Most Common Occupations - Service occupations (%)
Most Common Occupations - Healthcare support occupations (%)
Most Common Occupations - Protective service occupations (%)
Most Common Occupations - Fire fighting and prevention, and other protective service workers including supervisors (%)
Most Common Occupations - Law enforcement workers including supervisors (%)
Most Common Occupations - Food preparation and serving related occupations (%)
Most Common Occupations - Building and grounds cleaning and maintenance occupations (%)
Most Common Occupations - Personal care and service occupations (%)
Most Common Occupations - Sales and office occupations (%)
Most Common Occupations - Sales and related occupations (%)
Most Common Occupations - Office and administrative support occupations (%)
Most Common Occupations - Natural resources, construction, and maintenance occupations (%)
Most Common Occupations - Farming, fishing, and forestry occupations (%)
Most Common Occupations - Construction and extraction occupations (%)
Most Common Occupations - Installation, maintenance, and repair occupations (%)
Most Common Occupations - Production, transportation, and material moving occupations (%)
Most Common Occupations - Production occupations (%)
Most Common Occupations - Transportation occupations (%)
Most Common Occupations - Material moving occupations (%)
People in Group quarters - Institutionalized population (%)
People in Group quarters - Correctional institutions (%)
People in Group quarters - Federal prisons and detention centers (%)
People in Group quarters - Halfway houses (%)
People in Group quarters - Local jails and other confinement facilities (including police lockups) (%)
People in Group quarters - Military disciplinary barracks (%)
People in Group quarters - State prisons (%)
People in Group quarters - Other types of correctional institutions (%)
People in Group quarters - Nursing homes (%)
People in Group quarters - Hospitals/wards, hospices, and schools for the handicapped (%)
People in Group quarters - Hospitals/wards and hospices for chronically ill (%)
People in Group quarters - Hospices or homes for chronically ill (%)
People in Group quarters - Military hospitals or wards for chronically ill (%)
People in Group quarters - Other hospitals or wards for chronically ill (%)
People in Group quarters - Hospitals or wards for drug/alcohol abuse (%)
People in Group quarters - Mental (Psychiatric) hospitals or wards (%)
People in Group quarters - Schools, hospitals, or wards for the mentally retarded (%)
People in Group quarters - Schools, hospitals, or wards for the physically handicapped (%)
People in Group quarters - Institutions for the deaf (%)
People in Group quarters - Institutions for the blind (%)
People in Group quarters - Orthopedic wards and institutions for the physically handicapped (%)
People in Group quarters - Wards in general hospitals for patients who have no usual home elsewhere (%)
People in Group quarters - Wards in military hospitals for patients who have no usual home elsewhere (%)
People in Group quarters - Juvenile institutions (%)
People in Group quarters - Long-term care (%)
People in Group quarters - Homes for abused, dependent, and neglected children (%)
People in Group quarters - Residential treatment centers for emotionally disturbed children (%)
People in Group quarters - Training schools for juvenile delinquents (%)
People in Group quarters - Short-term care, detention or diagnostic centers for delinquent children (%)
People in Group quarters - Type of juvenile institution unknown (%)
People in Group quarters - Noninstitutionalized population (%)
People in Group quarters - College dormitories (includes college quarters off campus) (%)
People in Group quarters - Military quarters (%)
People in Group quarters - On base (%)
People in Group quarters - Barracks, unaccompanied personnel housing (UPH), (Enlisted/Officer), ;and similar group living quarters for military personnel (%)
People in Group quarters - Transient quarters for temporary residents (%)
People in Group quarters - Military ships (%)
People in Group quarters - Group homes (%)
People in Group quarters - Homes or halfway houses for drug/alcohol abuse (%)
People in Group quarters - Homes for the mentally ill (%)
People in Group quarters - Homes for the mentally retarded (%)
People in Group quarters - Homes for the physically handicapped (%)
People in Group quarters - Other group homes (%)
People in Group quarters - Religious group quarters (%)
People in Group quarters - Dormitories (%)
People in Group quarters - Agriculture workers' dormitories on farms (%)
People in Group quarters - Job Corps and vocational training facilities (%)
People in Group quarters - Other workers' dormitories (%)
People in Group quarters - Crews of maritime vessels (%)
People in Group quarters - Other nonhousehold living situations (%)
People in Group quarters - Other noninstitutional group quarters (%)
Residents speaking English at home (%)
Residents speaking English at home - Born in the United States (%)
Residents speaking English at home - Native, born elsewhere (%)
Residents speaking English at home - Foreign born (%)
Residents speaking Spanish at home (%)
Residents speaking Spanish at home - Born in the United States (%)
Residents speaking Spanish at home - Native, born elsewhere (%)
Residents speaking Spanish at home - Foreign born (%)
Residents speaking other language at home (%)
Residents speaking other language at home - Born in the United States (%)
Residents speaking other language at home - Native, born elsewhere (%)
Residents speaking other language at home - Foreign born (%)
Class of Workers - Employee of private company (%)
Class of Workers - Self-employed in own incorporated business (%)
Class of Workers - Private not-for-profit wage and salary workers (%)
Class of Workers - Local government workers (%)
Class of Workers - State government workers (%)
Class of Workers - Federal government workers (%)
Class of Workers - Self-employed workers in own not incorporated business and Unpaid family workers (%)
House heating fuel used in houses and condos - Utility gas (%)
House heating fuel used in houses and condos - Bottled, tank, or LP gas (%)
House heating fuel used in houses and condos - Electricity (%)
House heating fuel used in houses and condos - Fuel oil, kerosene, etc. (%)
House heating fuel used in houses and condos - Coal or coke (%)
House heating fuel used in houses and condos - Wood (%)
House heating fuel used in houses and condos - Solar energy (%)
House heating fuel used in houses and condos - Other fuel (%)
House heating fuel used in houses and condos - No fuel used (%)
House heating fuel used in apartments - Utility gas (%)
House heating fuel used in apartments - Bottled, tank, or LP gas (%)
House heating fuel used in apartments - Electricity (%)
House heating fuel used in apartments - Fuel oil, kerosene, etc. (%)
House heating fuel used in apartments - Coal or coke (%)
House heating fuel used in apartments - Wood (%)
House heating fuel used in apartments - Solar energy (%)
House heating fuel used in apartments - Other fuel (%)
House heating fuel used in apartments - No fuel used (%)
Armed forces status - In Armed Forces (%)
Armed forces status - Civilian (%)
Armed forces status - Civilian - Veteran (%)
Armed forces status - Civilian - Nonveteran (%)
Fatal accidents locations in years 2005-2021
Fatal accidents locations in 2005
Fatal accidents locations in 2006
Fatal accidents locations in 2007
Fatal accidents locations in 2008
Fatal accidents locations in 2009
Fatal accidents locations in 2010
Fatal accidents locations in 2011
Fatal accidents locations in 2012
Fatal accidents locations in 2013
Fatal accidents locations in 2014
Fatal accidents locations in 2015
Fatal accidents locations in 2016
Fatal accidents locations in 2017
Fatal accidents locations in 2018
Fatal accidents locations in 2019
Fatal accidents locations in 2020
Fatal accidents locations in 2021
Alcohol use - People drinking some alcohol every month (%)
Alcohol use - People not drinking at all (%)
Alcohol use - Average days/month drinking alcohol
Alcohol use - Average drinks/week
Alcohol use - Average days/year people drink much
Audiometry - Average condition of hearing (%)
Audiometry - People that can hear a whisper from across a quiet room (%)
Audiometry - People that can hear normal voice from across a quiet room (%)
Audiometry - Ears ringing, roaring, buzzing (%)
Audiometry - Had a job exposure to loud noise (%)
Audiometry - Had off-work exposure to loud noise (%)
Blood Pressure & Cholesterol - Has high blood pressure (%)
Blood Pressure & Cholesterol - Checking blood pressure at home (%)
Blood Pressure & Cholesterol - Frequently checking blood cholesterol (%)
Blood Pressure & Cholesterol - Has high cholesterol level (%)
Consumer Behavior - Money monthly spent on food at supermarket/grocery store
Consumer Behavior - Money monthly spent on food at other stores
Consumer Behavior - Money monthly spent on eating out
Consumer Behavior - Money monthly spent on carryout/delivered foods
Consumer Behavior - Income spent on food at supermarket/grocery store (%)
Consumer Behavior - Income spent on food at other stores (%)
Consumer Behavior - Income spent on eating out (%)
Consumer Behavior - Income spent on carryout/delivered foods (%)
Current Health Status - General health condition (%)
Current Health Status - Blood donors (%)
Current Health Status - Has blood ever tested for HIV virus (%)
Current Health Status - Left-handed people (%)
Dermatology - People using sunscreen (%)
Diabetes - Diabetics (%)
Diabetes - Had a blood test for high blood sugar (%)
Diabetes - People taking insulin (%)
Diet Behavior & Nutrition - Diet health (%)
Diet Behavior & Nutrition - Milk product consumption (# of products/month)
Diet Behavior & Nutrition - Meals not home prepared (#/week)
Diet Behavior & Nutrition - Meals from fast food or pizza place (#/week)
Diet Behavior & Nutrition - Ready-to-eat foods (#/month)
Diet Behavior & Nutrition - Frozen meals/pizza (#/month)
Drug Use - People that ever used marijuana or hashish (%)
Drug Use - Ever used hard drugs (%)
Drug Use - Ever used any form of cocaine (%)
Drug Use - Ever used heroin (%)
Drug Use - Ever used methamphetamine (%)
Health Insurance - People covered by health insurance (%)
Kidney Conditions-Urology - Avg. # of times urinating at night
Medical Conditions - People with asthma (%)
Medical Conditions - People with anemia (%)
Medical Conditions - People with psoriasis (%)
Medical Conditions - People with overweight (%)
Medical Conditions - Elderly people having difficulties in thinking or remembering (%)
Medical Conditions - People who ever received blood transfusion (%)
Medical Conditions - People having trouble seeing even with glass/contacts (%)
Medical Conditions - People with arthritis (%)
Medical Conditions - People with gout (%)
Medical Conditions - People with congestive heart failure (%)
Medical Conditions - People with coronary heart disease (%)
Medical Conditions - People with angina pectoris (%)
Medical Conditions - People who ever had heart attack (%)
Medical Conditions - People who ever had stroke (%)
Medical Conditions - People with emphysema (%)
Medical Conditions - People with thyroid problem (%)
Medical Conditions - People with chronic bronchitis (%)
Medical Conditions - People with any liver condition (%)
Medical Conditions - People who ever had cancer or malignancy (%)
Mental Health - People who have little interest in doing things (%)
Mental Health - People feeling down, depressed, or hopeless (%)
Mental Health - People who have trouble sleeping or sleeping too much (%)
Mental Health - People feeling tired or having little energy (%)
Mental Health - People with poor appetite or overeating (%)
Mental Health - People feeling bad about themself (%)
Mental Health - People who have trouble concentrating on things (%)
Mental Health - People moving or speaking slowly or too fast (%)
Mental Health - People having thoughts they would be better off dead (%)
Oral Health - Average years since last visit a dentist
Oral Health - People embarrassed because of mouth (%)
Oral Health - People with gum disease (%)
Oral Health - General health of teeth and gums (%)
Oral Health - Average days a week using dental floss/device
Oral Health - Average days a week using mouthwash for dental problem
Oral Health - Average number of teeth
Pesticide Use - Households using pesticides to control insects (%)
Pesticide Use - Households using pesticides to kill weeds (%)
Physical Activity - People doing vigorous-intensity work activities (%)
Physical Activity - People doing moderate-intensity work activities (%)
Physical Activity - People walking or bicycling (%)
Physical Activity - People doing vigorous-intensity recreational activities (%)
Physical Activity - People doing moderate-intensity recreational activities (%)
Physical Activity - Average hours a day doing sedentary activities
Physical Activity - Average hours a day watching TV or videos
Physical Activity - Average hours a day using computer
Physical Functioning - People having limitations keeping them from working (%)
Physical Functioning - People limited in amount of work they can do (%)
Physical Functioning - People that need special equipment to walk (%)
Physical Functioning - People experiencing confusion/memory problems (%)
Physical Functioning - People requiring special healthcare equipment (%)
Prescription Medications - Average number of prescription medicines taking
Preventive Aspirin Use - Adults 40+ taking low-dose aspirin (%)
Reproductive Health - Vaginal deliveries (%)
Reproductive Health - Cesarean deliveries (%)
Reproductive Health - Deliveries resulted in a live birth (%)
Reproductive Health - Pregnancies resulted in a delivery (%)
Reproductive Health - Women breastfeeding newborns (%)
Reproductive Health - Women that had a hysterectomy (%)
Reproductive Health - Women that had both ovaries removed (%)
Reproductive Health - Women that have ever taken birth control pills (%)
Reproductive Health - Women taking birth control pills (%)
Reproductive Health - Women that have ever used Depo-Provera or injectables (%)
Reproductive Health - Women that have ever used female hormones (%)
Sexual Behavior - People 18+ that ever had sex (vaginal, anal, or oral) (%)
Sexual Behavior - Males 18+ that ever had vaginal sex with a woman (%)
Sexual Behavior - Males 18+ that ever performed oral sex on a woman (%)
Sexual Behavior - Males 18+ that ever had anal sex with a woman (%)
Sexual Behavior - Males 18+ that ever had any sex with a man (%)
Sexual Behavior - Females 18+ that ever had vaginal sex with a man (%)
Sexual Behavior - Females 18+ that ever performed oral sex on a man (%)
Sexual Behavior - Females 18+ that ever had anal sex with a man (%)
Sexual Behavior - Females 18+ that ever had any kind of sex with a woman (%)
Sexual Behavior - Average age people first had sex
Sexual Behavior - Average number of female sex partners in lifetime (males 18+)
Sexual Behavior - Average number of female vaginal sex partners in lifetime (males 18+)
Sexual Behavior - Average age people first performed oral sex on a woman (18+)
Sexual Behavior - Average number of woman performed oral sex on in lifetime (18+)
Sexual Behavior - Average number of male sex partners in lifetime (males 18+)
Sexual Behavior - Average number of male anal sex partners in lifetime (males 18+)
Sexual Behavior - Average age people first performed oral sex on a man (18+)
Sexual Behavior - Average number of male oral sex partners in lifetime (18+)
Sexual Behavior - People using protection when performing oral sex (%)
Sexual Behavior - Average number of times people have vaginal or anal sex a year
Sexual Behavior - People having sex without condom (%)
Sexual Behavior - Average number of male sex partners in lifetime (females 18+)
Sexual Behavior - Average number of male vaginal sex partners in lifetime (females 18+)
Sexual Behavior - Average number of female sex partners in lifetime (females 18+)
Sexual Behavior - Circumcised males 18+ (%)
Sleep Disorders - Average hours sleeping at night
Sleep Disorders - People that has trouble sleeping (%)
Smoking-Cigarette Use - People smoking cigarettes (%)
Taste & Smell - People 40+ having problems with smell (%)
Taste & Smell - People 40+ having problems with taste (%)
Taste & Smell - People 40+ that ever had wisdom teeth removed (%)
Taste & Smell - People 40+ that ever had tonsils teeth removed (%)
Taste & Smell - People 40+ that ever had a loss of consciousness because of a head injury (%)
Taste & Smell - People 40+ that ever had a broken nose or other serious injury to face or skull (%)
Taste & Smell - People 40+ that ever had two or more sinus infections (%)
Weight - Average height (inches)
Weight - Average weight (pounds)
Weight - Average BMI
Weight - People that are obese (%)
Weight - People that ever were obese (%)
Weight - People trying to lose weight (%)
Urban population: 16,579
Rural population: 8,303
Estimated median house/condo value in 2022: $143,486
78566:
$143,486Texas:
$275,400
According to our research of Texas and other state lists, there were 47 registered sex offenders living in 78566 zip code as of May 15, 2024 . The ratio of all residents to sex offenders in zip code 78566 is 406 to 1.The ratio of registered sex offenders to all residents in this zip code is near the state average.
Median resident age: This zip code:
32.8 yearsTexas median age:
35.6 years
Average household size: This zip code:
3.3 peopleTexas:
2.6 people
Averages for the 2020 tax year for zip code 78566, filed in 2021:
Average Adjusted Gross Income (AGI) in 2020: $41,774 (Individual Income Tax Returns) Here:
$41,774State:
$77,054
Salary/wage: $38,352 (reported on 86.7% of returns )Here:
$38,352State:
$62,766
(% of AGI for various income ranges: 1169.3% for AGIs below $25k , 3435.3% for AGIs $25k-50k , 6311.1% for AGIs $50k-75k , 9165.8% for AGIs $75k-100k , 16688.7% for AGIs $100k-200k , 52165.0% for AGIs over 200k ) Taxable interest for individuals: $1,336 (reported on 8.7% of returns )This zip code:
$1,336Texas:
$2,665
(% of AGI for various income ranges: 2.7% for AGIs below $25k , 6.6% for AGIs $25k-50k , 20.1% for AGIs $50k-75k , 33.1% for AGIs $75k-100k , 43.6% for AGIs $100k-200k , 825.0% for AGIs over 200k ) Ordinary dividends: $4,836 (reported on 3.4% of returns )(% of AGI for various income ranges: 1.3% for AGIs below $25k , 2.6% for AGIs $25k-50k , 23.1% for AGIs $50k-75k , 23.8% for AGIs $75k-100k , 76.7% for AGIs $100k-200k , 2042.5% for AGIs over 200k ) Net capital gain/loss in AGI: +$9,920 (reported on 4.2% of returns )Here:
+$9,920State:
+$39,590
(% of AGI for various income ranges: 3.1% for AGIs below $25k , 9.8% for AGIs $25k-50k , 32.6% for AGIs $50k-75k , 85.3% for AGIs $75k-100k , 279.1% for AGIs $100k-200k , 4432.5% for AGIs over 200k ) Profit/loss from business: +$6,787 (reported on 19.8% of returns )Here:
+$6,787State:
+$10,888
(% of AGI for various income ranges: 163.5% for AGIs below $25k , 76.8% for AGIs $25k-50k , 100.2% for AGIs $50k-75k , 152.0% for AGIs $75k-100k , 494.4% for AGIs $100k-200k , 3037.5% for AGIs over 200k ) Taxable individual retirement arrangement distribution: $13,208 (reported on 2.7% of returns )78566:
$13,208Texas:
$24,740
(% of AGI for various income ranges: 10.2% for AGIs below $25k , 17.8% for AGIs $25k-50k , 64.2% for AGIs $50k-75k , 149.8% for AGIs $75k-100k , 300.9% for AGIs $100k-200k ) Total itemized deductions: $31,935 (reported on 2.1% of returns )Here:
$31,935State:
$40,428
(% of AGI for various income ranges: 31.8% for AGIs $25k-50k , 149.7% for AGIs $50k-75k , 230.4% for AGIs $75k-100k , 359.6% for AGIs $100k-200k , 3907.5% for AGIs over 200k ) Charity contributions: $10,286 (reported on 1.4% of returns )Here:
$10,286State:
$18,201
(% of AGI for various income ranges: 4.1% for AGIs $25k-50k , 39.7% for AGIs $50k-75k , 120.0% for AGIs $100k-200k , 1065.0% for AGIs over 200k ) Taxes paid: $6,072 (reported on 1.9% of returns )(% of AGI for various income ranges: 4.7% for AGIs $25k-50k , 23.6% for AGIs $50k-75k , 30.4% for AGIs $75k-100k , 85.6% for AGIs $100k-200k , 592.5% for AGIs over 200k ) Earned income credit: $2,947 (reported on 35.2% of returns )(% of AGI for various income ranges: 181.6% for AGIs below $25k , 137.4% for AGIs $25k-50k , 3.8% for AGIs $50k-75k ) Percentage of individuals using paid preparers for their 2020 taxes: 93.4%(% for various income ranges: 92.3% for AGIs below $25k , 94.8% for AGIs $25k-50k , 94.1% for AGIs $50k-75k , 94.9% for AGIs $75k-100k , 92.9% for AGIs $100k-200k , 90.0% for AGIs over 200k )
Averages for the 2012 tax year for zip code 78566, filed in 2013:
Average Adjusted Gross Income (AGI) in 2012: $36,316 (Individual Income Tax Returns) Here:
$36,316State:
$65,384
Salary/wage: $33,230 (reported on 88.3% of returns )Here:
$33,230State:
$52,524
(% of AGI for various income ranges: 79.5% for AGIs below $25k , 88.9% for AGIs $25k-50k , 85.0% for AGIs $50k-75k , 87.6% for AGIs $75k-100k , 81.2% for AGIs $100k-200k , 36.0% for AGIs over 200k ) Taxable interest for individuals: $2,417 (reported on 11.0% of returns )This zip code:
$2,417Texas:
$2,372
(% of AGI for various income ranges: 0.3% for AGIs below $25k , 0.3% for AGIs $25k-50k , 0.7% for AGIs $50k-75k , 0.7% for AGIs $75k-100k , 0.7% for AGIs $100k-200k , 3.6% for AGIs over 200k ) Ordinary dividends: $3,362 (reported on 4.6% of returns )(% of AGI for various income ranges: 0.2% for AGIs below $25k , 0.2% for AGIs $25k-50k , 0.4% for AGIs $50k-75k , 0.6% for AGIs $75k-100k , 0.9% for AGIs $100k-200k ) Net capital gain/loss in AGI: +$7,604 (reported on 4.0% of returns )Here:
+$7,604State:
+$35,319
(% of AGI for various income ranges: 0.2% for AGIs $25k-50k , 0.5% for AGIs $50k-75k , 0.1% for AGIs $75k-100k , 3.3% for AGIs $100k-200k ) Profit/loss from business: +$8,653 (reported on 20.5% of returns )Here:
+$8,653State:
+$13,732
(% of AGI for various income ranges: 13.8% for AGIs below $25k , 3.5% for AGIs $25k-50k , 2.3% for AGIs $50k-75k , 0.7% for AGIs $75k-100k , 4.1% for AGIs $100k-200k ) Taxable individual retirement arrangement distribution: $14,183 (reported on 3.2% of returns )78566:
$14,183Texas:
$19,511
(% of AGI for various income ranges: 0.5% for AGIs below $25k , 0.7% for AGIs $25k-50k , 1.5% for AGIs $50k-75k , 1.2% for AGIs $75k-100k , 2.7% for AGIs $100k-200k ) Total itemized deductions: $20,137 (23% of AGI, reported on 14.2% of returns )Here:
$20,137State:
$24,724
Here:
23.3% of AGIState:
15.9% of AGI
(% of AGI for various income ranges: 2.3% for AGIs below $25k , 6.9% for AGIs $25k-50k , 10.4% for AGIs $50k-75k , 12.4% for AGIs $75k-100k , 10.0% for AGIs $100k-200k , 6.4% for AGIs over 200k ) Charity contributions: $3,695 (reported on 10.2% of returns )(% of AGI for various income ranges: 0.2% for AGIs below $25k , 0.7% for AGIs $25k-50k , 1.3% for AGIs $50k-75k , 1.3% for AGIs $75k-100k , 1.6% for AGIs $100k-200k , 1.5% for AGIs over 200k ) Taxes paid: $4,729 (reported on 13.3% of returns )(% of AGI for various income ranges: 0.5% for AGIs below $25k , 1.0% for AGIs $25k-50k , 1.8% for AGIs $50k-75k , 2.5% for AGIs $75k-100k , 2.9% for AGIs $100k-200k , 2.2% for AGIs over 200k ) Earned income credit: $2,977 (reported on 43.3% of returns )(% of AGI for various income ranges: 14.5% for AGIs below $25k , 2.8% for AGIs $25k-50k ) Percentage of individuals using paid preparers for their 2012 taxes: 58.8%(% for various income ranges: 59.4% for AGIs below $25k , 56.8% for AGIs $25k-50k , 57.1% for AGIs $50k-75k , 61.3% for AGIs $75k-100k , 60.6% for AGIs $100k-200k , 75.0% for AGIs over 200k )
Averages for the 2004 tax year for zip code 78566, filed in 2005:
Average Adjusted Gross Income (AGI) in 2004: $28,522 (Individual Income Tax Returns) Here:
$28,522State:
$47,881
Salary/wage: $25,321 (reported on 89.0% of returns )Here:
$25,321State:
$41,947
(% of AGI for various income ranges: 95.2% for AGIs below $10k , 84.6% for AGIs $10k-25k , 89.1% for AGIs $25k-50k , 84.0% for AGIs $50k-75k , 82.4% for AGIs $75k-100k , 50.5% for AGIs over 100k ) Taxable interest for individuals: $2,335 (reported on 14.8% of returns )This zip code:
$2,335Texas:
$2,255
(% of AGI for various income ranges: 2.4% for AGIs below $10k , 0.6% for AGIs $10k-25k , 0.8% for AGIs $25k-50k , 1.3% for AGIs $50k-75k , 1.2% for AGIs $75k-100k , 2.1% for AGIs over 100k ) Taxable dividends: $3,103 (reported on 6.3% of returns )(% of AGI for various income ranges: 0.8% for AGIs below $10k , 0.4% for AGIs $10k-25k , 0.3% for AGIs $25k-50k , 1.4% for AGIs $50k-75k , 0.7% for AGIs $75k-100k , 0.8% for AGIs over 100k ) Net capital gain/loss: +$9,900 (reported on 5.4% of returns )Here:
+$9,900State:
+$16,110
(% of AGI for various income ranges: -0.5% for AGIs below $10k , 0.1% for AGIs $10k-25k , 0.5% for AGIs $25k-50k , 1.0% for AGIs $50k-75k , 0.7% for AGIs $75k-100k , 7.5% for AGIs over 100k ) Profit/loss from business: +$8,605 (reported on 17.7% of returns )Here:
+$8,605State:
+$11,013
(% of AGI for various income ranges: 14.2% for AGIs below $10k , 8.6% for AGIs $10k-25k , 1.9% for AGIs $25k-50k , 2.3% for AGIs $50k-75k , 3.3% for AGIs $75k-100k , 7.9% for AGIs over 100k ) IRA payment deduction: $3,558 (reported on 1.2% of returns )Total itemized deductions: $16,496 (21% of AGI, reported on 10.9% of returns )Here:
$16,496State:
$19,631
Here:
21.1% of AGIState:
18.9% of AGI
(% of AGI for various income ranges: 1.9% for AGIs below $10k , 1.6% for AGIs $10k-25k , 6.1% for AGIs $25k-50k , 10.7% for AGIs $50k-75k , 9.7% for AGIs $75k-100k , 7.3% for AGIs over 100k ) Charity contributions deductions: $3,324 (4% of AGI, reported on 8.4% of returns )Here:
4.0% of AGIState:
4.2% of AGI
(% of AGI for various income ranges: 0.2% for AGIs $10k-25k , 0.6% for AGIs $25k-50k , 1.4% for AGIs $50k-75k , 1.8% for AGIs $75k-100k , 1.8% for AGIs over 100k ) Total tax: $4,261 (reported on 53.4% of returns )(% of AGI for various income ranges: 3.6% for AGIs below $10k , 2.4% for AGIs $10k-25k , 4.5% for AGIs $25k-50k , 7.1% for AGIs $50k-75k , 10.3% for AGIs $75k-100k , 18.9% for AGIs over 100k ) Earned income credit: $2,406 (reported on 47.9% of returns )Percentage of individuals using paid preparers for their 2004 taxes: 69.6%(% for various income ranges: 65.6% for AGIs below $10k , 76.2% for AGIs $10k-25k , 67.2% for AGIs $25k-50k , 63.2% for AGIs $50k-75k , 51.2% for AGIs $75k-100k , 72.1% for AGIs over 100k )
Estimated median household income in 2022: This zip code:
$54,554Texas:
$72,284
Nearest zip codes: 78578 ,
78597 ,
78583 ,
78526 ,
78575 ,
78521 .
Port Isabel Zip Code Map
Percentage of family households: This zip code:
64.3%Texas:
50.5%
Percentage of households with unmarried partners: This zip code:
0.9%Texas:
48.7%
Likely homosexual households (counted as self-reported same-sex unmarried-partner households)
Lesbian couples: 0.0% of all households Gay men: 0.1% of all households
Household received Food Stamps/SNAP in the past 12 months: 1,365Household did not receive Food Stamps/SNAP in the past 12 months: 6,092
Women who had a birth in the past 12 months: 277 (160 now married , 115 unmarried) Women who did not have a birth in the past 12 months: 5,630 (2,634 now married , 2,990 unmarried)
Housing units in zip code 78566 with a mortgage: 2,153 (74
second mortgage )
Median monthly owner costs for units with a mortgage: $1,374
Median monthly owner costs for units without a mortgage: $474
Residents with income below the poverty level in 2022:
This zip code:
27.3%Whole state:
14.0%
Residents with income below 50% of the poverty level in 2022:
This zip code:
14.3%Whole state:
7.4%
Median number of rooms in houses and condos: Median number of rooms in apartments: Notable locations in this zip code not listed on our city pages
Click to draw/clear zip code borders Notable locations in zip code 78566: (A) , Wardner Ranch (B) , Buena Vista Ranch (C) , Granjeno Ranch (D) , La Coma Ranch (E) , Los Fresnos Fire Department (F) , Cameron County Sheriff's Office (G) , Los Fresnos Police Department (H) , Ethel L Whipple Memorial Library (I) , Los Fresnos Ambulance Service (J) . Display/hide their locations on the map
Churches in zip code 78566 include: (A) , First Baptist Church (B) . Display/hide their locations on the map
Cemetery: (1) . Display/hide its location on the map
Lakes, reservoirs, and swamps: (A) , Resaca Reparo (B) , Resaca de los Cuates (C) , Resaca de las Antonias (D) , Charco Hondo (E) , Laguna Atascosa (F) , Laguna de los Patos (G) , Agua Negra (H) . Display/hide their locations on the map
Year house built (houses)
52 2020 or later1,736 2010 to 20192,826 2000 to 20091,039 1990 to 19991,090 1980 to 19891,028 1970 to 1979290 1960 to 1969184 1950 to 19592 1940 to 1949115 1939 or earlier
Zip code 78566 household income distribution in 2022 811 Less than $10,000333 $10,000 to $14,999409 $15,000 to $19,999363 $20,000 to $24,999361 $25,000 to $29,999594 $30,000 to $34,999348 $35,000 to $39,999185 $40,000 to $44,999178 $45,000 to $49,999370 $50,000 to $59,999688 $60,000 to $74,999964 $75,000 to $99,999568 $100,000 to $124,999345 $125,000 to $149,999607 $150,000 to $199,999347 $200,000 or moreEstimate of home value of owner-occupied houses/condos in 2022 in zip code 78566 12 Less than $10,00073 $15,000 to $19,99919 $20,000 to $24,99958 $25,000 to $29,99910 $30,000 to $34,99986 $35,000 to $39,999214 $40,000 to $49,999122 $50,000 to $59,999241 $60,000 to $69,999263 $70,000 to $79,999210 $80,000 to $89,999221 $90,000 to $99,999770 $100,000 to $124,999347 $125,000 to $149,999396 $150,000 to $174,999187 $175,000 to $199,999445 $200,000 to $249,999233 $250,000 to $299,999551 $300,000 to $399,999131 $400,000 to $499,999183 $500,000 to $749,9991 $750,000 to $999,99946 $1,000,000 to $1,499,99953 $1,500,000 to $1,999,999Rent paid by renters in 2022 in zip code 78566 82 Less than $10025 $100 to $14911 $150 to $19930 $200 to $249108 $250 to $29938 $300 to $3492 $350 to $39970 $450 to $49995 $500 to $54971 $550 to $599293 $600 to $649363 $650 to $69997 $700 to $7492 $750 to $799185 $800 to $89934 $900 to $99972 $1,000 to $1,249130 $1,500 to $1,99919 $2,000 to $2,49992 No cash rent
Median gross rent in 2022: $872.
Median price asked for vacant for-sale houses and condos in 2022: $675,261.
Estimated median house (or condo) value in 2022 for: White Non-Hispanic householders: $282,742Black or African American householders: $113,278American Indian or Alaska Native householders: $54,071Asian householders: $339,834Native Hawaiian and other Pacific Islander householders: $113,278Some other race householders: $158,891Two or more races householders: $244,680Hispanic or Latino householders: $149,527Estimated median house or condo value in 2022: $143,486
78566:
$143,486Texas:
$275,400
Lower value quartile - upper value quartile: $100,011 - $244,359
Mean price in 2022: Detached houses: $181,349Here:
$181,349State:
$369,058
Townhouses or other attached units: $140,251Here:
$140,251State:
$327,631
In 2-unit structures: $107,995Here:
$107,995State:
$374,947
In 3-to-4-unit structures: $339,239Here:
$339,239State:
$209,652
In 5-or-more-unit structures: $70,923Here:
$70,923State:
$413,944
Mobile homes: $52,685Here:
$52,685State:
$124,413
Occupied boats, RVs, vans, etc.: $44,074Here:
$44,074State:
$73,921
Housing units in structures:
One, detached: 6,401One, attached: 168Two: 1423 or 4: 745 to 9: 2610 to 19: 17920 to 49: 22050 or more: 162Mobile homes: 999Unemployment : 5.7%
Means of transportation to work in zip code 78566 78.8% 7,651 Drove a car alone11.4% 1,104 Carpooled0.2% 24 Motorcycle0.4% 42 Walked0.5% 46 Other means6.4% 619 Worked at homeTravel time to work (commute) in zip code 78566 82 Less than 5 minutes729 5 to 9 minutes828 10 to 14 minutes1,497 15 to 19 minutes1,851 20 to 24 minutes860 25 to 29 minutes1,619 30 to 34 minutes284 35 to 39 minutes476 40 to 44 minutes396 45 to 59 minutes116 60 to 89 minutes137 90 or more minutes
Percentage of zip code residents living and working in this county: 90.7%
Household type by relationship:
Households: 24,883
Male householders: 3,457 (434 living alone ), Female householders: 3,983 (738 living alone )3,947 spouses (3,896 opposite-sex spouses ), 299 unmarried partners , (272 opposite-sex unmarried partners ), 9,634 children (9,103 natural , 370 adopted , 160 stepchildren ), 1,341 grandchildren , 319 brothers or sisters , 720 parents , 7 foster children , 727 other relatives , 256 non-relatives In group quarters: 75 (-1 institutionalized population )
Size of family households: 1,679 2-persons , 1,682 3-persons , 1,342 4-persons , 774 5-persons , 433 6-persons , 192 7-or-more-persons
Size of nonfamily households: 1,171 1-person , 67 2-persons , 9 3-persons , 8 4-persons
3,878 married couples with children. single-parent households (1,462 men , 1,049 women ).
33.2% of residents of 78566 zip code speak English at home. of residents speak Spanish at home (60% very well, 22% well, 11% not well, 7% not at all ).of residents speak other Indo-European language at home (66% very well, 34% well ).of residents speak Asian or Pacific Island language at home (56% very well, 44% well ).
Foreign born population: 5,407 (21.7%)
(35.6%
of them are naturalized citizens )
This zip code:
21.7%Whole state:
17.2%
86% Honduras 3% Costa Rica 2% El Salvador 2% Guatemala 1% Barbados 1% Bhutan 0% Belize 2% English 1% American 0% Irish 0% German 0% Scotch-Irish 0% European 0% Scottish
Year of entry for the foreign-born population
1,309 2010 or later 1,130 2000 to 2009 976 1990 to 1999 2,085 Before 1990
Facilities with environmental interests located in this zip code:
AG-AIR INCORPORATED (2 MILE WEST HIGHWAY 100 in LOS FRESNOS, TX)
(Integrated Compliance Information System) - ICIS-06-1984-0044, FORMAL ENFORCEMENT ACTION (Resource Conservation and Recovery Act (tracking hazardous waste)) Business SIC classification: CROP PLANTING, CULTIVATING, AND PROTECTINGBusiness NAICS classification: SOIL PREPARATION, PLANTING, AND CULTIVATING.
Housing units lacking complete plumbing facilities: 1.4%
Housing units lacking complete kitchen facilities: 1.8%
93.0% Electricity 3.1% Utility gas 2.1% Bottled, tank, or LP gas 1.3% No fuel used
Population in 1990: 9,033. Population change in the 1990s: +3,241 (+35.9%).
Place of birth for U.S.-born residents:
This state: 16,418Northeast: 208Midwest: 1,226South: 514West: 747
56% of the 78566 zip code residents lived in the same house 5 years ago.
Out of people who lived in different houses, 79% lived in this county.
Out of people who lived in different counties, 50% lived in Texas.
95% of the 78566 zip code residents lived in the same house 1 year ago.
Out of people who lived in different houses, 72% moved from this county.
Out of people who lived in different houses, 5% moved from different county within same state.
Out of people who lived in different houses, 3% moved from different state.
Out of people who lived in different houses, 22% moved from abroad.
Private vs. public school enrollment:
Students in private schools in grades 1 to 8 (elementary and middle school): 29
Students in private schools in grades 9 to 12 (high school): 176
Students in private undergraduate colleges: 83
Occupation by median earnings in the past 12 months ($)
88,538 Computer and mathematical occupations 78,996 Health diagnosing and treating practitioners and other technical occupations 67,755 Architecture and engineering occupations 59,777 Life, physical, and social science occupations 58,803 Management occupations 54,438 Education, training, and library occupations
Companies with federal contracts located in this zip code:
KEEP IT CLEAN (RT3 BOX 78 in LOS FRESNOS, TX; small business) in 5 contracts from 2002 to 2006
Contracts for Custodial Janitorial Services by NavySigned by year: 2000: $0; 2001: $0; 2002: $12,450; 2003: $10,830; 2004: $0; 2005: $14,377; 2006: $14,690.
Biggest contracts: with Navy for Custodial Janitorial Services. Signed on 2006-05-18. Completion date: 2007-05-31.
, same as above. Signed on 2005-05-26. Completion date: 2007-05-31.
, same as above. Signed on 2003-05-30. Completion date: 2003-05-31.
, same as above. Signed on 2002-05-28. Completion date: 2003-05-31.
CAMERON COUNTY IRRIGATION DIST (1 MILE N FM 803 in LOS FRESNOS, TX)
$3,144 with U.S. Army Corps of Engineers - civil program financing only for Accounting Services (NOTE: New code created for Financial Services See R710 below). Signed on 2003-06-30. Completion date: 2003-12-30.
Top industries in this zip code by the number of employees in 2005:
Health Care and Social Assistance: Other Community Housing Services (100-249 employees: 1 establishment)Construction: All Other Specialty Trade Contractors (50-99: 1, 5-9: 1, 1-4: 1)Accommodation and Food Services: Full-Service Restaurants (20-49: 1, 5-9: 2, 1-4: 6)Accommodation and Food Services: Limited-Service Restaurants (10-19: 3)Health Care and Social Assistance: Child Day Care Services (20-49: 1, 5-9: 1, 1-4: 1)Wholesale Trade: Refrigeration Equipment and Supplies Merchant Wholesalers (20-49: 1)Educational Services: Elementary and Secondary Schools (20-49: 1)
People in group quarters in 2010:
808 people in federal detention centers
112 people in group homes for juveniles (non-correctional)
People in group quarters in 2000:
550 people in federal prisons and detention centers
33 people in job corps and vocational training facilities
6 people in other noninstitutional group quarters
Fatal accident statistics in 2013:
Fatal accident count: 2Vehicles involved in fatal accidents: 3Fatal accidents caused by drunken drivers: 2Fatalities: 6Persons involved in fatal accidents: 7Pedestrians involved in fatal accidents: 0
Fatal accident statistics in 2012:
Fatal accident count: 2Vehicles involved in fatal accidents: 3Fatal accidents caused by drunken drivers: 1Fatalities: 3Persons involved in fatal accidents: 5Pedestrians involved in fatal accidents: 0
Home Mortgage Disclosure Act Aggregated Statistics For Year 2009(Based on 1 full and 10 partial tracts) A) FHA, FSA/RHS & VA B) Conventional C) Refinancings D) Home Improvement Loans E) Loans on Dwellings For 5+ Families F) Non-occupant Loans on G) Loans On Manufactured Number Average Value Number Average Value Number Average Value Number Average Value Number Average Value Number Average Value Number Average Value
LOANS ORIGINATED 66 $129,434 54 $136,731 110 $144,418 14 $28,296 1 $300,000 31 $132,040 0 $0 APPLICATIONS APPROVED, NOT ACCEPTED 6 $109,968 7 $106,923 25 $161,564 4 $62,035 0 $0 3 $183,247 0 $0 APPLICATIONS DENIED 11 $160,423 21 $116,741 85 $127,664 82 $23,025 0 $0 14 $100,822 10 $21,081 APPLICATIONS WITHDRAWN 8 $178,188 11 $137,941 43 $144,153 14 $41,211 0 $0 5 $134,462 0 $0 FILES CLOSED FOR INCOMPLETENESS 1 $49,940 1 $97,870 7 $157,914 5 $39,094 0 $0 0 $0 0 $0
Aggregated Statistics For Year 2008(Based on 1 full and 10 partial tracts) A) FHA, FSA/RHS & VA B) Conventional C) Refinancings D) Home Improvement Loans E) Loans on Dwellings For 5+ Families F) Non-occupant Loans on G) Loans On Manufactured Number Average Value Number Average Value Number Average Value Number Average Value Number Average Value Number Average Value Number Average Value
LOANS ORIGINATED 42 $110,513 117 $131,859 95 $120,512 41 $35,837 0 $0 55 $131,315 8 $30,479 APPLICATIONS APPROVED, NOT ACCEPTED 2 $56,660 19 $124,101 28 $101,885 7 $31,586 0 $0 4 $186,505 2 $79,985 APPLICATIONS DENIED 9 $114,064 30 $146,104 179 $116,717 117 $27,540 1 $1,613,000 16 $176,886 10 $24,991 APPLICATIONS WITHDRAWN 6 $105,513 15 $144,615 44 $107,927 15 $36,151 0 $0 6 $134,647 2 $67,585 FILES CLOSED FOR INCOMPLETENESS 4 $74,748 7 $88,154 9 $96,896 6 $63,765 0 $0 1 $70,670 1 $80,880
Aggregated Statistics For Year 2007(Based on 1 full and 10 partial tracts) A) FHA, FSA/RHS & VA B) Conventional C) Refinancings D) Home Improvement Loans F) Non-occupant Loans on G) Loans On Manufactured Number Average Value Number Average Value Number Average Value Number Average Value Number Average Value Number Average Value
LOANS ORIGINATED 27 $96,394 291 $120,668 175 $128,168 61 $31,461 121 $123,460 6 $42,115 APPLICATIONS APPROVED, NOT ACCEPTED 3 $120,777 42 $99,723 43 $121,687 14 $24,686 8 $92,862 0 $0 APPLICATIONS DENIED 3 $92,537 93 $109,903 307 $102,597 152 $28,180 49 $110,731 15 $32,861 APPLICATIONS WITHDRAWN 0 $0 30 $121,488 106 $107,215 33 $40,598 16 $100,209 2 $19,790 FILES CLOSED FOR INCOMPLETENESS 1 $94,570 11 $110,616 30 $121,690 6 $30,198 6 $99,377 0 $0
Aggregated Statistics For Year 2006(Based on 1 full and 10 partial tracts) A) FHA, FSA/RHS & VA B) Conventional C) Refinancings D) Home Improvement Loans F) Non-occupant Loans on G) Loans On Manufactured Number Average Value Number Average Value Number Average Value Number Average Value Number Average Value Number Average Value
LOANS ORIGINATED 35 $110,616 359 $107,356 164 $128,313 56 $56,042 116 $112,299 9 $31,230 APPLICATIONS APPROVED, NOT ACCEPTED 2 $84,130 93 $91,385 52 $111,660 15 $32,058 13 $71,367 4 $30,410 APPLICATIONS DENIED 7 $94,026 132 $92,299 293 $91,829 129 $25,995 47 $79,777 23 $27,497 APPLICATIONS WITHDRAWN 2 $97,690 42 $100,044 156 $102,449 18 $50,706 10 $83,516 3 $22,370 FILES CLOSED FOR INCOMPLETENESS 0 $0 17 $143,451 44 $115,552 0 $0 6 $98,077 0 $0
Aggregated Statistics For Year 2005(Based on 1 full and 10 partial tracts) A) FHA, FSA/RHS & VA B) Conventional C) Refinancings D) Home Improvement Loans E) Loans on Dwellings For 5+ Families F) Non-occupant Loans on G) Loans On Manufactured Number Average Value Number Average Value Number Average Value Number Average Value Number Average Value Number Average Value Number Average Value
LOANS ORIGINATED 37 $94,427 280 $98,013 228 $94,274 33 $68,715 0 $0 85 $110,317 13 $25,320 APPLICATIONS APPROVED, NOT ACCEPTED 2 $76,810 75 $79,287 52 $91,492 12 $34,459 0 $0 4 $85,760 10 $48,855 APPLICATIONS DENIED 12 $91,917 111 $81,738 312 $78,701 104 $22,657 0 $0 16 $101,173 23 $32,017 APPLICATIONS WITHDRAWN 1 $30,820 52 $84,528 114 $101,290 32 $105,466 1 $61,240 8 $115,926 1 $40,510 FILES CLOSED FOR INCOMPLETENESS 0 $0 12 $85,602 56 $107,751 1 $64,050 0 $0 1 $84,320 0 $0
Aggregated Statistics For Year 2004(Based on 1 full and 10 partial tracts) A) FHA, FSA/RHS & VA B) Conventional C) Refinancings D) Home Improvement Loans F) Non-occupant Loans on G) Loans On Manufactured Number Average Value Number Average Value Number Average Value Number Average Value Number Average Value Number Average Value
LOANS ORIGINATED 62 $86,843 226 $106,593 208 $94,479 46 $34,112 67 $90,564 14 $24,650 APPLICATIONS APPROVED, NOT ACCEPTED 2 $124,555 37 $70,904 70 $82,366 6 $62,037 13 $92,880 8 $30,400 APPLICATIONS DENIED 3 $85,380 73 $67,015 236 $74,338 111 $23,456 22 $41,197 29 $29,069 APPLICATIONS WITHDRAWN 7 $83,090 43 $93,223 116 $92,283 12 $57,868 9 $82,699 2 $30,115 FILES CLOSED FOR INCOMPLETENESS 1 $143,250 12 $99,084 44 $94,817 4 $29,405 3 $59,340 0 $0
Aggregated Statistics For Year 2003(Based on 1 full and 10 partial tracts) A) FHA, FSA/RHS & VA B) Conventional C) Refinancings D) Home Improvement Loans E) Loans on Dwellings For 5+ Families F) Non-occupant Loans on Number Average Value Number Average Value Number Average Value Number Average Value Number Average Value Number Average Value
LOANS ORIGINATED 50 $82,120 170 $97,828 278 $94,742 34 $16,385 1 $160,000 78 $88,934 APPLICATIONS APPROVED, NOT ACCEPTED 4 $83,202 43 $91,947 55 $86,861 6 $45,347 0 $0 10 $113,584 APPLICATIONS DENIED 9 $85,989 77 $62,414 225 $86,799 65 $17,337 0 $0 16 $105,354 APPLICATIONS WITHDRAWN 8 $74,172 29 $72,752 131 $76,498 1 $40,000 0 $0 15 $82,355 FILES CLOSED FOR INCOMPLETENESS 2 $112,090 9 $134,219 23 $89,408 1 $60,000 0 $0 1 $471,100
Aggregated Statistics For Year 2002(Based on 4 partial tracts) A) FHA, FSA/RHS & VA B) Conventional C) Refinancings D) Home Improvement Loans E) Loans on Dwellings For 5+ Families F) Non-occupant Loans on Number Average Value Number Average Value Number Average Value Number Average Value Number Average Value Number Average Value
LOANS ORIGINATED 19 $88,518 161 $93,921 129 $95,813 25 $14,824 1 $866,820 62 $99,107 APPLICATIONS APPROVED, NOT ACCEPTED 7 $105,019 19 $58,794 31 $89,329 6 $54,047 0 $0 3 $57,160 APPLICATIONS DENIED 8 $72,541 32 $60,380 100 $73,864 52 $12,417 0 $0 15 $79,129 APPLICATIONS WITHDRAWN 0 $0 16 $77,130 41 $106,232 2 $9,220 0 $0 6 $76,318 FILES CLOSED FOR INCOMPLETENESS 1 $78,300 7 $127,420 19 $80,348 0 $0 0 $0 5 $165,638
Aggregated Statistics For Year 2001(Based on 4 partial tracts) A) FHA, FSA/RHS & VA B) Conventional C) Refinancings D) Home Improvement Loans F) Non-occupant Loans on Number Average Value Number Average Value Number Average Value Number Average Value Number Average Value
LOANS ORIGINATED 19 $82,263 112 $93,366 108 $87,449 29 $15,406 53 $83,273 APPLICATIONS APPROVED, NOT ACCEPTED 3 $73,290 28 $64,206 18 $80,987 3 $80,810 8 $122,369 APPLICATIONS DENIED 4 $66,868 40 $44,331 77 $56,032 40 $11,546 15 $75,603 APPLICATIONS WITHDRAWN 1 $90,340 11 $75,185 32 $62,623 1 $21,510 3 $89,947 FILES CLOSED FOR INCOMPLETENESS 1 $49,940 4 $82,098 6 $80,753 3 $23,763 3 $77,670
Aggregated Statistics For Year 2000(Based on 4 partial tracts) A) FHA, FSA/RHS & VA B) Conventional C) Refinancings D) Home Improvement Loans E) Loans on Dwellings For 5+ Families F) Non-occupant Loans on Number Average Value Number Average Value Number Average Value Number Average Value Number Average Value Number Average Value
LOANS ORIGINATED 14 $77,365 117 $79,201 50 $82,084 31 $11,825 1 $70,670 40 $75,817 APPLICATIONS APPROVED, NOT ACCEPTED 0 $0 23 $65,652 7 $53,574 0 $0 0 $0 2 $61,715 APPLICATIONS DENIED 7 $62,619 73 $47,915 34 $50,927 35 $10,657 0 $0 20 $40,108 APPLICATIONS WITHDRAWN 2 $73,490 13 $88,197 12 $52,808 0 $0 1 $206,500 3 $150,753 FILES CLOSED FOR INCOMPLETENESS 0 $0 2 $107,410 14 $63,324 0 $0 0 $0 1 $88,570
Aggregated Statistics For Year 1999(Based on 3 partial tracts) A) FHA, FSA/RHS & VA B) Conventional C) Refinancings D) Home Improvement Loans F) Non-occupant Loans on Number Average Value Number Average Value Number Average Value Number Average Value Number Average Value
LOANS ORIGINATED 13 $72,076 62 $68,039 45 $66,636 27 $6,783 18 $54,853 APPLICATIONS APPROVED, NOT ACCEPTED 0 $0 13 $52,272 13 $52,498 4 $23,150 2 $49,335 APPLICATIONS DENIED 2 $51,205 51 $43,090 23 $42,783 27 $7,027 4 $23,492 APPLICATIONS WITHDRAWN 1 $75,090 10 $84,286 15 $57,654 1 $22,930 1 $42,280 FILES CLOSED FOR INCOMPLETENESS 1 $57,270 1 $40,000 5 $58,784 0 $0 0 $0
Private Mortgage Insurance Companies Aggregated Statistics For Year 2009(Based on 1 full and 8 partial tracts) A) Conventional B) Refinancings C) Non-occupant Loans on Number Average Value Number Average Value Number Average Value
LOANS ORIGINATED 12 $116,862 3 $180,683 1 $98,930 APPLICATIONS APPROVED, NOT ACCEPTED 5 $143,676 1 $64,000 1 $153,580 APPLICATIONS DENIED 9 $128,290 2 $379,350 0 $0 APPLICATIONS WITHDRAWN 0 $0 1 $63,670 0 $0 FILES CLOSED FOR INCOMPLETENESS 1 $210,110 0 $0 1 $210,110
Aggregated Statistics For Year 2008(Based on 1 full and 10 partial tracts) A) Conventional B) Refinancings C) Non-occupant Loans on Number Average Value Number Average Value Number Average Value
LOANS ORIGINATED 41 $116,427 7 $123,947 10 $85,427 APPLICATIONS APPROVED, NOT ACCEPTED 16 $102,218 5 $138,736 3 $63,280 APPLICATIONS DENIED 4 $105,205 2 $143,985 0 $0 APPLICATIONS WITHDRAWN 1 $219,530 1 $82,690 0 $0 FILES CLOSED FOR INCOMPLETENESS 0 $0 0 $0 0 $0
Aggregated Statistics For Year 2007(Based on 1 full and 10 partial tracts) A) Conventional B) Refinancings C) Non-occupant Loans on Number Average Value Number Average Value Number Average Value
LOANS ORIGINATED 64 $132,697 19 $154,065 13 $137,211 APPLICATIONS APPROVED, NOT ACCEPTED 14 $120,274 2 $146,685 2 $120,665 APPLICATIONS DENIED 0 $0 0 $0 0 $0 APPLICATIONS WITHDRAWN 3 $132,450 0 $0 0 $0 FILES CLOSED FOR INCOMPLETENESS 0 $0 0 $0 0 $0
Aggregated Statistics For Year 2006(Based on 1 full and 10 partial tracts) A) Conventional B) Refinancings C) Non-occupant Loans on Number Average Value Number Average Value Number Average Value
LOANS ORIGINATED 55 $140,787 15 $126,961 11 $127,137 APPLICATIONS APPROVED, NOT ACCEPTED 11 $124,211 4 $119,208 5 $132,850 APPLICATIONS DENIED 0 $0 0 $0 0 $0 APPLICATIONS WITHDRAWN 8 $130,569 0 $0 1 $226,130 FILES CLOSED FOR INCOMPLETENESS 1 $92,340 0 $0 1 $92,340
Aggregated Statistics For Year 2005(Based on 1 full and 10 partial tracts) A) Conventional B) Refinancings C) Non-occupant Loans on D) Loans On Manufactured Number Average Value Number Average Value Number Average Value Number Average Value
LOANS ORIGINATED 45 $109,912 15 $102,594 8 $80,796 1 $53,340 APPLICATIONS APPROVED, NOT ACCEPTED 12 $174,729 5 $100,676 3 $95,163 0 $0 APPLICATIONS DENIED 1 $91,390 0 $0 0 $0 0 $0 APPLICATIONS WITHDRAWN 1 $236,610 1 $91,380 0 $0 0 $0 FILES CLOSED FOR INCOMPLETENESS 0 $0 0 $0 0 $0 0 $0
Aggregated Statistics For Year 2004(Based on 1 full and 10 partial tracts) A) Conventional B) Refinancings C) Non-occupant Loans on D) Loans On Manufactured Number Average Value Number Average Value Number Average Value Number Average Value
LOANS ORIGINATED 60 $108,896 17 $103,085 16 $94,219 1 $47,820 APPLICATIONS APPROVED, NOT ACCEPTED 15 $78,037 3 $75,767 6 $51,978 0 $0 APPLICATIONS DENIED 0 $0 1 $53,340 0 $0 0 $0 APPLICATIONS WITHDRAWN 5 $110,072 1 $102,390 2 $82,035 0 $0 FILES CLOSED FOR INCOMPLETENESS 0 $0 0 $0 0 $0 0 $0
Aggregated Statistics For Year 2003(Based on 1 full and 10 partial tracts) A) Conventional B) Refinancings C) Non-occupant Loans on Number Average Value Number Average Value Number Average Value
LOANS ORIGINATED 44 $100,406 21 $118,956 10 $82,254 APPLICATIONS APPROVED, NOT ACCEPTED 11 $124,536 5 $116,182 5 $148,104 APPLICATIONS DENIED 1 $39,000 0 $0 0 $0 APPLICATIONS WITHDRAWN 1 $58,420 1 $81,030 0 $0 FILES CLOSED FOR INCOMPLETENESS 0 $0 0 $0 0 $0
Aggregated Statistics For Year 2002(Based on 4 partial tracts) A) Conventional B) Refinancings C) Non-occupant Loans on Number Average Value Number Average Value Number Average Value
LOANS ORIGINATED 37 $114,166 12 $158,885 5 $105,150 APPLICATIONS APPROVED, NOT ACCEPTED 3 $74,120 1 $114,430 1 $58,420 APPLICATIONS DENIED 3 $81,970 0 $0 3 $81,970 APPLICATIONS WITHDRAWN 2 $128,140 1 $84,800 0 $0 FILES CLOSED FOR INCOMPLETENESS 1 $76,320 0 $0 1 $76,320
Aggregated Statistics For Year 2001(Based on 4 partial tracts) A) Conventional B) Refinancings C) Non-occupant Loans on Number Average Value Number Average Value Number Average Value
LOANS ORIGINATED 28 $90,777 10 $116,327 7 $78,741 APPLICATIONS APPROVED, NOT ACCEPTED 6 $92,993 4 $132,352 2 $83,855 APPLICATIONS DENIED 0 $0 0 $0 0 $0 APPLICATIONS WITHDRAWN 2 $33,450 1 $156,590 0 $0 FILES CLOSED FOR INCOMPLETENESS 0 $0 1 $44,740 0 $0
Aggregated Statistics For Year 2000(Based on 4 partial tracts) A) Conventional B) Refinancings C) Non-occupant Loans on Number Average Value Number Average Value Number Average Value
LOANS ORIGINATED 27 $64,445 4 $80,400 6 $63,285 APPLICATIONS APPROVED, NOT ACCEPTED 3 $67,293 1 $115,890 0 $0 APPLICATIONS DENIED 0 $0 1 $115,890 0 $0 APPLICATIONS WITHDRAWN 1 $95,160 0 $0 0 $0 FILES CLOSED FOR INCOMPLETENESS 5 $63,504 0 $0 0 $0
Aggregated Statistics For Year 1999(Based on 3 partial tracts) A) Conventional B) Refinancings C) Non-occupant Loans on Number Average Value Number Average Value Number Average Value
LOANS ORIGINATED 13 $88,749 6 $87,672 1 $67,030 APPLICATIONS APPROVED, NOT ACCEPTED 1 $69,640 1 $63,900 0 $0 APPLICATIONS DENIED 1 $95,790 0 $0 0 $0 APPLICATIONS WITHDRAWN 0 $0 0 $0 0 $0 FILES CLOSED FOR INCOMPLETENESS 0 $0 0 $0 0 $0
2002 - 2018 National Fire Incident Reporting System (NFIRS) incidents See full 2006 National Fire Incident Reporting System statistics for zip code 78566, Texas
Most common first names in zip code 78566 among deceased individuals Name Count Lived (average)
Maria 42 72.9 years Jose 27 74.4 years Juan 21 67.9 years John 20 75.3 years Francisco 16 68.9 years Robert 15 73.1 years Pedro 13 74.5 years Guadalupe 13 71.6 years James 12 71.6 years Charles 10 71.1 years
Most common last names in zip code 78566 among deceased individuals Last name Count Lived (average)
Garcia 39 74.4 years Sanchez 18 72.0 years Gonzalez 18 71.3 years Silva 16 71.1 years Martinez 14 69.9 years Perez 13 78.6 years Garza 11 70.7 years Cruz 11 73.3 years Lopez 11 63.5 years Castillo 10 71.8 years
Businesses in zip code 78566
Name Count Name Count
AutoZone 1 Subway 1 Cricket Wireless 3 U-Haul 2
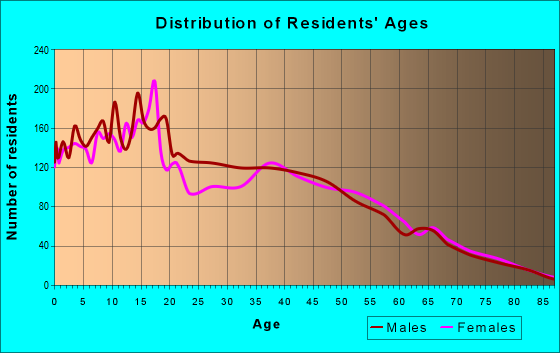
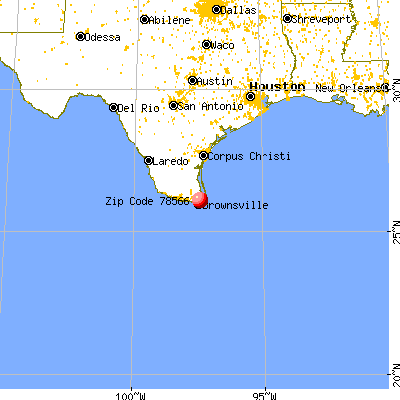


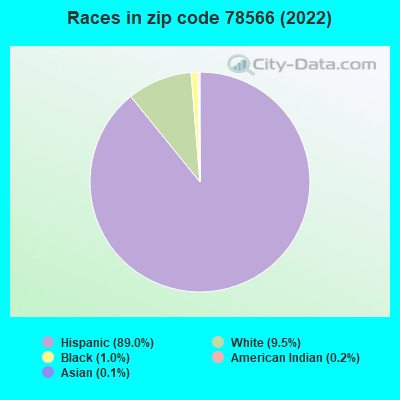


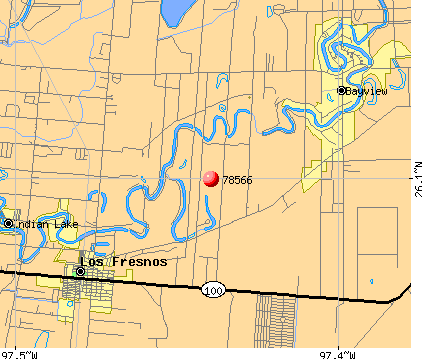 Nearest zip codes: 78578, 78597, 78583, 78526, 78575, 78521.
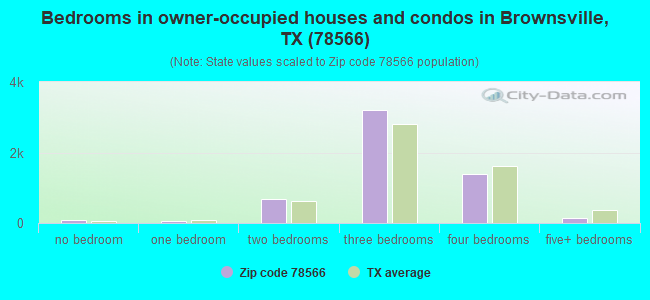
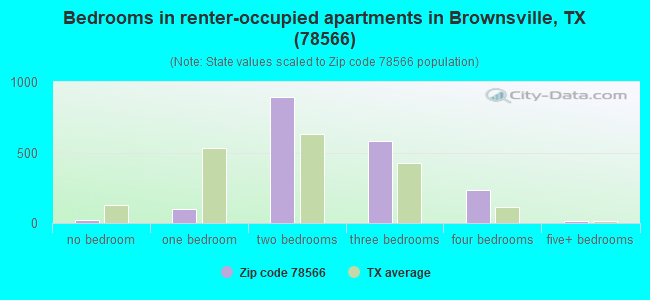
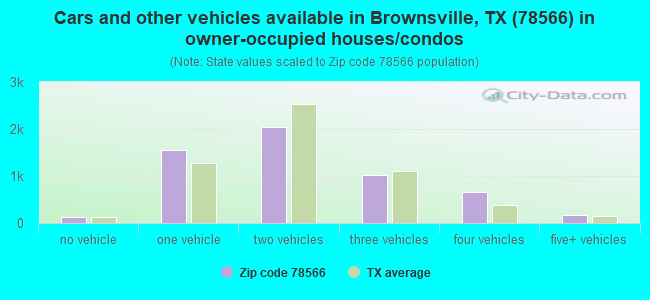
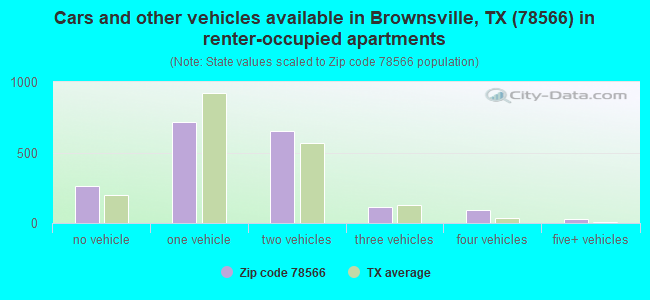


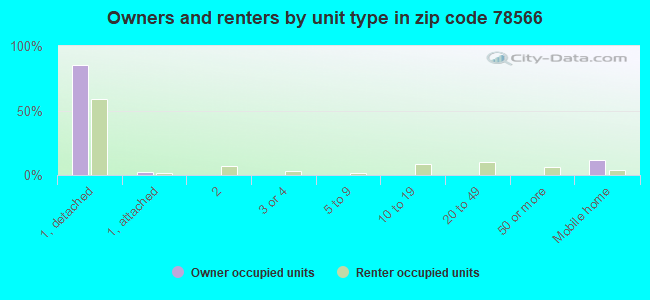
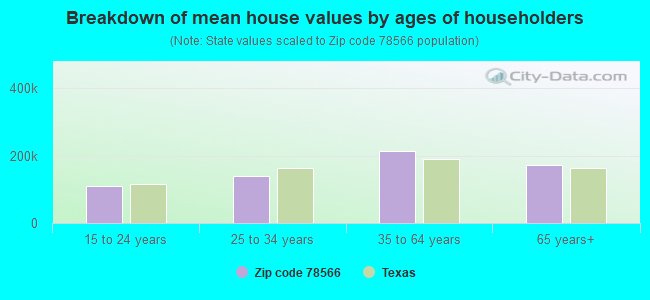


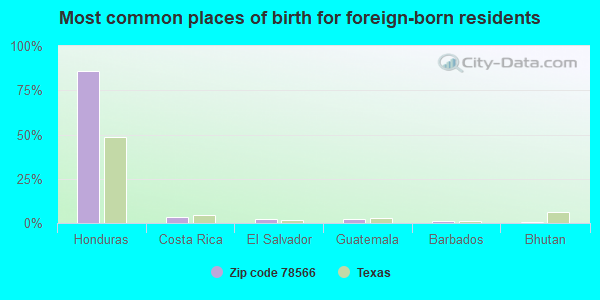
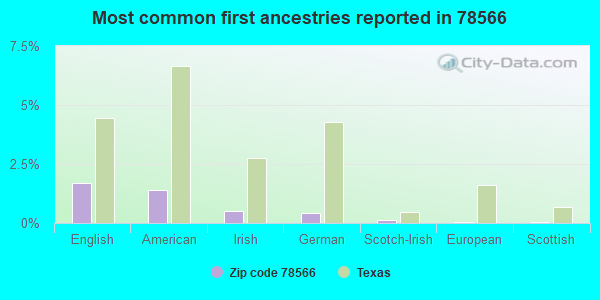

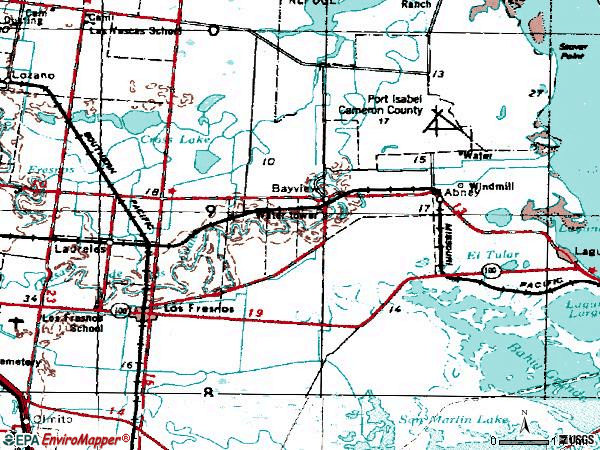

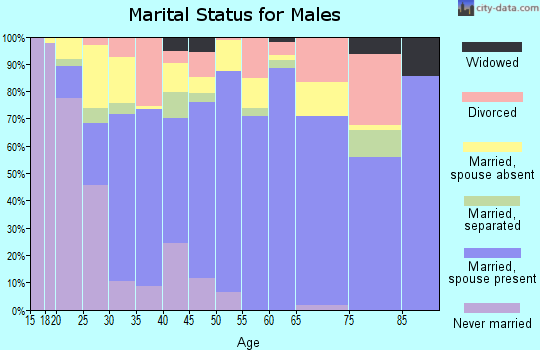
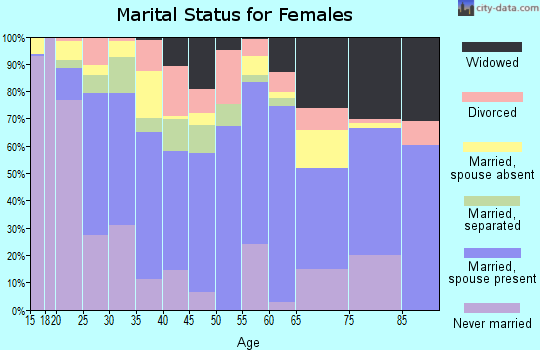
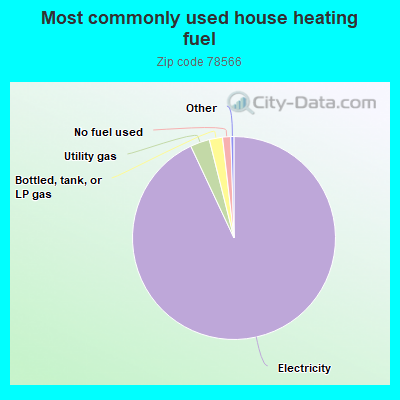
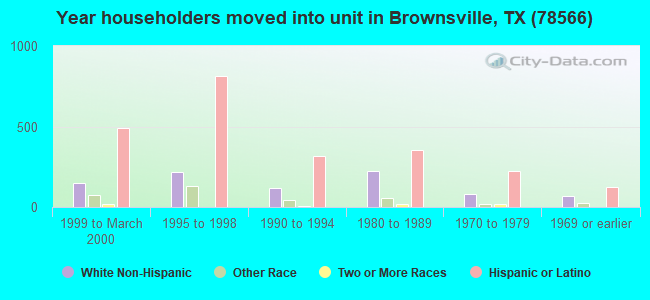
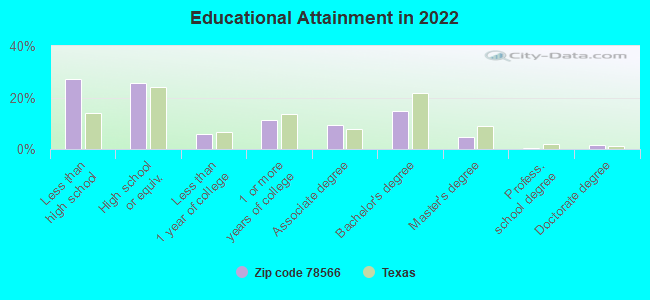
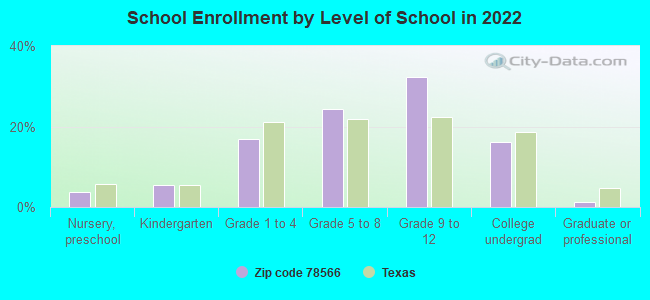
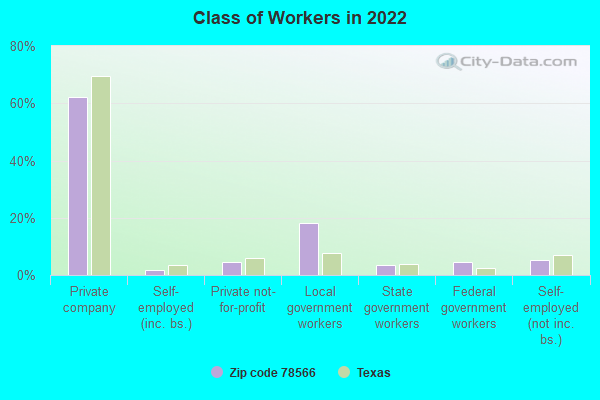

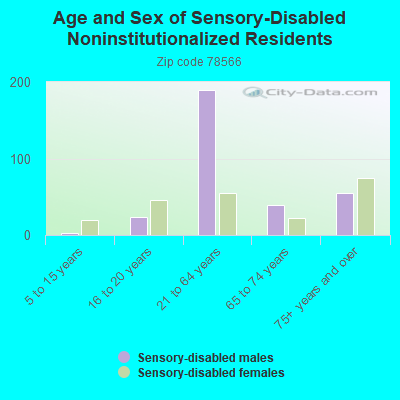
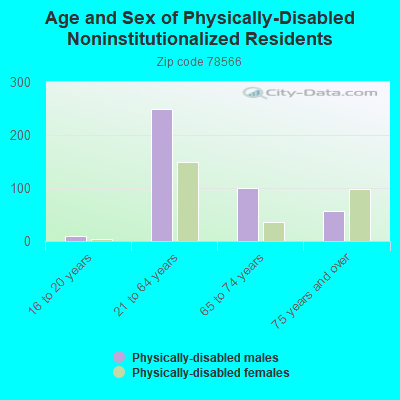
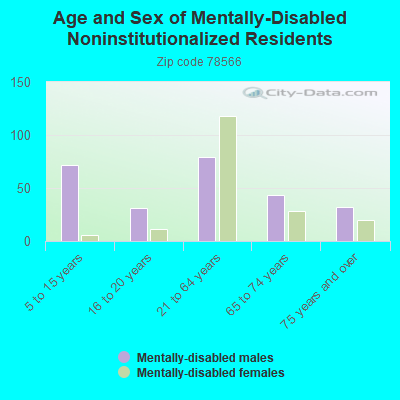
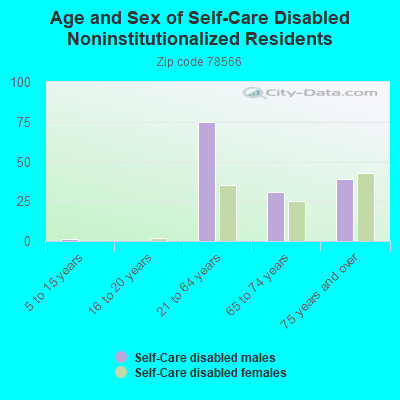
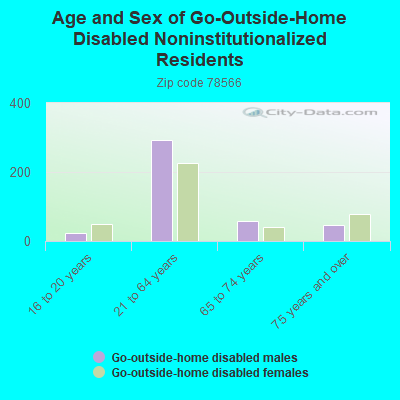
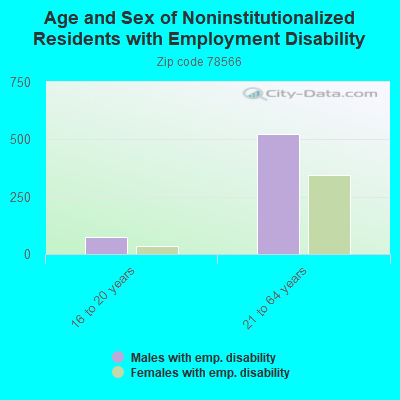
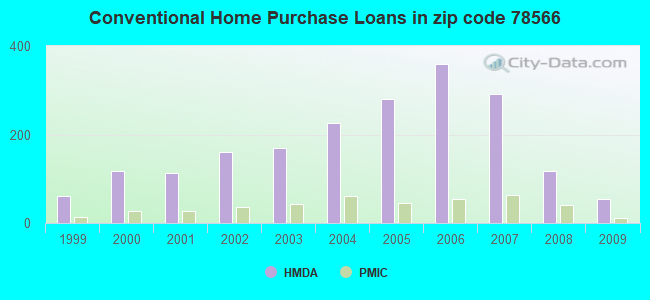
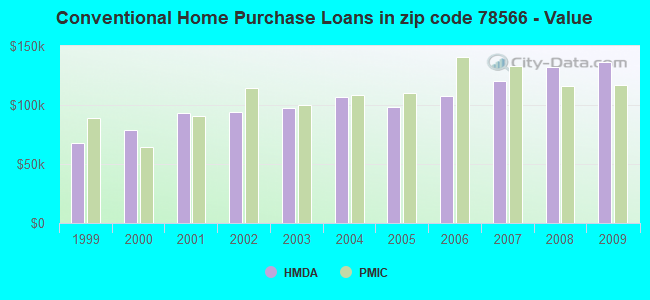
 Based on the data from the years 2002 - 2018 the average number of fires per year is 73. The highest number of reported fire incidents - 185 took place in 2004, and the least - 0 in 2012. The data has a rising trend.
 When looking into fire subcategories, the most reports belonged to: Outside Fires (73.1%), and Structure Fires (11.6%).