Estimated zip code population in 2022: 37,382
Zip code population in 2010: 31,395
Zip code population in 2000: 28,786
Houses and condos: 11,728
Renter-occupied apartments: 5,392
% of renters here:
48%State:
38%
March 2022 cost of living index in zip code 78242: 86.9
(less than average, U.S. average is 100)
Land area: 7.8
sq. mi.
Water area: 0.1
sq. mi.
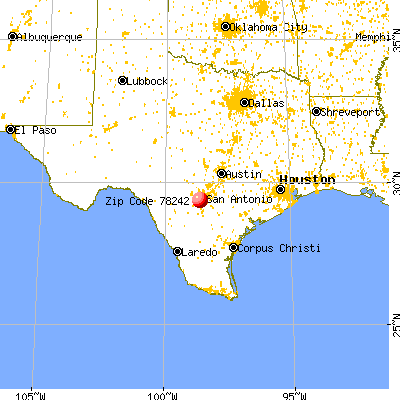
Population density: 4,785 people per square mile (average).
OSM Map
General Map
Google Map
MSN Map
OSM Map
General Map
Google Map
MSN Map
OSM Map
General Map
Google Map
MSN Map
OSM Map
General Map
Google Map
MSN Map
Please wait while loading the map...
Real estate property taxes paid for housing units in 2022:
This zip code:
1.4% ($1,862)Texas:
1.5% ($4,050)
Median real estate property taxes paid for housing units with mortgages in 2022: $2,560 (1.7%)
Median real estate property taxes paid for housing units with no mortgage in 2022: $1,282 (1.2%)
Profiles of local businesses
Business Search - 14 Million verified businesses
Males: 18,900 Females: 18,481
For population 25 years and over in 78242:
High school or higher: 65.4%Bachelor's degree or higher: 9.1%Graduate or professional degree: 1.7%Unemployed: 10.6%Mean travel time to work (commute): 29.4 minutes
For population 15 years and over in 78242:
Never married: 41.6%Now married: 41.8%Separated: 3.7%Widowed: 4.5%Divorced: 8.4%
Zip code 78242 compared to state average:
Median household income below state average. Median house value below state average. Unemployed percentage above state average. Black race population percentage significantly below state average. Hispanic race population percentage above state average. Median age below state average. Length of stay since moving in significantly above state average. Percentage of population with a bachelor's degree or higher significantly below state average. 33,216 88.9% Hispanic or Latino 2,594 6.9% White 723 1.9% Black 520 1.4% Two or more races 209 0.6% Some other race 83 0.2% Asian 33 0.09% American Indian
Data:
Median household income ($)
Median household income (% change since 2000)
Household income diversity
Ratio of average income to average house value (%)
Ratio of average income to average rent
Median household income ($) - White
Median household income ($) - Black or African American
Median household income ($) - Asian
Median household income ($) - Hispanic or Latino
Median household income ($) - American Indian and Alaska Native
Median household income ($) - Multirace
Median household income ($) - Other Race
Median household income for houses/condos with a mortgage ($)
Median household income for apartments without a mortgage ($)
Races - White alone (%)
Races - White alone (% change since 2000)
Races - Black alone (%)
Races - Black alone (% change since 2000)
Races - American Indian alone (%)
Races - American Indian alone (% change since 2000)
Races - Asian alone (%)
Races - Asian alone (% change since 2000)
Races - Hispanic (%)
Races - Hispanic (% change since 2000)
Races - Native Hawaiian and Other Pacific Islander alone (%)
Races - Native Hawaiian and Other Pacific Islander alone (% change since 2000)
Races - Two or more races (%)
Races - Two or more races (% change since 2000)
Races - Other race alone (%)
Races - Other race alone (% change since 2000)
Racial diversity
Unemployment (%)
Unemployment (% change since 2000)
Unemployment (%) - White
Unemployment (%) - Black or African American
Unemployment (%) - Asian
Unemployment (%) - Hispanic or Latino
Unemployment (%) - American Indian and Alaska Native
Unemployment (%) - Multirace
Unemployment (%) - Other Race
Population density (people per square mile)
Population - Males (%)
Population - Females (%)
Population - Males (%) - White
Population - Males (%) - Black or African American
Population - Males (%) - Asian
Population - Males (%) - Hispanic or Latino
Population - Males (%) - American Indian and Alaska Native
Population - Males (%) - Multirace
Population - Males (%) - Other Race
Population - Females (%) - White
Population - Females (%) - Black or African American
Population - Females (%) - Asian
Population - Females (%) - Hispanic or Latino
Population - Females (%) - American Indian and Alaska Native
Population - Females (%) - Multirace
Population - Females (%) - Other Race
Coronavirus confirmed cases (May 17, 2024)
Deaths caused by coronavirus (May 17, 2024)
Coronavirus confirmed cases (per 100k population) (May 17, 2024)
Deaths caused by coronavirus (per 100k population) (May 17, 2024)
Daily increase in number of cases (May 17, 2024)
Weekly increase in number of cases (May 17, 2024)
Cases doubled (in days) (May 17, 2024)
Hospitalized patients (Apr 18, 2022)
Negative test results (Apr 18, 2022)
Total test results (Apr 18, 2022)
COVID Vaccine doses distributed (per 100k population) (Sep 19, 2023)
COVID Vaccine doses administered (per 100k population) (Sep 19, 2023)
COVID Vaccine doses distributed (Sep 19, 2023)
COVID Vaccine doses administered (Sep 19, 2023)
Likely homosexual households (%)
Likely homosexual households (% change since 2000)
Likely homosexual households - Lesbian couples (%)
Likely homosexual households - Lesbian couples (% change since 2000)
Likely homosexual households - Gay men (%)
Likely homosexual households - Gay men (% change since 2000)
Cost of living index
Median gross rent ($)
Median contract rent ($)
Median monthly housing costs ($)
Median house or condo value ($)
Median house or condo value ($ change since 2000)
Mean house or condo value by units in structure - 1, detached ($)
Mean house or condo value by units in structure - 1, attached ($)
Mean house or condo value by units in structure - 2 ($)
Mean house or condo value by units in structure by units in structure - 3 or 4 ($)
Mean house or condo value by units in structure - 5 or more ($)
Mean house or condo value by units in structure - Boat, RV, van, etc. ($)
Mean house or condo value by units in structure - Mobile home ($)
Median house or condo value ($) - White
Median house or condo value ($) - Black or African American
Median house or condo value ($) - Asian
Median house or condo value ($) - Hispanic or Latino
Median house or condo value ($) - American Indian and Alaska Native
Median house or condo value ($) - Multirace
Median house or condo value ($) - Other Race
Median resident age
Resident age diversity
Median resident age - Males
Median resident age - Females
Median resident age - White
Median resident age - Black or African American
Median resident age - Asian
Median resident age - Hispanic or Latino
Median resident age - American Indian and Alaska Native
Median resident age - Multirace
Median resident age - Other Race
Median resident age - Males - White
Median resident age - Males - Black or African American
Median resident age - Males - Asian
Median resident age - Males - Hispanic or Latino
Median resident age - Males - American Indian and Alaska Native
Median resident age - Males - Multirace
Median resident age - Males - Other Race
Median resident age - Females - White
Median resident age - Females - Black or African American
Median resident age - Females - Asian
Median resident age - Females - Hispanic or Latino
Median resident age - Females - American Indian and Alaska Native
Median resident age - Females - Multirace
Median resident age - Females - Other Race
Commute - mean travel time to work (minutes)
Travel time to work - Less than 5 minutes (%)
Travel time to work - Less than 5 minutes (% change since 2000)
Travel time to work - 5 to 9 minutes (%)
Travel time to work - 5 to 9 minutes (% change since 2000)
Travel time to work - 10 to 19 minutes (%)
Travel time to work - 10 to 19 minutes (% change since 2000)
Travel time to work - 20 to 29 minutes (%)
Travel time to work - 20 to 29 minutes (% change since 2000)
Travel time to work - 30 to 39 minutes (%)
Travel time to work - 30 to 39 minutes (% change since 2000)
Travel time to work - 40 to 59 minutes (%)
Travel time to work - 40 to 59 minutes (% change since 2000)
Travel time to work - 60 to 89 minutes (%)
Travel time to work - 60 to 89 minutes (% change since 2000)
Travel time to work - 90 or more minutes (%)
Travel time to work - 90 or more minutes (% change since 2000)
Marital status - Never married (%)
Marital status - Now married (%)
Marital status - Separated (%)
Marital status - Widowed (%)
Marital status - Divorced (%)
Median family income ($)
Median family income (% change since 2000)
Median non-family income ($)
Median non-family income (% change since 2000)
Median per capita income ($)
Median per capita income (% change since 2000)
Median family income ($) - White
Median family income ($) - Black or African American
Median family income ($) - Asian
Median family income ($) - Hispanic or Latino
Median family income ($) - American Indian and Alaska Native
Median family income ($) - Multirace
Median family income ($) - Other Race
Median year house/condo built
Median year apartment built
Year house built - Built 2005 or later (%)
Year house built - Built 2000 to 2004 (%)
Year house built - Built 1990 to 1999 (%)
Year house built - Built 1980 to 1989 (%)
Year house built - Built 1970 to 1979 (%)
Year house built - Built 1960 to 1969 (%)
Year house built - Built 1950 to 1959 (%)
Year house built - Built 1940 to 1949 (%)
Year house built - Built 1939 or earlier (%)
Average household size
Household density (households per square mile)
Average household size - White
Average household size - Black or African American
Average household size - Asian
Average household size - Hispanic or Latino
Average household size - American Indian and Alaska Native
Average household size - Multirace
Average household size - Other Race
Occupied housing units (%)
Vacant housing units (%)
Owner occupied housing units (%)
Renter occupied housing units (%)
Vacancy status - For rent (%)
Vacancy status - For sale only (%)
Vacancy status - Rented or sold, not occupied (%)
Vacancy status - For seasonal, recreational, or occasional use (%)
Vacancy status - For migrant workers (%)
Vacancy status - Other vacant (%)
Residents with income below the poverty level (%)
Residents with income below 50% of the poverty level (%)
Children below poverty level (%)
Poor families by family type - Married-couple family (%)
Poor families by family type - Male, no wife present (%)
Poor families by family type - Female, no husband present (%)
Poverty status for native-born residents (%)
Poverty status for foreign-born residents (%)
Poverty among high school graduates not in families (%)
Poverty among people who did not graduate high school not in families (%)
Residents with income below the poverty level (%) - White
Residents with income below the poverty level (%) - Black or African American
Residents with income below the poverty level (%) - Asian
Residents with income below the poverty level (%) - Hispanic or Latino
Residents with income below the poverty level (%) - American Indian and Alaska Native
Residents with income below the poverty level (%) - Multirace
Residents with income below the poverty level (%) - Other Race
Air pollution - Air Quality Index (AQI)
Air pollution - CO
Air pollution - NO2
Air pollution - SO2
Air pollution - Ozone
Air pollution - PM10
Air pollution - PM25
Air pollution - Pb
Crime - Murders per 100,000 population
Crime - Rapes per 100,000 population
Crime - Robberies per 100,000 population
Crime - Assaults per 100,000 population
Crime - Burglaries per 100,000 population
Crime - Thefts per 100,000 population
Crime - Auto thefts per 100,000 population
Crime - Arson per 100,000 population
Crime - City-data.com crime index
Crime - Violent crime index
Crime - Property crime index
Crime - Murders per 100,000 population (5 year average)
Crime - Rapes per 100,000 population (5 year average)
Crime - Robberies per 100,000 population (5 year average)
Crime - Assaults per 100,000 population (5 year average)
Crime - Burglaries per 100,000 population (5 year average)
Crime - Thefts per 100,000 population (5 year average)
Crime - Auto thefts per 100,000 population (5 year average)
Crime - Arson per 100,000 population (5 year average)
Crime - City-data.com crime index (5 year average)
Crime - Violent crime index (5 year average)
Crime - Property crime index (5 year average)
1996 Presidential Elections Results (%) - Democratic Party (Clinton)
1996 Presidential Elections Results (%) - Republican Party (Dole)
1996 Presidential Elections Results (%) - Other
2000 Presidential Elections Results (%) - Democratic Party (Gore)
2000 Presidential Elections Results (%) - Republican Party (Bush)
2000 Presidential Elections Results (%) - Other
2004 Presidential Elections Results (%) - Democratic Party (Kerry)
2004 Presidential Elections Results (%) - Republican Party (Bush)
2004 Presidential Elections Results (%) - Other
2008 Presidential Elections Results (%) - Democratic Party (Obama)
2008 Presidential Elections Results (%) - Republican Party (McCain)
2008 Presidential Elections Results (%) - Other
2012 Presidential Elections Results (%) - Democratic Party (Obama)
2012 Presidential Elections Results (%) - Republican Party (Romney)
2012 Presidential Elections Results (%) - Other
2016 Presidential Elections Results (%) - Democratic Party (Clinton)
2016 Presidential Elections Results (%) - Republican Party (Trump)
2016 Presidential Elections Results (%) - Other
2020 Presidential Elections Results (%) - Democratic Party (Biden)
2020 Presidential Elections Results (%) - Republican Party (Trump)
2020 Presidential Elections Results (%) - Other
Ancestries Reported - Arab (%)
Ancestries Reported - Czech (%)
Ancestries Reported - Danish (%)
Ancestries Reported - Dutch (%)
Ancestries Reported - English (%)
Ancestries Reported - French (%)
Ancestries Reported - French Canadian (%)
Ancestries Reported - German (%)
Ancestries Reported - Greek (%)
Ancestries Reported - Hungarian (%)
Ancestries Reported - Irish (%)
Ancestries Reported - Italian (%)
Ancestries Reported - Lithuanian (%)
Ancestries Reported - Norwegian (%)
Ancestries Reported - Polish (%)
Ancestries Reported - Portuguese (%)
Ancestries Reported - Russian (%)
Ancestries Reported - Scotch-Irish (%)
Ancestries Reported - Scottish (%)
Ancestries Reported - Slovak (%)
Ancestries Reported - Subsaharan African (%)
Ancestries Reported - Swedish (%)
Ancestries Reported - Swiss (%)
Ancestries Reported - Ukrainian (%)
Ancestries Reported - United States (%)
Ancestries Reported - Welsh (%)
Ancestries Reported - West Indian (%)
Ancestries Reported - Other (%)
Educational Attainment - No schooling completed (%)
Educational Attainment - Less than high school (%)
Educational Attainment - High school or equivalent (%)
Educational Attainment - Less than 1 year of college (%)
Educational Attainment - 1 or more years of college (%)
Educational Attainment - Associate degree (%)
Educational Attainment - Bachelor's degree (%)
Educational Attainment - Master's degree (%)
Educational Attainment - Professional school degree (%)
Educational Attainment - Doctorate degree (%)
School Enrollment - Nursery, preschool (%)
School Enrollment - Kindergarten (%)
School Enrollment - Grade 1 to 4 (%)
School Enrollment - Grade 5 to 8 (%)
School Enrollment - Grade 9 to 12 (%)
School Enrollment - College undergrad (%)
School Enrollment - Graduate or professional (%)
School Enrollment - Not enrolled in school (%)
School enrollment - Public schools (%)
School enrollment - Private schools (%)
School enrollment - Not enrolled (%)
Median number of rooms in houses and condos
Median number of rooms in apartments
Housing units lacking complete plumbing facilities (%)
Housing units lacking complete kitchen facilities (%)
Density of houses
Urban houses (%)
Rural houses (%)
Households with people 60 years and over (%)
Households with people 65 years and over (%)
Households with people 75 years and over (%)
Households with one or more nonrelatives (%)
Households with no nonrelatives (%)
Population in households (%)
Family households (%)
Nonfamily households (%)
Population in families (%)
Family households with own children (%)
Median number of bedrooms in owner occupied houses
Mean number of bedrooms in owner occupied houses
Median number of bedrooms in renter occupied houses
Mean number of bedrooms in renter occupied houses
Median number of vehichles in owner occupied houses
Mean number of vehichles in owner occupied houses
Median number of vehichles in renter occupied houses
Mean number of vehichles in renter occupied houses
Mortgage status - with mortgage (%)
Mortgage status - with second mortgage (%)
Mortgage status - with home equity loan (%)
Mortgage status - with both second mortgage and home equity loan (%)
Mortgage status - without a mortgage (%)
Average family size
Average family size - White
Average family size - Black or African American
Average family size - Asian
Average family size - Hispanic or Latino
Average family size - American Indian and Alaska Native
Average family size - Multirace
Average family size - Other Race
Geographical mobility - Same house 1 year ago (%)
Geographical mobility - Moved within same county (%)
Geographical mobility - Moved from different county within same state (%)
Geographical mobility - Moved from different state (%)
Geographical mobility - Moved from abroad (%)
Place of birth - Born in state of residence (%)
Place of birth - Born in other state (%)
Place of birth - Native, outside of US (%)
Place of birth - Foreign born (%)
Housing units in structures - 1, detached (%)
Housing units in structures - 1, attached (%)
Housing units in structures - 2 (%)
Housing units in structures - 3 or 4 (%)
Housing units in structures - 5 to 9 (%)
Housing units in structures - 10 to 19 (%)
Housing units in structures - 20 to 49 (%)
Housing units in structures - 50 or more (%)
Housing units in structures - Mobile home (%)
Housing units in structures - Boat, RV, van, etc. (%)
House/condo owner moved in on average (years ago)
Renter moved in on average (years ago)
Year householder moved into unit - Moved in 1999 to March 2000 (%)
Year householder moved into unit - Moved in 1995 to 1998 (%)
Year householder moved into unit - Moved in 1990 to 1994 (%)
Year householder moved into unit - Moved in 1980 to 1989 (%)
Year householder moved into unit - Moved in 1970 to 1979 (%)
Year householder moved into unit - Moved in 1969 or earlier (%)
Means of transportation to work - Drove car alone (%)
Means of transportation to work - Carpooled (%)
Means of transportation to work - Public transportation (%)
Means of transportation to work - Bus or trolley bus (%)
Means of transportation to work - Streetcar or trolley car (%)
Means of transportation to work - Subway or elevated (%)
Means of transportation to work - Railroad (%)
Means of transportation to work - Ferryboat (%)
Means of transportation to work - Taxicab (%)
Means of transportation to work - Motorcycle (%)
Means of transportation to work - Bicycle (%)
Means of transportation to work - Walked (%)
Means of transportation to work - Other means (%)
Working at home (%)
Industry diversity
Most Common Industries - Agriculture, forestry, fishing and hunting, and mining (%)
Most Common Industries - Agriculture, forestry, fishing and hunting (%)
Most Common Industries - Mining, quarrying, and oil and gas extraction (%)
Most Common Industries - Construction (%)
Most Common Industries - Manufacturing (%)
Most Common Industries - Wholesale trade (%)
Most Common Industries - Retail trade (%)
Most Common Industries - Transportation and warehousing, and utilities (%)
Most Common Industries - Transportation and warehousing (%)
Most Common Industries - Utilities (%)
Most Common Industries - Information (%)
Most Common Industries - Finance and insurance, and real estate and rental and leasing (%)
Most Common Industries - Finance and insurance (%)
Most Common Industries - Real estate and rental and leasing (%)
Most Common Industries - Professional, scientific, and management, and administrative and waste management services (%)
Most Common Industries - Professional, scientific, and technical services (%)
Most Common Industries - Management of companies and enterprises (%)
Most Common Industries - Administrative and support and waste management services (%)
Most Common Industries - Educational services, and health care and social assistance (%)
Most Common Industries - Educational services (%)
Most Common Industries - Health care and social assistance (%)
Most Common Industries - Arts, entertainment, and recreation, and accommodation and food services (%)
Most Common Industries - Arts, entertainment, and recreation (%)
Most Common Industries - Accommodation and food services (%)
Most Common Industries - Other services, except public administration (%)
Most Common Industries - Public administration (%)
Occupation diversity
Most Common Occupations - Management, business, science, and arts occupations (%)
Most Common Occupations - Management, business, and financial occupations (%)
Most Common Occupations - Management occupations (%)
Most Common Occupations - Business and financial operations occupations (%)
Most Common Occupations - Computer, engineering, and science occupations (%)
Most Common Occupations - Computer and mathematical occupations (%)
Most Common Occupations - Architecture and engineering occupations (%)
Most Common Occupations - Life, physical, and social science occupations (%)
Most Common Occupations - Education, legal, community service, arts, and media occupations (%)
Most Common Occupations - Community and social service occupations (%)
Most Common Occupations - Legal occupations (%)
Most Common Occupations - Education, training, and library occupations (%)
Most Common Occupations - Arts, design, entertainment, sports, and media occupations (%)
Most Common Occupations - Healthcare practitioners and technical occupations (%)
Most Common Occupations - Health diagnosing and treating practitioners and other technical occupations (%)
Most Common Occupations - Health technologists and technicians (%)
Most Common Occupations - Service occupations (%)
Most Common Occupations - Healthcare support occupations (%)
Most Common Occupations - Protective service occupations (%)
Most Common Occupations - Fire fighting and prevention, and other protective service workers including supervisors (%)
Most Common Occupations - Law enforcement workers including supervisors (%)
Most Common Occupations - Food preparation and serving related occupations (%)
Most Common Occupations - Building and grounds cleaning and maintenance occupations (%)
Most Common Occupations - Personal care and service occupations (%)
Most Common Occupations - Sales and office occupations (%)
Most Common Occupations - Sales and related occupations (%)
Most Common Occupations - Office and administrative support occupations (%)
Most Common Occupations - Natural resources, construction, and maintenance occupations (%)
Most Common Occupations - Farming, fishing, and forestry occupations (%)
Most Common Occupations - Construction and extraction occupations (%)
Most Common Occupations - Installation, maintenance, and repair occupations (%)
Most Common Occupations - Production, transportation, and material moving occupations (%)
Most Common Occupations - Production occupations (%)
Most Common Occupations - Transportation occupations (%)
Most Common Occupations - Material moving occupations (%)
People in Group quarters - Institutionalized population (%)
People in Group quarters - Correctional institutions (%)
People in Group quarters - Federal prisons and detention centers (%)
People in Group quarters - Halfway houses (%)
People in Group quarters - Local jails and other confinement facilities (including police lockups) (%)
People in Group quarters - Military disciplinary barracks (%)
People in Group quarters - State prisons (%)
People in Group quarters - Other types of correctional institutions (%)
People in Group quarters - Nursing homes (%)
People in Group quarters - Hospitals/wards, hospices, and schools for the handicapped (%)
People in Group quarters - Hospitals/wards and hospices for chronically ill (%)
People in Group quarters - Hospices or homes for chronically ill (%)
People in Group quarters - Military hospitals or wards for chronically ill (%)
People in Group quarters - Other hospitals or wards for chronically ill (%)
People in Group quarters - Hospitals or wards for drug/alcohol abuse (%)
People in Group quarters - Mental (Psychiatric) hospitals or wards (%)
People in Group quarters - Schools, hospitals, or wards for the mentally retarded (%)
People in Group quarters - Schools, hospitals, or wards for the physically handicapped (%)
People in Group quarters - Institutions for the deaf (%)
People in Group quarters - Institutions for the blind (%)
People in Group quarters - Orthopedic wards and institutions for the physically handicapped (%)
People in Group quarters - Wards in general hospitals for patients who have no usual home elsewhere (%)
People in Group quarters - Wards in military hospitals for patients who have no usual home elsewhere (%)
People in Group quarters - Juvenile institutions (%)
People in Group quarters - Long-term care (%)
People in Group quarters - Homes for abused, dependent, and neglected children (%)
People in Group quarters - Residential treatment centers for emotionally disturbed children (%)
People in Group quarters - Training schools for juvenile delinquents (%)
People in Group quarters - Short-term care, detention or diagnostic centers for delinquent children (%)
People in Group quarters - Type of juvenile institution unknown (%)
People in Group quarters - Noninstitutionalized population (%)
People in Group quarters - College dormitories (includes college quarters off campus) (%)
People in Group quarters - Military quarters (%)
People in Group quarters - On base (%)
People in Group quarters - Barracks, unaccompanied personnel housing (UPH), (Enlisted/Officer), ;and similar group living quarters for military personnel (%)
People in Group quarters - Transient quarters for temporary residents (%)
People in Group quarters - Military ships (%)
People in Group quarters - Group homes (%)
People in Group quarters - Homes or halfway houses for drug/alcohol abuse (%)
People in Group quarters - Homes for the mentally ill (%)
People in Group quarters - Homes for the mentally retarded (%)
People in Group quarters - Homes for the physically handicapped (%)
People in Group quarters - Other group homes (%)
People in Group quarters - Religious group quarters (%)
People in Group quarters - Dormitories (%)
People in Group quarters - Agriculture workers' dormitories on farms (%)
People in Group quarters - Job Corps and vocational training facilities (%)
People in Group quarters - Other workers' dormitories (%)
People in Group quarters - Crews of maritime vessels (%)
People in Group quarters - Other nonhousehold living situations (%)
People in Group quarters - Other noninstitutional group quarters (%)
Residents speaking English at home (%)
Residents speaking English at home - Born in the United States (%)
Residents speaking English at home - Native, born elsewhere (%)
Residents speaking English at home - Foreign born (%)
Residents speaking Spanish at home (%)
Residents speaking Spanish at home - Born in the United States (%)
Residents speaking Spanish at home - Native, born elsewhere (%)
Residents speaking Spanish at home - Foreign born (%)
Residents speaking other language at home (%)
Residents speaking other language at home - Born in the United States (%)
Residents speaking other language at home - Native, born elsewhere (%)
Residents speaking other language at home - Foreign born (%)
Class of Workers - Employee of private company (%)
Class of Workers - Self-employed in own incorporated business (%)
Class of Workers - Private not-for-profit wage and salary workers (%)
Class of Workers - Local government workers (%)
Class of Workers - State government workers (%)
Class of Workers - Federal government workers (%)
Class of Workers - Self-employed workers in own not incorporated business and Unpaid family workers (%)
House heating fuel used in houses and condos - Utility gas (%)
House heating fuel used in houses and condos - Bottled, tank, or LP gas (%)
House heating fuel used in houses and condos - Electricity (%)
House heating fuel used in houses and condos - Fuel oil, kerosene, etc. (%)
House heating fuel used in houses and condos - Coal or coke (%)
House heating fuel used in houses and condos - Wood (%)
House heating fuel used in houses and condos - Solar energy (%)
House heating fuel used in houses and condos - Other fuel (%)
House heating fuel used in houses and condos - No fuel used (%)
House heating fuel used in apartments - Utility gas (%)
House heating fuel used in apartments - Bottled, tank, or LP gas (%)
House heating fuel used in apartments - Electricity (%)
House heating fuel used in apartments - Fuel oil, kerosene, etc. (%)
House heating fuel used in apartments - Coal or coke (%)
House heating fuel used in apartments - Wood (%)
House heating fuel used in apartments - Solar energy (%)
House heating fuel used in apartments - Other fuel (%)
House heating fuel used in apartments - No fuel used (%)
Armed forces status - In Armed Forces (%)
Armed forces status - Civilian (%)
Armed forces status - Civilian - Veteran (%)
Armed forces status - Civilian - Nonveteran (%)
Fatal accidents locations in years 2005-2021
Fatal accidents locations in 2005
Fatal accidents locations in 2006
Fatal accidents locations in 2007
Fatal accidents locations in 2008
Fatal accidents locations in 2009
Fatal accidents locations in 2010
Fatal accidents locations in 2011
Fatal accidents locations in 2012
Fatal accidents locations in 2013
Fatal accidents locations in 2014
Fatal accidents locations in 2015
Fatal accidents locations in 2016
Fatal accidents locations in 2017
Fatal accidents locations in 2018
Fatal accidents locations in 2019
Fatal accidents locations in 2020
Fatal accidents locations in 2021
Alcohol use - People drinking some alcohol every month (%)
Alcohol use - People not drinking at all (%)
Alcohol use - Average days/month drinking alcohol
Alcohol use - Average drinks/week
Alcohol use - Average days/year people drink much
Audiometry - Average condition of hearing (%)
Audiometry - People that can hear a whisper from across a quiet room (%)
Audiometry - People that can hear normal voice from across a quiet room (%)
Audiometry - Ears ringing, roaring, buzzing (%)
Audiometry - Had a job exposure to loud noise (%)
Audiometry - Had off-work exposure to loud noise (%)
Blood Pressure & Cholesterol - Has high blood pressure (%)
Blood Pressure & Cholesterol - Checking blood pressure at home (%)
Blood Pressure & Cholesterol - Frequently checking blood cholesterol (%)
Blood Pressure & Cholesterol - Has high cholesterol level (%)
Consumer Behavior - Money monthly spent on food at supermarket/grocery store
Consumer Behavior - Money monthly spent on food at other stores
Consumer Behavior - Money monthly spent on eating out
Consumer Behavior - Money monthly spent on carryout/delivered foods
Consumer Behavior - Income spent on food at supermarket/grocery store (%)
Consumer Behavior - Income spent on food at other stores (%)
Consumer Behavior - Income spent on eating out (%)
Consumer Behavior - Income spent on carryout/delivered foods (%)
Current Health Status - General health condition (%)
Current Health Status - Blood donors (%)
Current Health Status - Has blood ever tested for HIV virus (%)
Current Health Status - Left-handed people (%)
Dermatology - People using sunscreen (%)
Diabetes - Diabetics (%)
Diabetes - Had a blood test for high blood sugar (%)
Diabetes - People taking insulin (%)
Diet Behavior & Nutrition - Diet health (%)
Diet Behavior & Nutrition - Milk product consumption (# of products/month)
Diet Behavior & Nutrition - Meals not home prepared (#/week)
Diet Behavior & Nutrition - Meals from fast food or pizza place (#/week)
Diet Behavior & Nutrition - Ready-to-eat foods (#/month)
Diet Behavior & Nutrition - Frozen meals/pizza (#/month)
Drug Use - People that ever used marijuana or hashish (%)
Drug Use - Ever used hard drugs (%)
Drug Use - Ever used any form of cocaine (%)
Drug Use - Ever used heroin (%)
Drug Use - Ever used methamphetamine (%)
Health Insurance - People covered by health insurance (%)
Kidney Conditions-Urology - Avg. # of times urinating at night
Medical Conditions - People with asthma (%)
Medical Conditions - People with anemia (%)
Medical Conditions - People with psoriasis (%)
Medical Conditions - People with overweight (%)
Medical Conditions - Elderly people having difficulties in thinking or remembering (%)
Medical Conditions - People who ever received blood transfusion (%)
Medical Conditions - People having trouble seeing even with glass/contacts (%)
Medical Conditions - People with arthritis (%)
Medical Conditions - People with gout (%)
Medical Conditions - People with congestive heart failure (%)
Medical Conditions - People with coronary heart disease (%)
Medical Conditions - People with angina pectoris (%)
Medical Conditions - People who ever had heart attack (%)
Medical Conditions - People who ever had stroke (%)
Medical Conditions - People with emphysema (%)
Medical Conditions - People with thyroid problem (%)
Medical Conditions - People with chronic bronchitis (%)
Medical Conditions - People with any liver condition (%)
Medical Conditions - People who ever had cancer or malignancy (%)
Mental Health - People who have little interest in doing things (%)
Mental Health - People feeling down, depressed, or hopeless (%)
Mental Health - People who have trouble sleeping or sleeping too much (%)
Mental Health - People feeling tired or having little energy (%)
Mental Health - People with poor appetite or overeating (%)
Mental Health - People feeling bad about themself (%)
Mental Health - People who have trouble concentrating on things (%)
Mental Health - People moving or speaking slowly or too fast (%)
Mental Health - People having thoughts they would be better off dead (%)
Oral Health - Average years since last visit a dentist
Oral Health - People embarrassed because of mouth (%)
Oral Health - People with gum disease (%)
Oral Health - General health of teeth and gums (%)
Oral Health - Average days a week using dental floss/device
Oral Health - Average days a week using mouthwash for dental problem
Oral Health - Average number of teeth
Pesticide Use - Households using pesticides to control insects (%)
Pesticide Use - Households using pesticides to kill weeds (%)
Physical Activity - People doing vigorous-intensity work activities (%)
Physical Activity - People doing moderate-intensity work activities (%)
Physical Activity - People walking or bicycling (%)
Physical Activity - People doing vigorous-intensity recreational activities (%)
Physical Activity - People doing moderate-intensity recreational activities (%)
Physical Activity - Average hours a day doing sedentary activities
Physical Activity - Average hours a day watching TV or videos
Physical Activity - Average hours a day using computer
Physical Functioning - People having limitations keeping them from working (%)
Physical Functioning - People limited in amount of work they can do (%)
Physical Functioning - People that need special equipment to walk (%)
Physical Functioning - People experiencing confusion/memory problems (%)
Physical Functioning - People requiring special healthcare equipment (%)
Prescription Medications - Average number of prescription medicines taking
Preventive Aspirin Use - Adults 40+ taking low-dose aspirin (%)
Reproductive Health - Vaginal deliveries (%)
Reproductive Health - Cesarean deliveries (%)
Reproductive Health - Deliveries resulted in a live birth (%)
Reproductive Health - Pregnancies resulted in a delivery (%)
Reproductive Health - Women breastfeeding newborns (%)
Reproductive Health - Women that had a hysterectomy (%)
Reproductive Health - Women that had both ovaries removed (%)
Reproductive Health - Women that have ever taken birth control pills (%)
Reproductive Health - Women taking birth control pills (%)
Reproductive Health - Women that have ever used Depo-Provera or injectables (%)
Reproductive Health - Women that have ever used female hormones (%)
Sexual Behavior - People 18+ that ever had sex (vaginal, anal, or oral) (%)
Sexual Behavior - Males 18+ that ever had vaginal sex with a woman (%)
Sexual Behavior - Males 18+ that ever performed oral sex on a woman (%)
Sexual Behavior - Males 18+ that ever had anal sex with a woman (%)
Sexual Behavior - Males 18+ that ever had any sex with a man (%)
Sexual Behavior - Females 18+ that ever had vaginal sex with a man (%)
Sexual Behavior - Females 18+ that ever performed oral sex on a man (%)
Sexual Behavior - Females 18+ that ever had anal sex with a man (%)
Sexual Behavior - Females 18+ that ever had any kind of sex with a woman (%)
Sexual Behavior - Average age people first had sex
Sexual Behavior - Average number of female sex partners in lifetime (males 18+)
Sexual Behavior - Average number of female vaginal sex partners in lifetime (males 18+)
Sexual Behavior - Average age people first performed oral sex on a woman (18+)
Sexual Behavior - Average number of woman performed oral sex on in lifetime (18+)
Sexual Behavior - Average number of male sex partners in lifetime (males 18+)
Sexual Behavior - Average number of male anal sex partners in lifetime (males 18+)
Sexual Behavior - Average age people first performed oral sex on a man (18+)
Sexual Behavior - Average number of male oral sex partners in lifetime (18+)
Sexual Behavior - People using protection when performing oral sex (%)
Sexual Behavior - Average number of times people have vaginal or anal sex a year
Sexual Behavior - People having sex without condom (%)
Sexual Behavior - Average number of male sex partners in lifetime (females 18+)
Sexual Behavior - Average number of male vaginal sex partners in lifetime (females 18+)
Sexual Behavior - Average number of female sex partners in lifetime (females 18+)
Sexual Behavior - Circumcised males 18+ (%)
Sleep Disorders - Average hours sleeping at night
Sleep Disorders - People that has trouble sleeping (%)
Smoking-Cigarette Use - People smoking cigarettes (%)
Taste & Smell - People 40+ having problems with smell (%)
Taste & Smell - People 40+ having problems with taste (%)
Taste & Smell - People 40+ that ever had wisdom teeth removed (%)
Taste & Smell - People 40+ that ever had tonsils teeth removed (%)
Taste & Smell - People 40+ that ever had a loss of consciousness because of a head injury (%)
Taste & Smell - People 40+ that ever had a broken nose or other serious injury to face or skull (%)
Taste & Smell - People 40+ that ever had two or more sinus infections (%)
Weight - Average height (inches)
Weight - Average weight (pounds)
Weight - Average BMI
Weight - People that are obese (%)
Weight - People that ever were obese (%)
Weight - People trying to lose weight (%)
Urban population: 37,069
Rural population: 312
Estimated median house/condo value in 2022: $134,691
78242:
$134,691Texas:
$275,400
According to our research of Texas and other state lists, there were 91 registered sex offenders living in 78242 zip code as of May 17, 2024 . The ratio of all residents to sex offenders in zip code 78242 is 369 to 1.The ratio of registered sex offenders to all residents in this zip code is near the state average.
Median resident age: This zip code:
28.1 yearsTexas median age:
35.6 years
Average household size: This zip code:
3.3 peopleTexas:
2.6 people
Averages for the 2020 tax year for zip code 78242, filed in 2021:
Average Adjusted Gross Income (AGI) in 2020: $31,885 (Individual Income Tax Returns) Here:
$31,885State:
$77,054
Salary/wage: $30,786 (reported on 83.8% of returns )Here:
$30,786State:
$62,766
(% of AGI for various income ranges: 1153.2% for AGIs below $25k , 3522.6% for AGIs $25k-50k , 6153.4% for AGIs $50k-75k , 8720.7% for AGIs $75k-100k , 15130.0% for AGIs $100k-200k ) Taxable interest for individuals: $691 (reported on 7.5% of returns )This zip code:
$691Texas:
$2,665
(% of AGI for various income ranges: 2.0% for AGIs below $25k , 4.3% for AGIs $25k-50k , 12.4% for AGIs $50k-75k , 31.6% for AGIs $75k-100k , 67.5% for AGIs $100k-200k ) Ordinary dividends: $610 (reported on 2.0% of returns )(% of AGI for various income ranges: 0.4% for AGIs below $25k , 1.3% for AGIs $25k-50k , 2.4% for AGIs $50k-75k , 4.5% for AGIs $75k-100k , 22.0% for AGIs $100k-200k ) Net capital gain/loss in AGI: +$6,739 (reported on 2.1% of returns )Here:
+$6,739State:
+$39,590
(% of AGI for various income ranges: 1.6% for AGIs below $25k , 2.0% for AGIs $25k-50k , 17.6% for AGIs $50k-75k , 88.2% for AGIs $75k-100k , 637.0% for AGIs $100k-200k ) Profit/loss from business: +$6,357 (reported on 19.7% of returns )Here:
+$6,357State:
+$10,888
(% of AGI for various income ranges: 209.4% for AGIs below $25k , 77.4% for AGIs $25k-50k , 77.6% for AGIs $50k-75k , 155.9% for AGIs $75k-100k , 537.0% for AGIs $100k-200k ) Taxable individual retirement arrangement distribution: $10,090 (reported on 2.1% of returns )78242:
$10,090Texas:
$24,740
(% of AGI for various income ranges: 7.9% for AGIs below $25k , 16.8% for AGIs $25k-50k , 62.5% for AGIs $50k-75k , 87.3% for AGIs $75k-100k , 340.0% for AGIs $100k-200k ) Total itemized deductions: $27,468 (reported on 1.7% of returns )Here:
$27,468State:
$40,428
(% of AGI for various income ranges: 7.0% for AGIs below $25k , 67.8% for AGIs $25k-50k , 151.2% for AGIs $50k-75k , 318.6% for AGIs $75k-100k ) Charity contributions: $7,367 (reported on 1.2% of returns )(% of AGI for various income ranges: 14.6% for AGIs $25k-50k , 27.8% for AGIs $50k-75k , 69.1% for AGIs $75k-100k ) Taxes paid: $5,679 (reported on 1.7% of returns )(% of AGI for various income ranges: 0.9% for AGIs below $25k , 14.9% for AGIs $25k-50k , 28.1% for AGIs $50k-75k , 61.1% for AGIs $75k-100k ) Earned income credit: $2,931 (reported on 36.2% of returns )(% of AGI for various income ranges: 185.2% for AGIs below $25k , 110.7% for AGIs $25k-50k , 2.6% for AGIs $50k-75k ) Percentage of individuals using paid preparers for their 2020 taxes: 92.0%(% for various income ranges: 91.0% for AGIs below $25k , 93.5% for AGIs $25k-50k , 93.0% for AGIs $50k-75k , 91.1% for AGIs $75k-100k , 87.9% for AGIs $100k-200k )
Averages for the 2012 tax year for zip code 78242, filed in 2013:
Average Adjusted Gross Income (AGI) in 2012: $26,571 (Individual Income Tax Returns) Here:
$26,571State:
$65,384
Salary/wage: $25,366 (reported on 86.0% of returns )Here:
$25,366State:
$52,524
(% of AGI for various income ranges: 77.8% for AGIs below $25k , 88.3% for AGIs $25k-50k , 81.8% for AGIs $50k-75k , 80.7% for AGIs $75k-100k , 65.3% for AGIs $100k-200k ) Taxable interest for individuals: $732 (reported on 8.1% of returns )This zip code:
$732Texas:
$2,372
(% of AGI for various income ranges: 0.1% for AGIs below $25k , 0.2% for AGIs $25k-50k , 0.4% for AGIs $50k-75k , 0.3% for AGIs $75k-100k , 0.3% for AGIs $100k-200k ) Ordinary dividends: $1,857 (reported on 2.3% of returns )(% of AGI for various income ranges: 0.3% for AGIs below $25k , 0.1% for AGIs $25k-50k , 0.1% for AGIs $50k-75k ) Net capital gain/loss in AGI: +$1,775 (reported on 1.3% of returns )Here:
+$1,775State:
+$35,319
(% of AGI for various income ranges: 0.3% for AGIs $50k-75k , 0.2% for AGIs $75k-100k ) Profit/loss from business: +$8,744 (reported on 16.9% of returns )Here:
+$8,744State:
+$13,732
(% of AGI for various income ranges: 14.6% for AGIs below $25k , 1.9% for AGIs $25k-50k , 0.7% for AGIs $50k-75k , 4.2% for AGIs $75k-100k ) Taxable individual retirement arrangement distribution: $6,953 (reported on 2.9% of returns )78242:
$6,953Texas:
$19,511
(% of AGI for various income ranges: 0.5% for AGIs below $25k , 0.6% for AGIs $25k-50k , 1.1% for AGIs $50k-75k , 2.4% for AGIs $75k-100k ) Total itemized deductions: $16,441 (34% of AGI, reported on 6.5% of returns )Here:
$16,441State:
$24,724
Here:
33.7% of AGIState:
15.9% of AGI
(% of AGI for various income ranges: 1.6% for AGIs below $25k , 4.4% for AGIs $25k-50k , 6.3% for AGIs $50k-75k , 5.6% for AGIs $75k-100k , 4.4% for AGIs $100k-200k ) Charity contributions: $2,675 (reported on 4.2% of returns )(% of AGI for various income ranges: 0.4% for AGIs $25k-50k , 0.7% for AGIs $50k-75k , 0.8% for AGIs $75k-100k , 0.6% for AGIs $100k-200k ) Taxes paid: $3,415 (reported on 6.1% of returns )(% of AGI for various income ranges: 0.3% for AGIs below $25k , 0.8% for AGIs $25k-50k , 1.4% for AGIs $50k-75k , 1.1% for AGIs $75k-100k , 0.8% for AGIs $100k-200k ) Earned income credit: $2,957 (reported on 45.2% of returns )(% of AGI for various income ranges: 13.6% for AGIs below $25k , 2.6% for AGIs $25k-50k ) Percentage of individuals using paid preparers for their 2012 taxes: 50.6%(% for various income ranges: 51.9% for AGIs below $25k , 47.9% for AGIs $25k-50k , 51.5% for AGIs $50k-75k , 51.5% for AGIs $75k-100k , 42.9% for AGIs $100k-200k )
Averages for the 2004 tax year for zip code 78242, filed in 2005:
Average Adjusted Gross Income (AGI) in 2004: $21,959 (Individual Income Tax Returns) Here:
$21,959State:
$47,881
Salary/wage: $20,909 (reported on 87.5% of returns )Here:
$20,909State:
$41,947
(% of AGI for various income ranges: 83.3% for AGIs below $10k , 84.1% for AGIs $10k-25k , 86.5% for AGIs $25k-50k , 79.8% for AGIs $50k-75k , 73.2% for AGIs $75k-100k , 63.5% for AGIs over 100k ) Taxable interest for individuals: $895 (reported on 12.2% of returns )This zip code:
$895Texas:
$2,255
(% of AGI for various income ranges: 0.5% for AGIs below $10k , 0.3% for AGIs $10k-25k , 0.5% for AGIs $25k-50k , 0.8% for AGIs $50k-75k , 0.6% for AGIs $75k-100k , 0.6% for AGIs over 100k ) Taxable dividends: $477 (reported on 3.4% of returns )(% of AGI for various income ranges: 0.2% for AGIs below $10k , 0.1% for AGIs $10k-25k , 0.0% for AGIs $25k-50k , 0.1% for AGIs $50k-75k , 0.1% for AGIs $75k-100k ) Net capital gain/loss: +$1,206 (reported on 2.1% of returns )Here:
+$1,206State:
+$16,110
(% of AGI for various income ranges: -0.1% for AGIs below $10k , 0.0% for AGIs $10k-25k , 0.1% for AGIs $25k-50k , 0.3% for AGIs $50k-75k , 1.1% for AGIs $75k-100k ) Profit/loss from business: +$7,677 (reported on 13.2% of returns )Here:
+$7,677State:
+$11,013
(% of AGI for various income ranges: 12.5% for AGIs below $10k , 8.2% for AGIs $10k-25k , 2.2% for AGIs $25k-50k , 0.5% for AGIs $50k-75k , 4.3% for AGIs $75k-100k ) IRA payment deduction: $2,349 (reported on 0.6% of returns )Total itemized deductions: $13,189 (31% of AGI, reported on 3.7% of returns )Here:
$13,189State:
$19,631
Here:
30.7% of AGIState:
18.9% of AGI
(% of AGI for various income ranges: 1.0% for AGIs below $10k , 1.2% for AGIs $10k-25k , 2.3% for AGIs $25k-50k , 2.9% for AGIs $50k-75k , 4.0% for AGIs $75k-100k , 10.7% for AGIs over 100k ) Charity contributions deductions: $2,945 (6% of AGI, reported on 2.7% of returns )Here:
6.4% of AGIState:
4.2% of AGI
(% of AGI for various income ranges: 0.1% for AGIs $10k-25k , 0.4% for AGIs $25k-50k , 0.6% for AGIs $50k-75k , 1.0% for AGIs $75k-100k , 1.8% for AGIs over 100k ) Total tax: $2,206 (reported on 52.8% of returns )(% of AGI for various income ranges: 2.8% for AGIs below $10k , 3.0% for AGIs $10k-25k , 5.0% for AGIs $25k-50k , 8.5% for AGIs $50k-75k , 11.4% for AGIs $75k-100k , 15.6% for AGIs over 100k ) Earned income credit: $2,249 (reported on 46.8% of returns )Percentage of individuals using paid preparers for their 2004 taxes: 65.1%(% for various income ranges: 63.3% for AGIs below $10k , 70.6% for AGIs $10k-25k , 61.6% for AGIs $25k-50k , 52.5% for AGIs $50k-75k , 48.9% for AGIs $75k-100k , 51.2% for AGIs over 100k )
Estimated median household income in 2022: This zip code:
$45,120Texas:
$72,284
Nearest zip codes: 78243 ,
78211 ,
78236 ,
78226 ,
78227 ,
78237 .
San Antonio Zip Code Map
Percentage of family households: This zip code:
57.2%Texas:
50.5%
Percentage of households with unmarried partners: This zip code:
5.6%Texas:
48.7%
Likely homosexual households (counted as self-reported same-sex unmarried-partner households)
Lesbian couples: 0.3% of all households Gay men: 0.0% of all households
Household received Food Stamps/SNAP in the past 12 months: 3,670Household did not receive Food Stamps/SNAP in the past 12 months: 7,649
Women who had a birth in the past 12 months: 542 (318 now married , 221 unmarried) Women who did not have a birth in the past 12 months: 9,350 (3,474 now married , 5,896 unmarried)
Housing units in zip code 78242 with a mortgage: 2,896 (116
second mortgage , 112
both second mortgage and home equity loan )
Houses without a mortgage: 109
Median monthly owner costs for units with a mortgage: $1,228
Median monthly owner costs for units without a mortgage: $428
Residents with income below the poverty level in 2022:
This zip code:
28.0%Whole state:
14.0%
Residents with income below 50% of the poverty level in 2022:
This zip code:
13.3%Whole state:
7.4%
Median number of rooms in houses and condos: Median number of rooms in apartments:
Year house built (houses)
66 2020 or later2,030 2010 to 20191,363 2000 to 2009545 1990 to 19991,312 1980 to 19892,692 1970 to 19792,330 1960 to 1969793 1950 to 1959106 1940 to 1949109 1939 or earlier
Zip code 78242 household income distribution in 2022 1,079 Less than $10,000858 $10,000 to $14,999406 $15,000 to $19,999634 $20,000 to $24,999946 $25,000 to $29,999531 $30,000 to $34,999553 $35,000 to $39,999525 $40,000 to $44,999662 $45,000 to $49,9991,146 $50,000 to $59,9991,235 $60,000 to $74,9991,364 $75,000 to $99,999735 $100,000 to $124,999217 $125,000 to $149,999263 $150,000 to $199,99978 $200,000 or moreEstimate of home value of owner-occupied houses/condos in 2022 in zip code 78242 110 Less than $10,000102 $10,000 to $14,99912 $15,000 to $19,99927 $20,000 to $24,99914 $30,000 to $34,99926 $35,000 to $39,999286 $40,000 to $49,999143 $50,000 to $59,999113 $60,000 to $69,999344 $70,000 to $79,999316 $80,000 to $89,999340 $90,000 to $99,999760 $100,000 to $124,999675 $125,000 to $149,999447 $150,000 to $174,999325 $175,000 to $199,999357 $200,000 to $249,999168 $250,000 to $299,99940 $300,000 to $399,99911 $400,000 to $499,9995 $500,000 to $749,99941 $750,000 to $999,999Rent paid by renters in 2022 in zip code 78242 44 Less than $10059 $100 to $14993 $150 to $19931 $200 to $24919 $250 to $299116 $300 to $349115 $400 to $44910 $450 to $49919 $500 to $54948 $550 to $599261 $600 to $649295 $650 to $699492 $700 to $749328 $750 to $7991,034 $800 to $899667 $900 to $999804 $1,000 to $1,249390 $1,250 to $1,499231 $1,500 to $1,9996 $2,000 to $2,499168 No cash rent
Median gross rent in 2022: $1,146.
Median price asked for vacant for-sale houses and condos in 2022: $128,607.
Estimated median house (or condo) value in 2022 for: White Non-Hispanic householders: $160,881Black or African American householders: $131,885American Indian or Alaska Native householders: $154,022Asian householders: $166,805Some other race householders: $129,702Two or more races householders: $131,885Hispanic or Latino householders: $133,756Estimated median house or condo value in 2022: $134,691
78242:
$134,691Texas:
$275,400
Lower value quartile - upper value quartile: $96,962 - $176,039
Mean price in 2022: Detached houses: $257,450Here:
$257,450State:
$369,058
Townhouses or other attached units: $278,164Here:
$278,164State:
$327,631
In 2-unit structures: $323,201Here:
$323,201State:
$374,947
In 3-to-4-unit structures: $186,623Here:
$186,623State:
$209,652
In 5-or-more-unit structures: $209,743Here:
$209,743State:
$413,944
Mobile homes: $81,302Here:
$81,302State:
$124,413
Occupied boats, RVs, vans, etc.: $105,053Here:
$105,053State:
$73,921
Housing units in structures:
One, detached: 8,192One, attached: 347Two: 1473 or 4: 6395 to 9: 37810 to 19: 80520 to 49: 11250 or more: 337Mobile homes: 698Unemployment : 10.6%
Means of transportation to work in zip code 78242 65.8% 9,118 Drove a car alone23.7% 3,289 Carpooled0.8% 117 Bus or trolley bus0.1% 12 Bicycle0.5% 66 Walked2.1% 289 Other means5.6% 770 Worked at homeTravel time to work (commute) in zip code 78242 113 Less than 5 minutes634 5 to 9 minutes1,357 10 to 14 minutes1,607 15 to 19 minutes1,997 20 to 24 minutes1,133 25 to 29 minutes2,490 30 to 34 minutes424 35 to 39 minutes359 40 to 44 minutes1,316 45 to 59 minutes802 60 to 89 minutes507 90 or more minutes
Percentage of zip code residents living and working in this county: 94.7%
Household type by relationship:
Households: 37,382
Male householders: 5,056 (1,279 living alone ), Female householders: 6,162 (1,035 living alone )4,665 spouses (4,653 opposite-sex spouses ), 1,322 unmarried partners , (1,315 opposite-sex unmarried partners ), 14,672 children (13,616 natural , 372 adopted , 685 stepchildren ), 2,570 grandchildren , 707 brothers or sisters , 394 parents , 0 foster children , 1,260 other relatives , 481 non-relatives In group quarters: 14 (-1 institutionalized population )
Size of family households: 2,039 2-persons , 2,101 3-persons , 1,607 4-persons , 1,500 5-persons , 620 6-persons , 615 7-or-more-persons
Size of nonfamily households: 2,314 1-person , 288 2-persons , 12 3-persons , 7 4-persons , 16 5-persons
5,621 married couples with children. single-parent households (1,261 men , 3,116 women ).
40.8% of residents of 78242 zip code speak English at home. of residents speak Spanish at home (63% very well, 14% well, 11% not well, 12% not at all ).of residents speak other Indo-European language at home (12% very well, 65% well, 23% not well ).of residents speak Asian or Pacific Island language at home (98% very well, 2% well ).
Foreign born population: 7,242 (19.4%)
(33.2%
of them are naturalized citizens )
This zip code:
19.4%Whole state:
17.2%
85% Honduras 10% Guatemala 1% Nepal 0% Azores Islands 0% Malaysia 0% Thailand 0% Romania 5% American 1% Irish 1% German 0% English 0% Italian 0% European 0% Polish
Year of entry for the foreign-born population
2,154 2010 or later 1,686 2000 to 2009 1,402 1990 to 1999 2,396 Before 1990
There are
5 Medical Specialists in Zip Code 78242 .
Facilities with environmental interests located in this zip code:
ALAN B SHEPARD MIDDLE SCHOOL (5558 RAY ELLISON BLVD. SAN ANTONIO in SAN ANTONIO, TX)
(Geographic Names Information System) (National Center for Education Statistics) - STATE ID-015908042 Organizations: SOUTH SAN ANTONIO IS (SCHOOL DISTRICT)
Housing units lacking complete plumbing facilities: 0.7%
Housing units lacking complete kitchen facilities: 1.1%
69.2% Electricity 27.2% Utility gas 1.6% No fuel used 1.6% Solar energy
Population in 1990: 24,343. Population change in the 1990s: +4,443 (+18.3%).
Place of birth for U.S.-born residents:
This state: 25,688Northeast: 276Midwest: 823South: 1,519West: 1,123
60% of the 78242 zip code residents lived in the same house 5 years ago.
Out of people who lived in different houses, 82% lived in this county.
Out of people who lived in different counties, 50% lived in Texas.
91% of the 78242 zip code residents lived in the same house 1 year ago.
Out of people who lived in different houses, 79% moved from this county.
Out of people who lived in different houses, 4% moved from different county within same state.
Out of people who lived in different houses, 12% moved from different state.
Out of people who lived in different houses, 3% moved from abroad.
Private vs. public school enrollment:
Students in private schools in grades 1 to 8 (elementary and middle school): 186
Students in private schools in grades 9 to 12 (high school): 264
Students in private undergraduate colleges: 403
Occupation by median earnings in the past 12 months ($)
120,366 Law enforcement workers including supervisors 58,414 Computer and mathematical occupations 58,271 Health diagnosing and treating practitioners and other technical occupations 42,409 Installation, maintenance, and repair occupations 40,978 Business and financial operations occupations 40,354 Transportation occupations
Companies with federal contracts located in this zip code (SAN ANTONIO, TX):
BURCH, DONALD D. (5903 STONEY CREEK; small business) in 7 contracts from 2000 to 2005
Contracts for Laundry and DryCleaning Services by Air ForceSigned by year: 2000: $280,820; 2001: $153,024; 2002: $180,055; 2003: $180,056; 2004: $0; 2005: $13,989; 2006: $0.
Biggest contracts: with Air Force for Laundry and DryCleaning Services. Signed on 2003-11-25. Completion date: 2004-11-30.
, same as above. Signed on 2002-10-23. Completion date: 2002-10-23.
, same as above. Signed on 2001-11-30. Completion date: 2002-11-30.
, same as above. Signed on 2000-10-25. Completion date: 2001-11-30.
CHEZ-SALIN QUALITY CLEANERS (5414 W MILITARY DR; small business) in 6 contracts from 2002 to 2006
Contracts for Laundry and DryCleaning Services by Air ForceSigned by year: 2000: $0; 2001: $0; 2002: $105,369; 2003: $0; 2004: $21,050; 2005: $10,000; 2006: -$1,413.
Biggest contracts: with Air Force for Laundry and DryCleaning Services. Signed on 2002-07-10. Completion date: 2002-06-17.
, same as above. Signed on 2004-11-01. Completion date: 2005-09-30.
, same as above. Signed on 2005-10-01. Completion date: 2006-09-30.
, same as above. Signed on 2006-04-03. Completion date: 2003-09-30.
IRENE R MYERS (5539 COOL VALLEY ST; small business) in 2 contracts in 2005
$46,110 with Air Force for Draperies, Awnings, and Shades. Signed on 2005-09-21. Completion date: 2005-12-22.
, same as above. Signed on 2005-09-22. Completion date: 2005-12-22.
DAVE'S AC PREVENTIVE MAINTENAN (5923 FIR VALLEY DR; small business)
$20,371 with Army for Maintenance, Repair or Alteration of Real Property -- Other Administrative Facilities and Service Buildings. Signed on 2000-09-27. Completion date: 2000-11-15.
AL''S MINI MOVE (9115 KINGS HARBOR; small business)
$3,583 with Army for Facilities Operations Support Services. Signed on 2003-11-07. Completion date: 2003-11-29.
Top industries in this zip code by the number of employees in 2005:
Accommodation and Food Services: Limited-Service Restaurants (50-99 employees: 2 establishments, 20-49 employees: 2 establishments, 10-19 employees: 1 establishment, 5-9 employees: 1 establishment, 1-4 employees: 2 establishments)Health Care and Social Assistance: Child Day Care Services (20-49: 3, 5-9: 1, 1-4: 3)Other Services (except Public Administration): Religious Organizations (20-49: 1, 10-19: 1, 5-9: 1, 1-4: 1)Accommodation and Food Services: Full-Service Restaurants (10-19: 3, 5-9: 1, 1-4: 2)Construction: Poured Concrete Foundation and Structure Contractors (20-49: 1)Construction: Site Preparation Contractors (10-19: 1, 5-9: 1, 1-4: 1)Accommodation and Food Services: Drinking Places (Alcoholic Beverages) (5-9: 3)
People in group quarters in 2010:
15 people in residential treatment centers for juveniles (non-correctional)
Fatal accident statistics in 2014:
Fatal accident count: 4Vehicles involved in fatal accidents: 4Fatal accidents caused by drunken drivers: 1Fatalities: 5Persons involved in fatal accidents: 9Pedestrians involved in fatal accidents: 3
Fatal accident statistics in 2013:
Fatal accident count: 3Vehicles involved in fatal accidents: 3Fatal accidents caused by drunken drivers: 2Fatalities: 3Persons involved in fatal accidents: 4Pedestrians involved in fatal accidents: 0
Home Mortgage Disclosure Act Aggregated Statistics For Year 2009(Based on 6 full and 4 partial tracts) A) FHA, FSA/RHS & VA B) Conventional C) Refinancings D) Home Improvement Loans F) Non-occupant Loans on G) Loans On Manufactured Number Average Value Number Average Value Number Average Value Number Average Value Number Average Value Number Average Value
LOANS ORIGINATED 243 $104,357 39 $62,945 192 $78,009 41 $25,850 38 $54,241 0 $0 APPLICATIONS APPROVED, NOT ACCEPTED 12 $73,113 9 $58,910 37 $72,736 12 $39,207 6 $47,850 4 $36,948 APPLICATIONS DENIED 84 $108,123 44 $55,675 202 $67,641 132 $21,678 27 $62,139 10 $33,531 APPLICATIONS WITHDRAWN 38 $95,039 6 $61,948 79 $89,144 22 $33,309 6 $69,155 0 $0 FILES CLOSED FOR INCOMPLETENESS 7 $118,056 4 $54,325 13 $82,533 2 $67,000 2 $58,000 0 $0
Aggregated Statistics For Year 2008(Based on 6 full and 4 partial tracts) A) FHA, FSA/RHS & VA B) Conventional C) Refinancings D) Home Improvement Loans E) Loans on Dwellings For 5+ Families F) Non-occupant Loans on G) Loans On Manufactured Number Average Value Number Average Value Number Average Value Number Average Value Number Average Value Number Average Value Number Average Value
LOANS ORIGINATED 304 $113,607 108 $77,423 205 $62,172 85 $25,722 4 $1,643,068 67 $62,590 4 $33,510 APPLICATIONS APPROVED, NOT ACCEPTED 15 $95,981 19 $55,638 59 $76,104 21 $29,900 0 $0 14 $49,795 11 $49,950 APPLICATIONS DENIED 125 $112,541 85 $67,040 393 $66,000 344 $29,312 0 $0 69 $76,920 22 $51,095 APPLICATIONS WITHDRAWN 43 $108,281 33 $68,066 94 $62,425 37 $26,823 0 $0 18 $51,593 0 $0 FILES CLOSED FOR INCOMPLETENESS 29 $116,206 5 $87,666 42 $58,999 6 $29,768 0 $0 10 $61,420 2 $50,700
Aggregated Statistics For Year 2007(Based on 6 full and 4 partial tracts) A) FHA, FSA/RHS & VA B) Conventional C) Refinancings D) Home Improvement Loans E) Loans on Dwellings For 5+ Families F) Non-occupant Loans on G) Loans On Manufactured Number Average Value Number Average Value Number Average Value Number Average Value Number Average Value Number Average Value Number Average Value
LOANS ORIGINATED 251 $118,760 391 $72,258 356 $62,256 123 $29,933 2 $2,676,250 206 $71,569 4 $44,952 APPLICATIONS APPROVED, NOT ACCEPTED 37 $125,060 77 $60,818 76 $64,695 56 $24,982 0 $0 34 $48,395 12 $50,499 APPLICATIONS DENIED 49 $111,934 174 $66,486 655 $62,779 298 $28,353 0 $0 129 $64,167 46 $38,449 APPLICATIONS WITHDRAWN 26 $116,262 66 $82,901 222 $64,668 32 $29,148 0 $0 52 $63,152 2 $39,000 FILES CLOSED FOR INCOMPLETENESS 20 $113,984 28 $91,011 72 $68,528 0 $0 0 $0 7 $44,074 0 $0
Aggregated Statistics For Year 2006(Based on 6 full and 4 partial tracts) A) FHA, FSA/RHS & VA B) Conventional C) Refinancings D) Home Improvement Loans E) Loans on Dwellings For 5+ Families F) Non-occupant Loans on G) Loans On Manufactured Number Average Value Number Average Value Number Average Value Number Average Value Number Average Value Number Average Value Number Average Value
LOANS ORIGINATED 229 $104,210 612 $59,762 349 $52,383 117 $29,211 0 $0 256 $56,916 8 $46,340 APPLICATIONS APPROVED, NOT ACCEPTED 9 $98,600 165 $60,983 70 $56,979 26 $24,506 0 $0 47 $59,213 21 $64,195 APPLICATIONS DENIED 50 $112,840 324 $62,307 598 $54,924 296 $23,679 2 $249,650 116 $57,007 65 $48,447 APPLICATIONS WITHDRAWN 18 $108,044 120 $68,398 363 $59,161 34 $40,316 0 $0 50 $59,149 0 $0 FILES CLOSED FOR INCOMPLETENESS 4 $125,398 20 $75,418 37 $79,269 2 $44,650 0 $0 2 $34,990 0 $0
Aggregated Statistics For Year 2005(Based on 6 full and 4 partial tracts) A) FHA, FSA/RHS & VA B) Conventional C) Refinancings D) Home Improvement Loans F) Non-occupant Loans on G) Loans On Manufactured Number Average Value Number Average Value Number Average Value Number Average Value Number Average Value Number Average Value
LOANS ORIGINATED 171 $79,098 474 $52,863 449 $55,487 103 $48,797 195 $51,323 6 $33,387 APPLICATIONS APPROVED, NOT ACCEPTED 12 $79,208 91 $54,741 97 $45,237 31 $23,401 28 $53,055 13 $41,098 APPLICATIONS DENIED 35 $72,408 303 $52,501 612 $48,714 226 $23,638 98 $45,366 75 $39,068 APPLICATIONS WITHDRAWN 17 $103,256 127 $64,691 324 $70,682 86 $120,365 48 $60,614 6 $38,573 FILES CLOSED FOR INCOMPLETENESS 6 $76,177 16 $55,640 42 $81,938 4 $20,145 8 $54,430 0 $0
Aggregated Statistics For Year 2004(Based on 6 full and 4 partial tracts) A) FHA, FSA/RHS & VA B) Conventional C) Refinancings D) Home Improvement Loans E) Loans on Dwellings For 5+ Families F) Non-occupant Loans on G) Loans On Manufactured Number Average Value Number Average Value Number Average Value Number Average Value Number Average Value Number Average Value Number Average Value
LOANS ORIGINATED 149 $75,727 299 $49,781 551 $47,801 113 $24,296 4 $98,475 163 $44,194 5 $56,028 APPLICATIONS APPROVED, NOT ACCEPTED 8 $77,380 68 $45,791 100 $44,378 40 $22,429 0 $0 20 $45,172 16 $42,309 APPLICATIONS DENIED 25 $76,376 191 $49,175 626 $51,411 231 $20,717 0 $0 71 $41,235 74 $41,063 APPLICATIONS WITHDRAWN 41 $87,879 64 $62,029 325 $51,927 36 $36,348 0 $0 18 $38,646 2 $18,660 FILES CLOSED FOR INCOMPLETENESS 6 $67,602 20 $54,372 82 $62,664 4 $30,358 0 $0 4 $55,865 0 $0
Aggregated Statistics For Year 2003(Based on 6 full and 4 partial tracts) A) FHA, FSA/RHS & VA B) Conventional C) Refinancings D) Home Improvement Loans F) Non-occupant Loans on Number Average Value Number Average Value Number Average Value Number Average Value Number Average Value
LOANS ORIGINATED 149 $66,730 198 $47,104 601 $43,428 46 $13,071 116 $41,798 APPLICATIONS APPROVED, NOT ACCEPTED 2 $46,260 42 $40,242 85 $40,171 2 $5,310 19 $33,401 APPLICATIONS DENIED 38 $59,024 137 $48,835 641 $41,869 141 $15,517 54 $40,869 APPLICATIONS WITHDRAWN 25 $61,492 23 $65,805 329 $47,856 11 $28,622 31 $46,806 FILES CLOSED FOR INCOMPLETENESS 4 $59,068 27 $51,717 24 $53,696 2 $31,000 4 $52,485
Aggregated Statistics For Year 2002(Based on 4 full and 2 partial tracts) A) FHA, FSA/RHS & VA B) Conventional C) Refinancings D) Home Improvement Loans F) Non-occupant Loans on Number Average Value Number Average Value Number Average Value Number Average Value Number Average Value
LOANS ORIGINATED 92 $62,203 125 $47,673 224 $38,615 37 $19,837 61 $39,744 APPLICATIONS APPROVED, NOT ACCEPTED 6 $65,658 28 $46,500 38 $34,013 14 $17,994 7 $41,716 APPLICATIONS DENIED 14 $46,217 86 $47,024 231 $39,893 64 $15,874 23 $43,867 APPLICATIONS WITHDRAWN 9 $55,741 18 $50,569 108 $46,942 8 $34,955 4 $50,318 FILES CLOSED FOR INCOMPLETENESS 0 $0 38 $47,811 18 $51,783 0 $0 5 $48,080
Aggregated Statistics For Year 2001(Based on 4 full and 2 partial tracts) A) FHA, FSA/RHS & VA B) Conventional C) Refinancings D) Home Improvement Loans E) Loans on Dwellings For 5+ Families F) Non-occupant Loans on Number Average Value Number Average Value Number Average Value Number Average Value Number Average Value Number Average Value
LOANS ORIGINATED 99 $54,023 92 $43,881 178 $39,256 40 $19,542 0 $0 31 $39,710 APPLICATIONS APPROVED, NOT ACCEPTED 6 $64,328 27 $47,431 27 $33,423 11 $22,736 0 $0 10 $44,579 APPLICATIONS DENIED 22 $53,884 117 $41,736 147 $37,570 64 $17,974 0 $0 11 $38,132 APPLICATIONS WITHDRAWN 5 $63,890 9 $85,700 74 $42,553 15 $11,395 2 $3,270,415 10 $35,447 FILES CLOSED FOR INCOMPLETENESS 5 $45,338 9 $49,682 16 $39,149 2 $14,980 0 $0 4 $37,058
Aggregated Statistics For Year 2000(Based on 4 full and 2 partial tracts) A) FHA, FSA/RHS & VA B) Conventional C) Refinancings D) Home Improvement Loans F) Non-occupant Loans on Number Average Value Number Average Value Number Average Value Number Average Value Number Average Value
LOANS ORIGINATED 97 $50,925 87 $38,809 139 $35,727 26 $20,838 50 $35,854 APPLICATIONS APPROVED, NOT ACCEPTED 3 $40,177 45 $43,801 22 $31,139 32 $18,535 8 $29,246 APPLICATIONS DENIED 23 $46,238 145 $40,132 101 $34,235 77 $11,227 19 $25,690 APPLICATIONS WITHDRAWN 6 $59,298 18 $61,075 54 $37,608 6 $33,902 8 $53,955 FILES CLOSED FOR INCOMPLETENESS 2 $53,000 11 $40,299 44 $41,187 2 $31,955 2 $40,565
Aggregated Statistics For Year 1999(Based on 2 full and 2 partial tracts) A) FHA, FSA/RHS & VA B) Conventional C) Refinancings D) Home Improvement Loans E) Loans on Dwellings For 5+ Families F) Non-occupant Loans on Number Average Value Number Average Value Number Average Value Number Average Value Number Average Value Number Average Value
LOANS ORIGINATED 92 $47,130 98 $49,328 144 $33,527 39 $16,319 1 $2,262,420 39 $29,638 APPLICATIONS APPROVED, NOT ACCEPTED 1 $60,320 48 $43,778 29 $30,940 38 $12,134 0 $0 9 $37,447 APPLICATIONS DENIED 7 $44,764 195 $42,461 88 $33,856 104 $14,188 0 $0 20 $34,560 APPLICATIONS WITHDRAWN 8 $48,490 14 $52,563 47 $38,281 6 $18,887 0 $0 3 $31,500 FILES CLOSED FOR INCOMPLETENESS 1 $29,820 3 $49,283 40 $40,896 1 $30,000 0 $0 8 $32,470
Private Mortgage Insurance Companies Aggregated Statistics For Year 2009(Based on 6 full and 2 partial tracts) A) Conventional B) Refinancings C) Non-occupant Loans on Number Average Value Number Average Value Number Average Value
LOANS ORIGINATED 10 $81,954 2 $67,275 2 $107,000 APPLICATIONS APPROVED, NOT ACCEPTED 0 $0 0 $0 0 $0 APPLICATIONS DENIED 2 $82,885 0 $0 0 $0 APPLICATIONS WITHDRAWN 0 $0 0 $0 0 $0 FILES CLOSED FOR INCOMPLETENESS 0 $0 0 $0 0 $0
Aggregated Statistics For Year 2008(Based on 6 full and 4 partial tracts) A) Conventional B) Refinancings C) Non-occupant Loans on Number Average Value Number Average Value Number Average Value
LOANS ORIGINATED 68 $87,031 2 $123,110 24 $89,067 APPLICATIONS APPROVED, NOT ACCEPTED 25 $90,108 6 $97,860 9 $90,469 APPLICATIONS DENIED 4 $82,915 0 $0 3 $61,880 APPLICATIONS WITHDRAWN 2 $51,925 0 $0 2 $51,925 FILES CLOSED FOR INCOMPLETENESS 0 $0 0 $0 0 $0
Aggregated Statistics For Year 2007(Based on 6 full and 4 partial tracts) A) Conventional B) Refinancings C) Non-occupant Loans on Number Average Value Number Average Value Number Average Value
LOANS ORIGINATED 153 $91,589 13 $82,468 30 $80,437 APPLICATIONS APPROVED, NOT ACCEPTED 37 $106,581 7 $124,559 12 $107,606 APPLICATIONS DENIED 2 $64,685 0 $0 2 $53,340 APPLICATIONS WITHDRAWN 11 $90,791 2 $51,320 2 $119,000 FILES CLOSED FOR INCOMPLETENESS 0 $0 0 $0 0 $0
Aggregated Statistics For Year 2006(Based on 6 full and 4 partial tracts) A) Conventional B) Refinancings C) Non-occupant Loans on Number Average Value Number Average Value Number Average Value
LOANS ORIGINATED 115 $81,103 8 $71,471 51 $78,406 APPLICATIONS APPROVED, NOT ACCEPTED 9 $85,984 0 $0 0 $0 APPLICATIONS DENIED 2 $44,850 0 $0 2 $44,850 APPLICATIONS WITHDRAWN 4 $66,500 0 $0 2 $59,000 FILES CLOSED FOR INCOMPLETENESS 0 $0 0 $0 0 $0
Aggregated Statistics For Year 2005(Based on 6 full and 4 partial tracts) A) Conventional B) Refinancings C) Non-occupant Loans on Number Average Value Number Average Value Number Average Value
LOANS ORIGINATED 55 $67,191 8 $59,869 32 $63,814 APPLICATIONS APPROVED, NOT ACCEPTED 8 $64,300 4 $81,050 4 $87,000 APPLICATIONS DENIED 2 $59,000 0 $0 2 $59,000 APPLICATIONS WITHDRAWN 6 $62,717 0 $0 2 $41,000 FILES CLOSED FOR INCOMPLETENESS 0 $0 0 $0 0 $0
Aggregated Statistics For Year 2004(Based on 6 full and 4 partial tracts) A) Conventional B) Refinancings C) Non-occupant Loans on Number Average Value Number Average Value Number Average Value
LOANS ORIGINATED 77 $56,850 32 $55,900 28 $50,073 APPLICATIONS APPROVED, NOT ACCEPTED 11 $59,802 4 $46,885 2 $62,035 APPLICATIONS DENIED 0 $0 0 $0 0 $0 APPLICATIONS WITHDRAWN 2 $55,575 0 $0 0 $0 FILES CLOSED FOR INCOMPLETENESS 2 $52,000 0 $0 0 $0
Aggregated Statistics For Year 2003(Based on 6 full and 4 partial tracts) A) Conventional B) Refinancings C) Non-occupant Loans on Number Average Value Number Average Value Number Average Value
LOANS ORIGINATED 67 $50,342 22 $49,906 31 $34,263 APPLICATIONS APPROVED, NOT ACCEPTED 10 $50,324 0 $0 3 $38,847 APPLICATIONS DENIED 4 $47,912 2 $52,000 2 $52,000 APPLICATIONS WITHDRAWN 4 $51,000 0 $0 0 $0 FILES CLOSED FOR INCOMPLETENESS 0 $0 0 $0 0 $0
Aggregated Statistics For Year 2002(Based on 4 full and 2 partial tracts) A) Conventional C) Non-occupant Loans on Number Average Value Number Average Value
LOANS ORIGINATED 36 $47,262 12 $43,453 APPLICATIONS APPROVED, NOT ACCEPTED 2 $82,815 0 $0 APPLICATIONS DENIED 2 $57,920 0 $0 APPLICATIONS WITHDRAWN 0 $0 0 $0 FILES CLOSED FOR INCOMPLETENESS 0 $0 0 $0
Aggregated Statistics For Year 2001(Based on 4 full and 2 partial tracts) A) Conventional B) Refinancings C) Non-occupant Loans on Number Average Value Number Average Value Number Average Value
LOANS ORIGINATED 15 $47,236 0 $0 7 $34,119 APPLICATIONS APPROVED, NOT ACCEPTED 4 $52,638 0 $0 2 $41,000 APPLICATIONS DENIED 0 $0 2 $41,000 0 $0 APPLICATIONS WITHDRAWN 0 $0 0 $0 0 $0 FILES CLOSED FOR INCOMPLETENESS 0 $0 0 $0 0 $0
Aggregated Statistics For Year 2000(Based on 4 full and 2 partial tracts) A) Conventional B) Refinancings C) Non-occupant Loans on Number Average Value Number Average Value Number Average Value
LOANS ORIGINATED 22 $45,330 8 $38,471 18 $42,863 APPLICATIONS APPROVED, NOT ACCEPTED 6 $54,278 0 $0 6 $54,278 APPLICATIONS DENIED 0 $0 0 $0 0 $0 APPLICATIONS WITHDRAWN 0 $0 0 $0 0 $0 FILES CLOSED FOR INCOMPLETENESS 0 $0 0 $0 0 $0
Aggregated Statistics For Year 1999(Based on 2 full and 2 partial tracts) A) Conventional B) Refinancings C) Non-occupant Loans on Number Average Value Number Average Value Number Average Value
LOANS ORIGINATED 8 $36,420 2 $31,690 1 $24,000 APPLICATIONS APPROVED, NOT ACCEPTED 0 $0 0 $0 0 $0 APPLICATIONS DENIED 0 $0 0 $0 0 $0 APPLICATIONS WITHDRAWN 0 $0 1 $65,950 0 $0 FILES CLOSED FOR INCOMPLETENESS 0 $0 0 $0 0 $0
2002 - 2018 National Fire Incident Reporting System (NFIRS) incidents See full 2006 National Fire Incident Reporting System statistics for zip code 78242, Texas
Most common first names in zip code 78242 among deceased individuals Name Count Lived (average)
Maria 61 72.1 years John 42 66.0 years Robert 39 63.4 years James 37 64.6 years Mary 35 67.5 years William 32 66.3 years Jose 26 70.1 years George 24 64.6 years David 23 63.9 years Charles 23 66.3 years
Most common last names in zip code 78242 among deceased individuals Last name Count Lived (average)
Martinez 46 66.2 years Hernandez 41 64.0 years Rodriguez 39 67.8 years Garcia 33 68.5 years Perez 19 73.1 years Garza 18 59.1 years Lopez 18 72.0 years Gonzalez 17 65.1 years Sanchez 15 67.1 years Morales 15 71.1 years
Businesses in zip code 78242
Name Count Name Count
AutoZone 1 SONIC Drive-In 1 Church's Chicken 1 Subway 1 Cricket Wireless 2 Travelodge 1 Little Caesars Pizza 1 U-Haul 1 McDonald's 1


 Nearest zip codes: 78243, 78211, 78236, 78226, 78227, 78237.
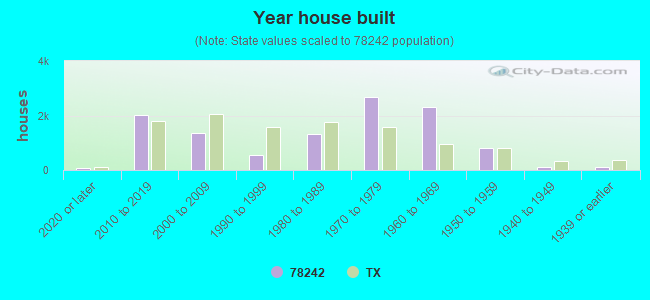
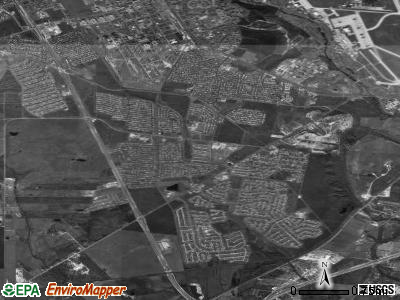
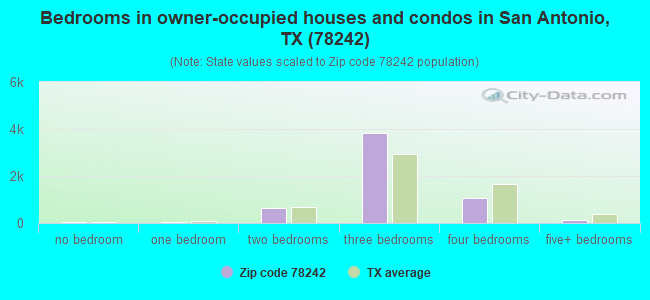
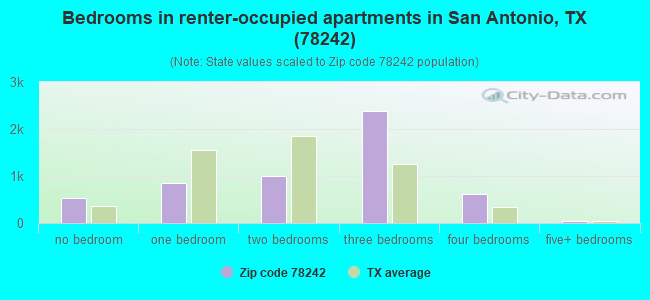
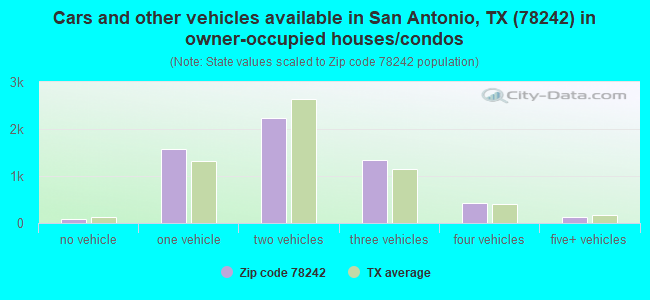


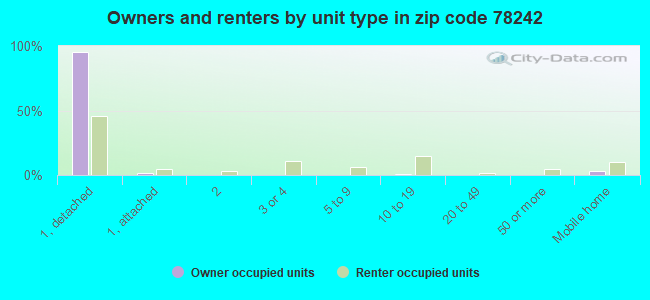
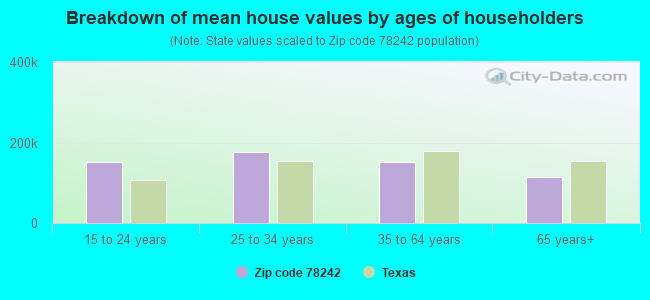


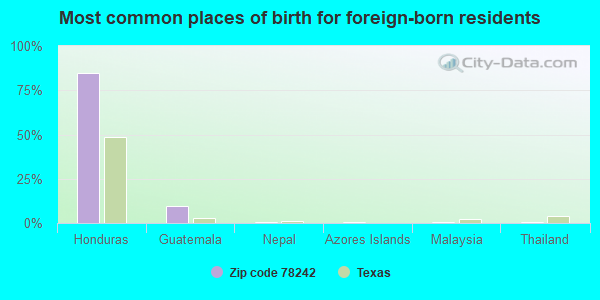
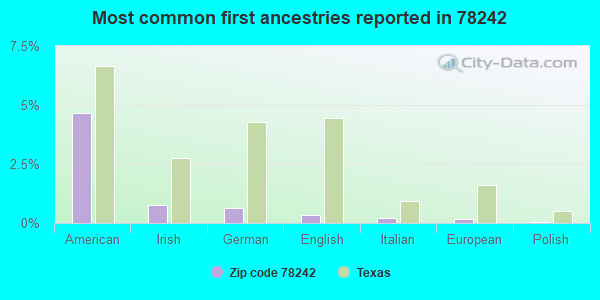
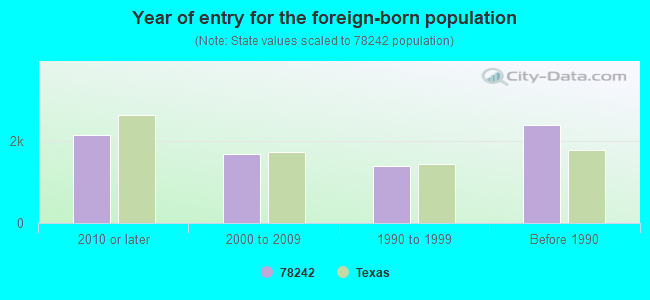


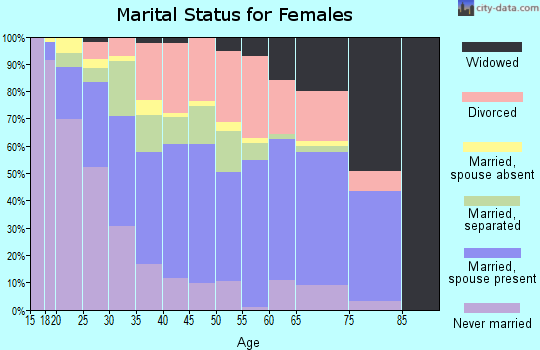
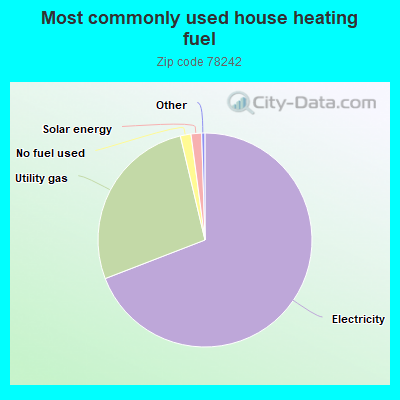
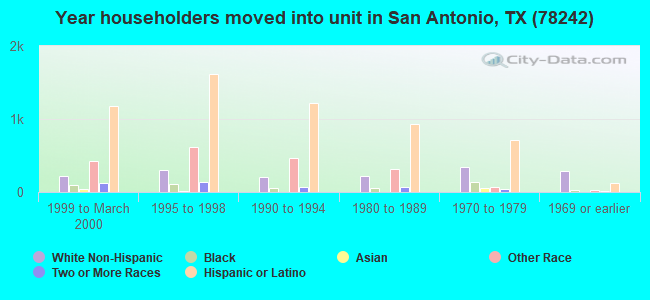
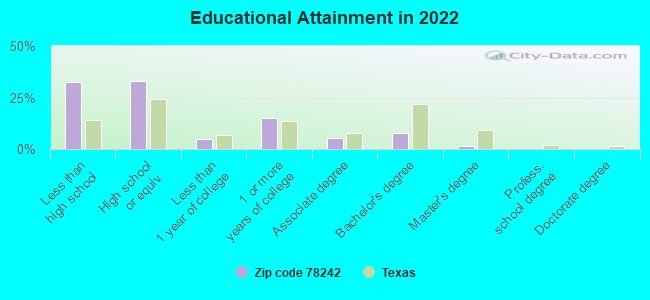
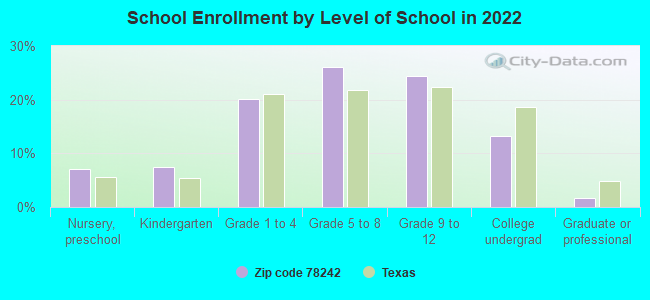
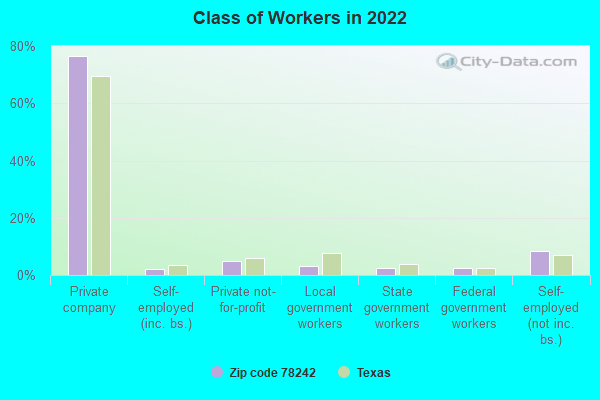
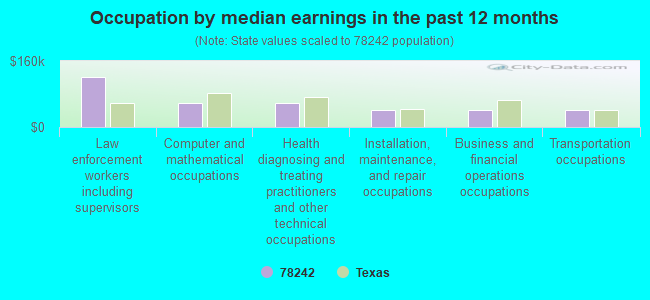
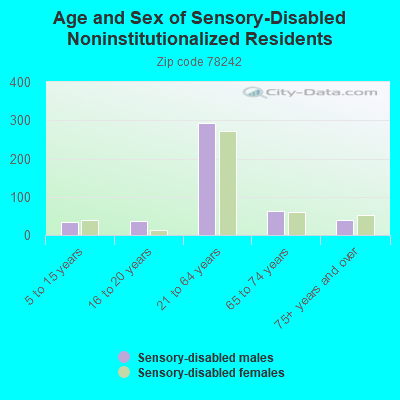
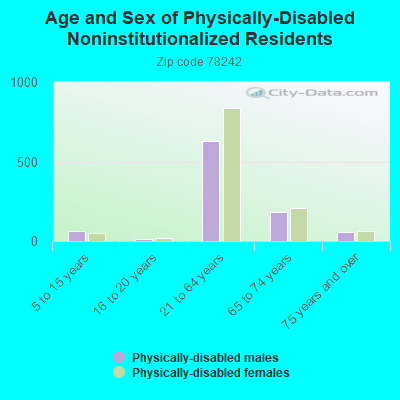
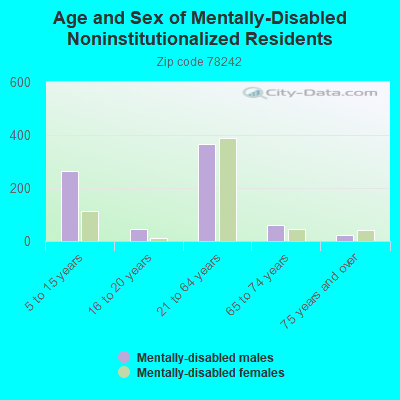
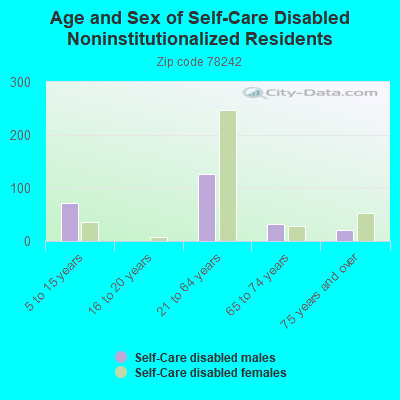
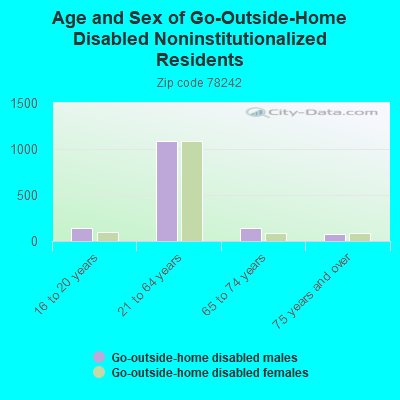
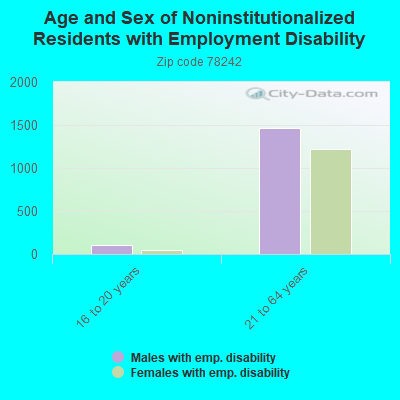
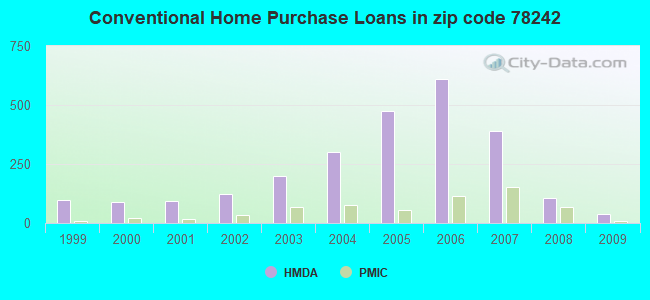
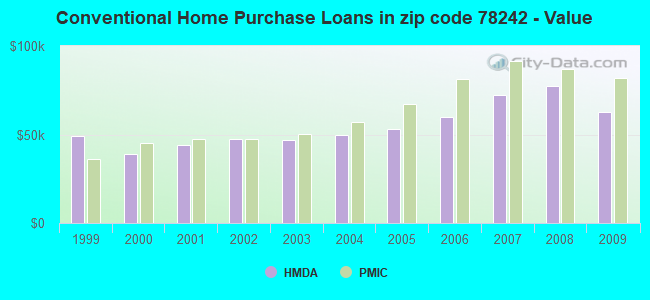
 Based on the data from the years 2002 - 2018 the average number of fires per year is 105. The highest number of reported fire incidents - 189 took place in 2003, and the least - 2 in 2008. The data has a declining trend.
 When looking into fire subcategories, the most reports belonged to: Outside Fires (64.5%), and Mobile Property/Vehicle Fires (14.6%).