Estimated zip code population in 2022: 46,777 Zip code population in 2010: 46,077 Zip code population in 2000: 46,668
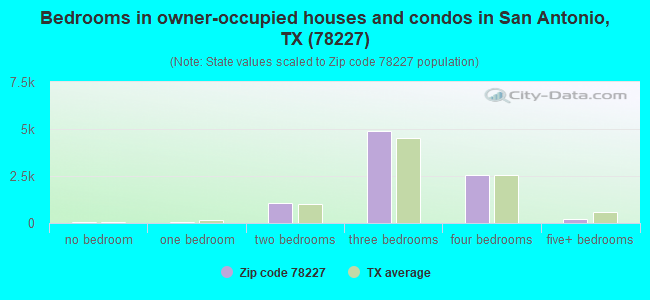
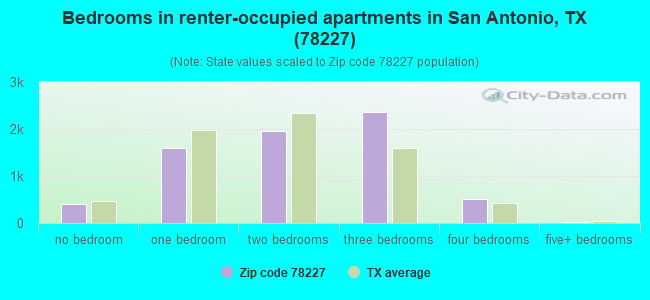
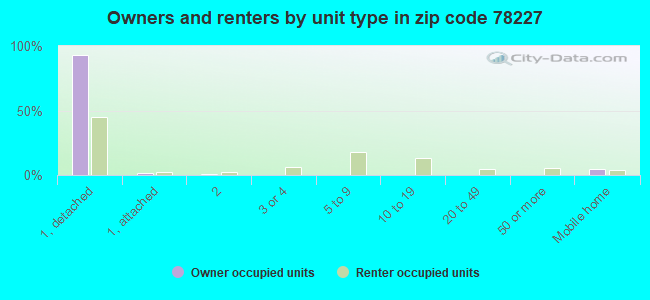
Houses and condos: 16,897 Renter-occupied apartments: 6,880
% of renters here:
44%
State:
38%
March 2022 cost of living index in zip code 78227: 87.0 (less than average, U.S. average is 100)
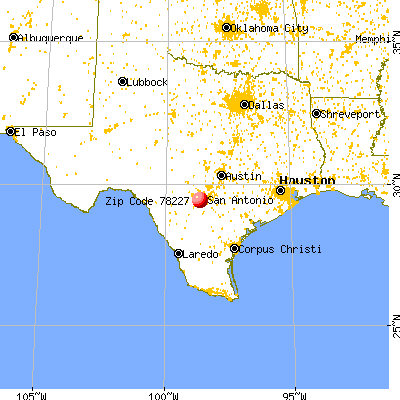
Land area: 13.8 sq. mi. Water area: 0.1 sq. mi.
Population density: 3,389 people per square mile
(average).
OSM Map
General Map
Google Map
MSN Map
OSM Map
General Map
Google Map
MSN Map
OSM Map
General Map
Google Map
MSN Map
OSM Map
General Map
Google Map
MSN Map
Please wait while loading the map...
Real estate property taxes paid for housing units in 2022:
This zip code:
1.4% ($2,042)
Texas:
1.5% ($4,050)
Median real estate property taxes paid for housing units with mortgages in 2022: $3,116 (2.0%) Median real estate property taxes paid for housing units with no mortgage in 2022: $1,543 (1.1%)
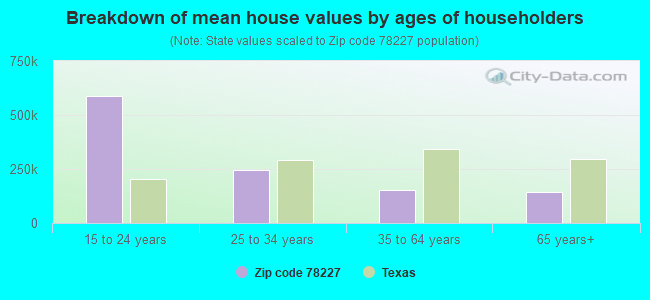
Estimated median house/condo value in 2022: $150,081
78227:
$150,081
Texas:
$275,400
According to our research of Texas and other state lists, there were 128 registered sex offenders living in 78227 zip code as of May 16, 2024. The ratio of all residents to sex offenders in zip code 78227 is 381 to 1. The ratio of registered sex offenders to all residents in this zip code is near the state average.
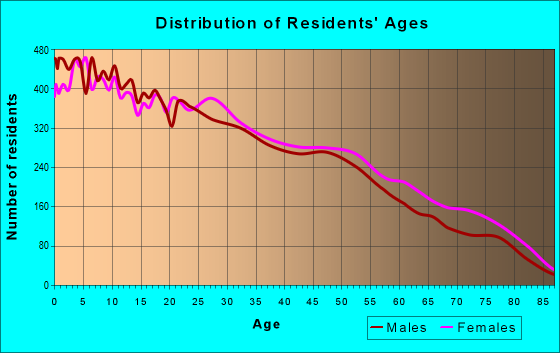
Median resident age:
This zip code:
33.8 years
Texas median age:
35.6 years
Average household size:
This zip code:
3.0 people
Texas:
2.6 people
Averages for the 2020 tax year for zip code 78227, filed in 2021:
Average Adjusted Gross Income (AGI) in 2020: $33,486 (Individual Income Tax Returns)
Here:
$33,486
State:
$77,054
Salary/wage: $31,074 (reported on 82.6% of returns)
Here:
$31,074
State:
$62,766
(% of AGI for various income ranges: 1139.1% for AGIs below $25k, 3368.6% for AGIs $25k-50k, 5962.2% for AGIs $50k-75k, 8755.5% for AGIs $75k-100k, 14048.5% for AGIs $100k-200k)
Taxable interest for individuals: $1,017 (reported on 10.4% of returns)
This zip code:
$1,017
Texas:
$2,665
(% of AGI for various income ranges: 4.0% for AGIs below $25k, 6.4% for AGIs $25k-50k, 27.8% for AGIs $50k-75k, 45.2% for AGIs $75k-100k, 125.0% for AGIs $100k-200k)
Ordinary dividends: $2,279 (reported on 3.4% of returns)
Here:
$2,279
State:
$10,044
(% of AGI for various income ranges: 1.4% for AGIs below $25k, 2.7% for AGIs $25k-50k, 8.5% for AGIs $50k-75k, 48.8% for AGIs $75k-100k, 209.0% for AGIs $100k-200k)
Net capital gain/loss in AGI: +$4,442 (reported on 3.0% of returns)
Here:
+$4,442
State:
+$39,590
(% of AGI for various income ranges: 0.8% for AGIs below $25k, 2.8% for AGIs $25k-50k, 15.7% for AGIs $50k-75k, 91.1% for AGIs $75k-100k, 405.8% for AGIs $100k-200k)
Profit/loss from business: +$6,552 (reported on 17.3% of returns)
Here:
+$6,552
State:
+$10,888
(% of AGI for various income ranges: 166.7% for AGIs below $25k, 67.1% for AGIs $25k-50k, 120.6% for AGIs $50k-75k, 129.5% for AGIs $75k-100k, 695.0% for AGIs $100k-200k)
Taxable individual retirement arrangement distribution: $8,782 (reported on 3.3% of returns)
78227:
$8,782
Texas:
$24,740
(% of AGI for various income ranges: 13.2% for AGIs below $25k, 15.6% for AGIs $25k-50k, 58.7% for AGIs $50k-75k, 220.6% for AGIs $75k-100k, 349.2% for AGIs $100k-200k)
Total itemized deductions: $28,707 (reported on 2.0% of returns)
Here:
$28,707
State:
$40,428
(% of AGI for various income ranges: 11.3% for AGIs below $25k, 59.4% for AGIs $25k-50k, 186.6% for AGIs $50k-75k, 289.1% for AGIs $75k-100k, 448.8% for AGIs $100k-200k)
Charity contributions: $7,307 (reported on 1.5% of returns)
Here:
$7,307
State:
$18,201
(% of AGI for various income ranges: 1.2% for AGIs below $25k, 11.3% for AGIs $25k-50k, 30.7% for AGIs $50k-75k, 68.9% for AGIs $75k-100k, 93.0% for AGIs $100k-200k)
Taxes paid: $5,597 (reported on 1.9% of returns)
78227:
$5,597
State:
$7,821
(% of AGI for various income ranges: 1.9% for AGIs below $25k, 11.4% for AGIs $25k-50k, 33.5% for AGIs $50k-75k, 46.8% for AGIs $75k-100k, 84.5% for AGIs $100k-200k)
Earned income credit: $2,760 (reported on 34.4% of returns)
Here:
$2,760
State:
$2,584
(% of AGI for various income ranges: 165.5% for AGIs below $25k, 104.4% for AGIs $25k-50k, 2.6% for AGIs $50k-75k)
Percentage of individuals using paid preparers for their 2020 taxes: 92.7%
Here:
93%
State:
92%
(% for various income ranges: 91.9% for AGIs below $25k, 94.3% for AGIs $25k-50k, 92.6% for AGIs $50k-75k, 91.2% for AGIs $75k-100k, 91.9% for AGIs $100k-200k, 100.0% for AGIs over 200k)
Averages for the 2012 tax year for zip code 78227, filed in 2013:
Average Adjusted Gross Income (AGI) in 2012: $28,664 (Individual Income Tax Returns)
Here:
$28,664
State:
$65,384
Salary/wage: $26,650 (reported on 84.5% of returns)
Here:
$26,650
State:
$52,524
(% of AGI for various income ranges: 78.7% for AGIs below $25k, 83.9% for AGIs $25k-50k, 76.6% for AGIs $50k-75k, 76.1% for AGIs $75k-100k, 59.0% for AGIs $100k-200k)
Taxable interest for individuals: $958 (reported on 12.0% of returns)
This zip code:
$958
Texas:
$2,372
(% of AGI for various income ranges: 0.3% for AGIs below $25k, 0.3% for AGIs $25k-50k, 0.5% for AGIs $50k-75k, 0.6% for AGIs $75k-100k, 0.7% for AGIs $100k-200k)
Ordinary dividends: $2,199 (reported on 4.0% of returns)
Here:
$2,199
State:
$9,721
(% of AGI for various income ranges: 0.2% for AGIs below $25k, 0.2% for AGIs $25k-50k, 0.2% for AGIs $50k-75k, 0.6% for AGIs $75k-100k, 1.3% for AGIs $100k-200k)
Net capital gain/loss in AGI: +$3,165 (reported on 2.4% of returns)
Here:
+$3,165
State:
+$35,319
(% of AGI for various income ranges: 0.2% for AGIs $50k-75k, 0.6% for AGIs $75k-100k, 2.1% for AGIs $100k-200k)
Profit/loss from business: +$8,234 (reported on 13.7% of returns)
Here:
+$8,234
State:
+$13,732
(% of AGI for various income ranges: 10.9% for AGIs below $25k, 2.2% for AGIs $25k-50k, 0.8% for AGIs $50k-75k, 1.0% for AGIs $75k-100k, 0.7% for AGIs $100k-200k)
Taxable individual retirement arrangement distribution: $6,811 (reported on 4.1% of returns)
78227:
$6,811
Texas:
$19,511
(% of AGI for various income ranges: 0.5% for AGIs below $25k, 0.8% for AGIs $25k-50k, 1.0% for AGIs $50k-75k, 1.6% for AGIs $75k-100k, 2.7% for AGIs $100k-200k)
Total itemized deductions: $16,984 (31% of AGI, reported on 8.0% of returns)
Here:
$16,984
State:
$24,724
Here:
31.5% of AGI
State:
15.9% of AGI
(% of AGI for various income ranges: 2.2% for AGIs below $25k, 4.7% for AGIs $25k-50k, 5.9% for AGIs $50k-75k, 6.4% for AGIs $75k-100k, 8.7% for AGIs $100k-200k)
Charity contributions: $3,141 (reported on 5.5% of returns)
Here:
$3,141
State:
$6,808
(% of AGI for various income ranges: 0.2% for AGIs below $25k, 0.5% for AGIs $25k-50k, 0.7% for AGIs $50k-75k, 1.0% for AGIs $75k-100k, 1.8% for AGIs $100k-200k)
Taxes paid: $3,911 (reported on 7.6% of returns)
78227:
$3,911
State:
$6,921
(% of AGI for various income ranges: 0.4% for AGIs below $25k, 1.3% for AGIs $25k-50k, 1.1% for AGIs $50k-75k, 1.4% for AGIs $75k-100k, 1.4% for AGIs $100k-200k)
Earned income credit: $2,780 (reported on 39.4% of returns)
Here:
$2,780
State:
$2,570
(% of AGI for various income ranges: 11.7% for AGIs below $25k, 2.1% for AGIs $25k-50k)
Percentage of individuals using paid preparers for their 2012 taxes: 44.8%
Here:
45%
State:
51%
(% for various income ranges: 46.2% for AGIs below $25k, 42.1% for AGIs $25k-50k, 44.6% for AGIs $50k-75k, 43.5% for AGIs $75k-100k, 50.0% for AGIs $100k-200k)
Averages for the 2004 tax year for zip code 78227, filed in 2005:
Average Adjusted Gross Income (AGI) in 2004: $24,921 (Individual Income Tax Returns)
Here:
$24,921
State:
$47,881
Salary/wage: $22,830 (reported on 85.6% of returns)
Here:
$22,830
State:
$41,947
(% of AGI for various income ranges: 84.0% for AGIs below $10k, 83.2% for AGIs $10k-25k, 81.4% for AGIs $25k-50k, 73.7% for AGIs $50k-75k, 70.3% for AGIs $75k-100k, 49.7% for AGIs over 100k)
Taxable interest for individuals: $1,320 (reported on 18.5% of returns)
This zip code:
$1,320
Texas:
$2,255
(% of AGI for various income ranges: 1.0% for AGIs below $10k, 0.6% for AGIs $10k-25k, 0.8% for AGIs $25k-50k, 1.4% for AGIs $50k-75k, 1.3% for AGIs $75k-100k, 2.7% for AGIs over 100k)
Taxable dividends: $1,614 (reported on 6.4% of returns)
Here:
$1,614
State:
$4,261
(% of AGI for various income ranges: 0.2% for AGIs below $10k, 0.2% for AGIs $10k-25k, 0.2% for AGIs $25k-50k, 0.6% for AGIs $50k-75k, 0.9% for AGIs $75k-100k, 2.2% for AGIs over 100k)
Net capital gain/loss: +$3,017 (reported on 4.1% of returns)
Here:
+$3,017
State:
+$16,110
(% of AGI for various income ranges: -0.1% for AGIs below $10k, 0.0% for AGIs $10k-25k, 0.1% for AGIs $25k-50k, 0.5% for AGIs $50k-75k, 0.8% for AGIs $75k-100k, 7.2% for AGIs over 100k)
Profit/loss from business: +$6,858 (reported on 10.9% of returns)
Here:
+$6,858
State:
+$11,013
(% of AGI for various income ranges: 10.6% for AGIs below $10k, 5.3% for AGIs $10k-25k, 1.4% for AGIs $25k-50k, 1.2% for AGIs $50k-75k, 1.3% for AGIs $75k-100k, 5.0% for AGIs over 100k)
IRA payment deduction: $2,440 (reported on 0.9% of returns)
78227:
$2,440
Texas:
$3,120
(% of AGI for various income ranges: 0.1% for AGIs $10k-25k, 0.1% for AGIs $25k-50k, 0.1% for AGIs $50k-75k, 0.1% for AGIs $75k-100k)
Total itemized deductions: $14,033 (30% of AGI, reported on 7.0% of returns)
Here:
$14,033
State:
$19,631
Here:
30.1% of AGI
State:
18.9% of AGI
(% of AGI for various income ranges: 1.1% for AGIs below $10k, 2.0% for AGIs $10k-25k, 4.2% for AGIs $25k-50k, 5.1% for AGIs $50k-75k, 6.6% for AGIs $75k-100k, 8.3% for AGIs over 100k)
Charity contributions deductions: $3,030 (6% of AGI, reported on 5.5% of returns)
Here:
$3,030
State:
$4,753
Here:
6.2% of AGI
State:
4.2% of AGI
(% of AGI for various income ranges: 0.1% for AGIs below $10k, 0.2% for AGIs $10k-25k, 0.6% for AGIs $25k-50k, 0.8% for AGIs $50k-75k, 1.3% for AGIs $75k-100k, 2.8% for AGIs over 100k)
Total tax: $2,588 (reported on 58.5% of returns)
78227:
$2,588
State:
$9,058
(% of AGI for various income ranges: 2.5% for AGIs below $10k, 3.0% for AGIs $10k-25k, 5.4% for AGIs $25k-50k, 8.6% for AGIs $50k-75k, 11.4% for AGIs $75k-100k, 15.7% for AGIs over 100k)
Earned income credit: $2,142 (reported on 38.6% of returns)
Here:
$2,142
State:
$2,024
Percentage of individuals using paid preparers for their 2004 taxes: 58.4%
Here:
58%
State:
57%
(% for various income ranges: 57.2% for AGIs below $10k, 63.8% for AGIs $10k-25k, 54.4% for AGIs $25k-50k, 49.2% for AGIs $50k-75k, 54.3% for AGIs $75k-100k, 58.6% for AGIs over 100k)
Likely homosexual households (counted as self-reported same-sex unmarried-partner households)
Lesbian couples: 0.0% of all households
Gay men: 0.1% of all households
Household received Food Stamps/SNAP in the past 12 months: 4,841 Household did not receive Food Stamps/SNAP in the past 12 months: 11,110
Women who had a birth in the past 12 months: 519 (186 now married, 322 unmarried) Women who did not have a birth in the past 12 months: 11,459 (4,204 now married, 7,282 unmarried)
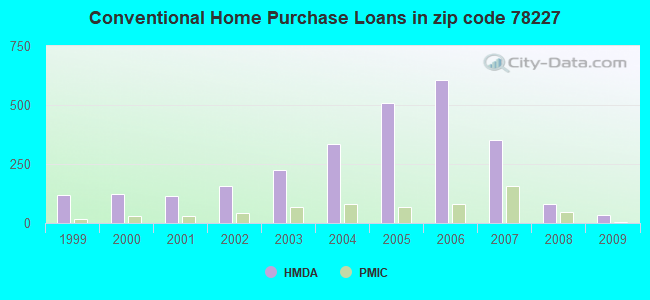
Housing units in zip code 78227 with a mortgage: 4,123 (75 second mortgage, 58 both second mortgage and home equity loan) Houses without a mortgage: 32
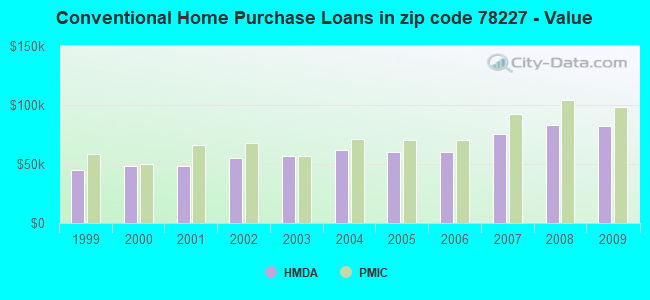
Median monthly owner costs for units with a mortgage: $1,209 Median monthly owner costs for units without a mortgage: $522
Residents with income below the poverty level in 2022:
This zip code:
23.1%
Whole state:
14.0%
Residents with income below 50% of the poverty level in 2022:
This zip code:
13.1%
Whole state:
7.4%
Median number of rooms in houses and condos:
Here:
5.7
State:
6.3
Median number of rooms in apartments:
Here:
4.3
State:
4.0
Notable locations in this zip code not listed on our city pages
Notable locations in zip code 78227: Southwest Foundation for Research and Education (A), Guerra Branch Library San Antonio City Library (B), Home Away From Home Child Care Center (C). Display/hide their locations on the map
Churches in zip code 78227 include: Church of Christ Valley Hi (A), Church of Christ Lackland Terrace (B), Atonement Lutheran Church (C), Chapel Hill United Methodist Church (D), Glorious Pentecostal Church (E), Ephesus Missonary Baptist Church (F), Church New Apostolic (G), Liberty Baptist Church (H), Valley Hi First Baptist Church (I). Display/hide their locations on the map
Parks in zip code 78227 include: Levi Strauss Park (1), Mateo Camargo Park (2), Rodriguez Park (3), Pablos Grove Park (4), Lackland Terrace Park (5), Strauss Park (6), Van de Walle Park (7), Westwood Park (8), Westwood Village Park (9). Display/hide their locations on the map
6,224 married couples with children.
4,902 single-parent households (932 men, 3,970 women).
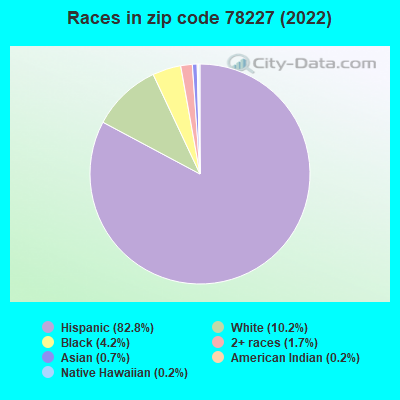
51.2% of residents of 78227 zip code speak English at home.
47.9% of residents speak Spanish at home (65% very well, 17% well, 12% not well, 6% not at all).
0.3% of residents speak other Indo-European language at home (61% very well, 39% well).
0.3% of residents speak Asian or Pacific Island language at home (44% very well, 56% well).
0.1% of residents speak other language at home (100% very well).
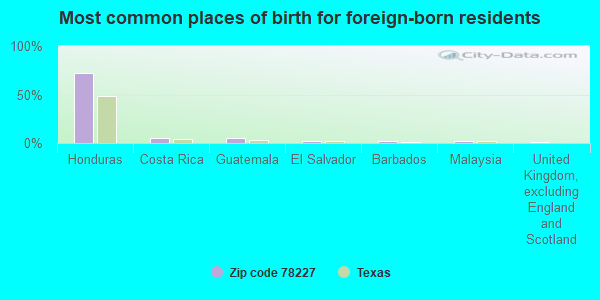
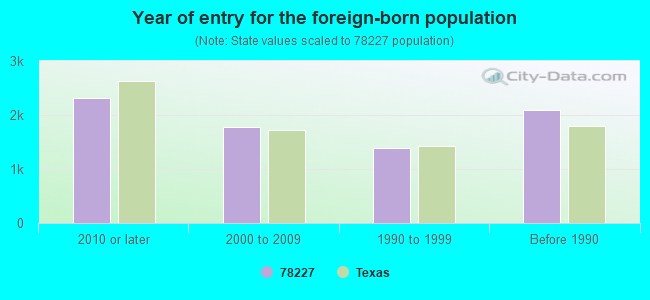
Foreign born population: 6,786 (14.5%) (37.1% of them are naturalized citizens)
Facilities with environmental interests located in this zip code:
ANSON JONES MIDDLE (1256 PINN RD in SAN ANTONIO, TX)
(National Center for Education Statistics) - STATE ID-015915044 Organizations: NORTHSIDE ISD (SCHOOL DISTRICT)
AMERDYNE CENTRAL INC (9800 W COMMERCE in SAN ANTONIO, TX)
(Resource Conservation and Recovery Act (tracking hazardous waste))
ATONEMENT LUTHERAN CHURCH SCHOOL (735 CEDARHURST in SAN ANTONIO, TX)
COMPLIANCE ACTIVITY (Tracking inspections of insecticide, fungicide, and rodenticide, and toxic substances)
Housing units lacking complete plumbing facilities: 1.4% Housing units lacking complete kitchen facilities: 3.1%
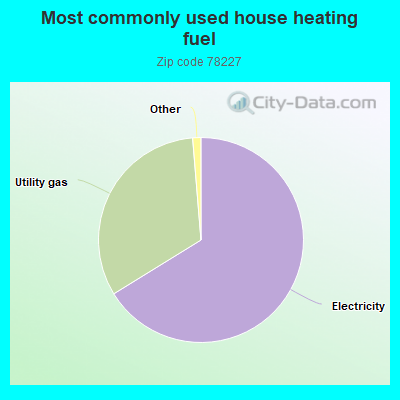
66.2%Electricity
32.5%Utility gas
0.7%No fuel used
0.5%Bottled, tank, or LP gas
Population in 1990: 42,329. Population change in the 1990s: +4,339 (+10.3%).
Place of birth for U.S.-born residents:
This state: 33,046
Northeast: 475
Midwest: 1,323
South: 2,042
West: 2,011
52% of the 78227 zip code residents lived in the same house 5 years ago. Out of people who lived in different houses, 56% lived in this county. Out of people who lived in different counties, 50% lived in Texas.
86% of the 78227 zip code residents lived in the same house 1 year ago. Out of people who lived in different houses, 75% moved from this county. Out of people who lived in different houses, 8% moved from different county within same state. Out of people who lived in different houses, 9% moved from different state. Out of people who lived in different houses, 4% moved from abroad.
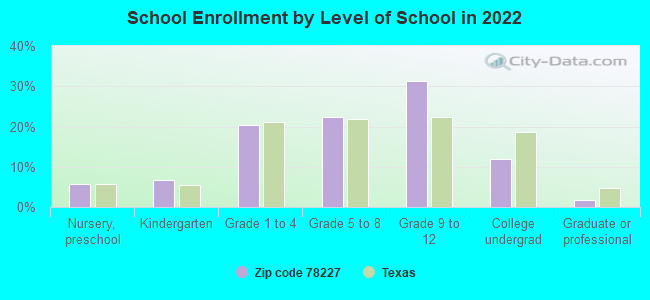
Private vs. public school enrollment:
Students in private schools in grades 1 to 8 (elementary and middle school): 494
Here:
8.9%
Texas:
8.8%
Students in private schools in grades 9 to 12 (high school): 228
Here:
5.6%
Texas:
8.0%
Students in private undergraduate colleges: 260
Here:
16.8%
Texas:
16.2%
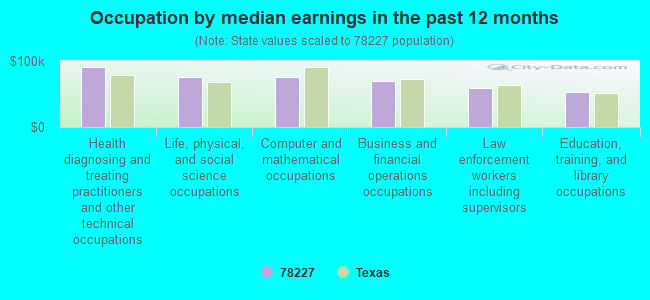
Occupation by median earnings in the past 12 months ($)
90,582Health diagnosing and treating practitioners and other technical occupations
75,888Life, physical, and social science occupations
75,500Computer and mathematical occupations
69,544Business and financial operations occupations
59,773Law enforcement workers including supervisors
53,744Education, training, and library occupations
Companies with biggest federal contracts located in this zip code (SAN ANTONIO, TX):
OLMOS CONSTRUCTION, INC (440 PINN RD) : $33,928,458 in 435 contractsfrom 1999 to 2006
Contracts for Maintenance, Repair or Alteration of Real Property -- Highways, Roads, Streets, Bridges, and Railways (includes resurfacing), Maintenance, Repair or Alteration of Real Property -- Airport Runways, Maintenance, Repair or Alteration of Real Property -- Other Airfield Structures, Maintenance, Repair or Alteration of Real Property -- Airport Service Roads, and moreby Air Force Signed by year:2000: $3,000,825; 2001: $6,058,963; 2002: $5,438,565; 2003: $8,994,134; 2004: $3,293,900; 2005: $6,063,003; 2006: $964,921.
Biggest contracts:
$1,012,521 with Air Force for Maintenance, Repair or Alteration of Real Property -- Highways, Roads, Streets, Bridges, and Railways (includes resurfacing). Signed on 2003-09-29. Completion date: 2004-09-29.
$999,996 with Air Force for Maintenance, Repair or Alteration of Real Property -- Airport Runways. Signed on 2003-09-22. Completion date: 2004-04-17.
$943,716 with Air Force for Maintenance, Repair or Alteration of Real Property -- Highways, Roads, Streets, Bridges, and Railways (includes resurfacing). Signed on 2002-09-30. Completion date: 2003-09-30.
$886,059, same as above.Signed on 2001-09-29. Completion date: 2002-04-22.
SOUTHWEST FOUNDATION FOR BIOME (WEST LOOP 410) : $13,812,603 in 36 contractsfrom 2000 to 2006
Contracts for AIDS Research -- Applied Research and Exploratory Development (R&D), Biomedical -- Basic Research (R&D), Other Research and Development -- Basic Research (R&D), Medical and Surgical Instruments, Equipment, and Supplies, and moreby National Institutes of Health, Air Force, Army, Food and Drug Administration, and others Signed by year:2000: $1,760,885; 2001: $3,001,002; 2002: $2,366,034; 2003: $3,140,107; 2004: $1,587,395; 2005: $1,737,096; 2006: $220,084.
Biggest contracts:
$2,400,000 with National Institutes of Health for AIDS Research -- Applied Research and Exploratory Development (R&D). Signed on 2003-06-15. Completion date: 2007-05-15.
$1,568,000 with National Institutes of Health for Biomedical -- Basic Research (R&D). Signed on 2001-05-15. Completion date: 2001-12-15.
$1,410,000, same as above.Signed on 2002-04-15. Completion date: 2007-03-15.
$1,171,748, same as above.Signed on 2005-01-06. Effective on 2005-02-01. Completion date: 2007-03-31.
DIVISION LAUNDRY & CLEANERS (6649 W US HIGHWAY 90; small business) : $13,118,334 in 41 contractsfrom 1999 to 2005
Contracts for Laundry and DryCleaning Services, Maintenance, Repair and Rebuilding of Equipment -- Training Aids and Devices, Landscaping/Groundskeeping Services by Air Force, Army Signed by year:2000: $3,918,363; 2001: $1,462,751; 2002: $1,642,436; 2003: $2,200,627; 2004: $983,698; 2005: $952,862; 2006: $0.
Biggest contracts:
$1,643,344 with Air Force for Laundry and DryCleaning Services. Signed on 2001-10-01. Completion date: 2001-09-30.
$1,598,103, same as above.Signed on 2000-10-19. Completion date: 2001-09-30.
$1,206,895, same as above.Signed on 2005-10-01. Completion date: 2006-09-30.
$1,169,093, same as above.Signed on 2004-10-01. Completion date: 2005-09-30.
KEL-LAC UNIFORMS INC (7016 W US HIGHWAY 90; small business) : $4,617,790 in 37 contractsfrom 1999 to 2006
Contracts for Laundry and DryCleaning Services, Badges and Insignia, Textile Fabrics, Clothing, Special Purpose, and moreby Air Force, Army Signed by year:2000: $1,194,324; 2001: $1,397,342; 2002: $316,647; 2003: $229,635; 2004: $24,353; 2005: $207,986; 2006: $60,631.
Biggest contracts:
$1,063,602 with Air Force for Laundry and DryCleaning Services. Signed on 2001-10-04. Completion date: 2002-09-30.
$914,652, same as above.Signed on 2000-10-10. Completion date: 2001-09-30.
$863,952, same as above.Signed on 1999-10-12. Completion date: 2000-09-30.
$376,740, same as above.Signed on 2001-10-09. Completion date: 2002-09-30.
KNIGHT AEROSPACE PRODUCTS INC (5400-3 NEW HIGHWAY 90 W) : $2,929,033 in 37 contractsfrom 2000 to 2006
Contracts for Aircraft Maintenance and Repair Shop Specialized Equipment, Winches, Hoists, Cranes, and Derricks, Aircraft Ground Servicing Equipment, Miscellaneous Aircraft Accessories and Components, and moreby Air Force, Navy, Army, United States Coast Guard (disused code: now 7008), and others Signed by year:2000: $36,400; 2001: $115,789; 2002: $672,525; 2003: $319,894; 2004: $347,219; 2005: $1,252,753; 2006: $184,453.
Biggest contracts:
$272,400 with Air Force for Aircraft Maintenance and Repair Shop Specialized Equipment. Signed on 2002-05-29. Completion date: 2003-06-30.
$269,430 with Air Force for Winches, Hoists, Cranes, and Derricks. Signed on 2005-09-16. Completion date: 2006-05-31.
$247,500 with Air Force for Aircraft Ground Servicing Equipment. Signed on 2002-04-02. Completion date: 2002-04-02.
$218,710 with Navy for Miscellaneous Aircraft Accessories and Components. Signed on 2005-06-15. Completion date: 2005-10-19.
CHILDRENSASSOCIATION FOR MAXIM (2525 LADD STREET, LACKLAN) : $1,229,654 in 5 contractsfrom 2000 to 2004
Contracts for Other Administrative Support Services, Recreational Services by Air Force, Army Signed by year:2000: $300,000; 2001: $537,339; 2002: $388,129; 2003: $0; 2004: $4,186; 2005: $0; 2006: $0.
Biggest contracts:
$388,129 with Air Force for Other Administrative Support Services. Signed on 2002-10-01. Completion date: 2003-09-30.
$387,339, same as above.Signed on 2001-10-01. Completion date: 2002-09-30.
$300,000, same as above.Signed on 2000-04-26. Completion date: 2005-04-30.
$150,000, same as above.Signed on 2001-04-23. Completion date: 2001-05-01.
CABANA MECHANICAL INC (2824 SW LOOP 410; small business) : $117,980 in 14 contractsfrom 2000 to 2005
Contracts for Maintenance, Repair or Alteration of Real Property -- Restoration of real property, Air Conditioning Equipment, Refrigeration and Air Conditioning Components, Compressors and Vacuum Pumps, and moreby Army Signed by year:2000: $4,300; 2001: $0; 2002: $0; 2003: $0; 2004: $0; 2005: $113,680; 2006: $0.
Biggest contracts:
$16,800 with Army for Maintenance, Repair or Alteration of Real Property -- Restoration of real property. Signed on 2005-06-17. Completion date: 2005-06-30.
$16,200 with Army for Air Conditioning Equipment. Signed on 2005-07-26. Completion date: 2005-08-12.
$13,000, same as above.Signed on 2005-07-26. Completion date: 2005-08-05.
$12,100, same as above.Signed on 2005-09-29. Completion date: 2005-10-05.
LACKLAND HOTEL INVESTMENTS, LL (6815 W US HIGHWAY 90) : $106,086 in 3 contractsfrom 2003 to 2005
$94,876 with Air Force for Lodging - Hotel/Motel. Signed on 2003-10-03. Completion date: 2004-09-15.
$12,331 with Army for Lodging - Hotel/Motel. Signed on 2005-02-02. Completion date: 2005-02-11.
-$1,121, same as above.Signed on 2005-02-25. Completion date: 2005-02-11.
LA QUINTA INNS INC (6511 MILITARY DR W) : $65,166 in 2 contractsfrom 2003 to 2004
$61,318 with Air Force for Lodging - Hotel/Motel. Signed on 2003-10-01. Completion date: 2004-09-16.
$3,848, same as above.Signed on 2004-10-01. Completion date: 2005-02-28.
JACQUELINE M. JURKOWSKI (1910 RAWHIDE LN.; small business)
$47,800 with Army for Miscellaneous Items. Signed on 1999-10-06. Completion date: 2000-08-31.
Top industries in this zip code by the number of employees in 2005:
2002 - 2018 National Fire Incident Reporting System (NFIRS) incidents
Based on the data from the years 2002 - 2018 the average number of fires per year is 135. The highest number of fire incidents - 190 took place in 2005, and the least - 0 in 2008. The data has a dropping trend.
When looking into fire subcategories, the most reports belonged to: Outside Fires (50.8%), and Mobile Property/Vehicle Fires (24.7%).
Fire incident types reported to NFIRS in Zip Code 78227


 Nearest zip codes: 78236, 78243, 78242, 78237, 78226, 78238.
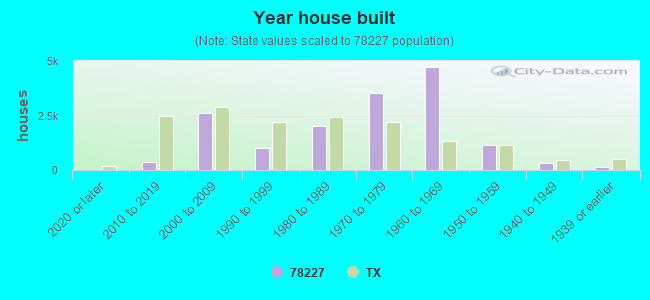


 Based on the data from the years 2002 - 2018 the average number of fires per year is 135. The highest number of fire incidents - 190 took place in 2005, and the least - 0 in 2008. The data has a dropping trend.
 When looking into fire subcategories, the most reports belonged to: Outside Fires (50.8%), and Mobile Property/Vehicle Fires (24.7%).