Estimated zip code population in 2022: 1,291 Zip code population in 2010: 1,119 Zip code population in 2000: 1,101
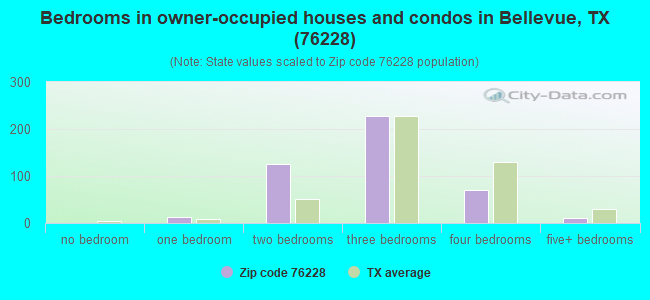
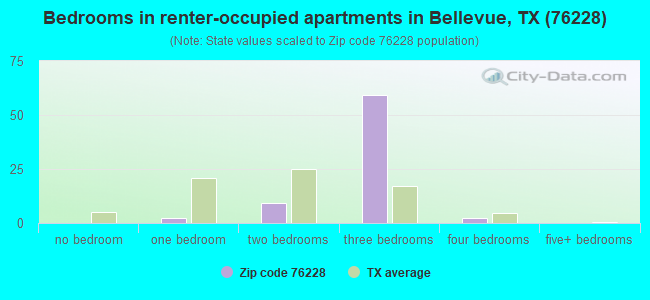
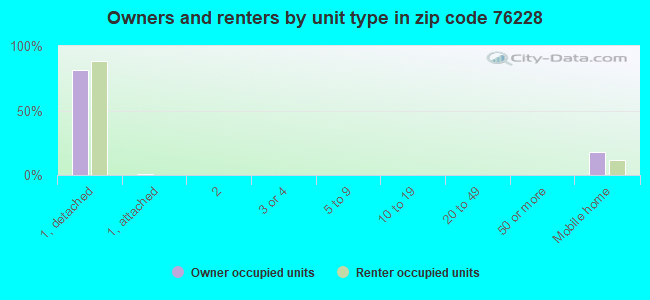
Houses and condos: 624 Renter-occupied apartments: 74
% of renters here:
14%
State:
38%
March 2022 cost of living index in zip code 76228: 78.8 (low, U.S. average is 100)
Land area: 184.9 sq. mi. Water area: 1.5 sq. mi.
Population density: 7 people per square mile
(very low).
OSM Map
General Map
Google Map
MSN Map
OSM Map
General Map
Google Map
MSN Map
OSM Map
General Map
Google Map
MSN Map
OSM Map
General Map
Google Map
MSN Map
Please wait while loading the map...
Real estate property taxes paid for housing units in 2022:
This zip code:
1.0% ($1,503)
Texas:
1.5% ($4,050)
Median real estate property taxes paid for housing units with mortgages in 2022: $1,476 (0.9%) Median real estate property taxes paid for housing units with no mortgage in 2022: $1,610 (1.1%)
Business Search- 14 Million verified businesses
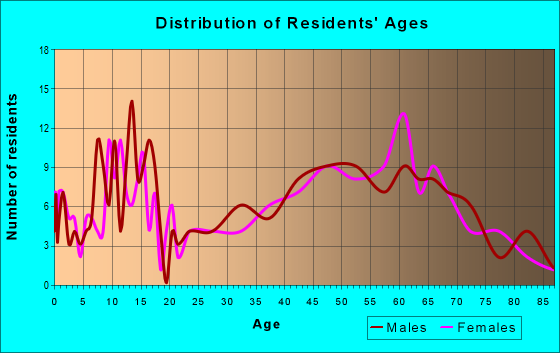
Males: 692
(53.6%)
Females: 599
(46.4%)
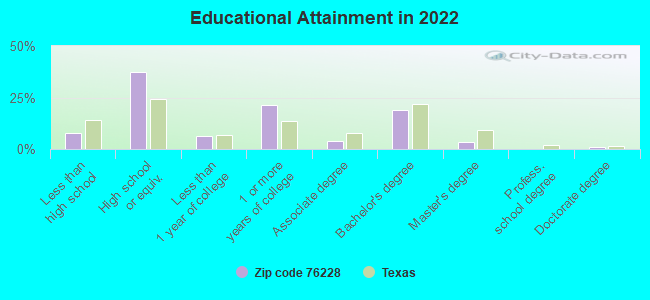
For population 25 years and over in 76228:
High school or higher: 91.2%
Bachelor's degree or higher: 23.5%
Graduate or professional degree: 4.7%
Unemployed: 1.6%
Mean travel time to work (commute): 34.7 minutes
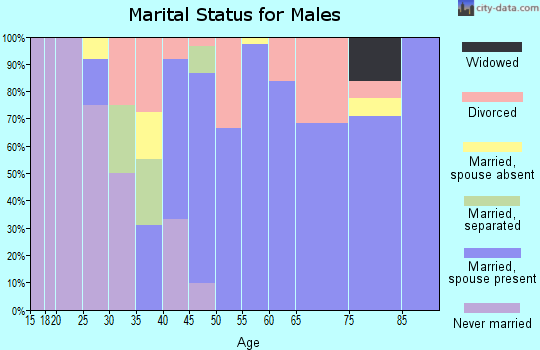
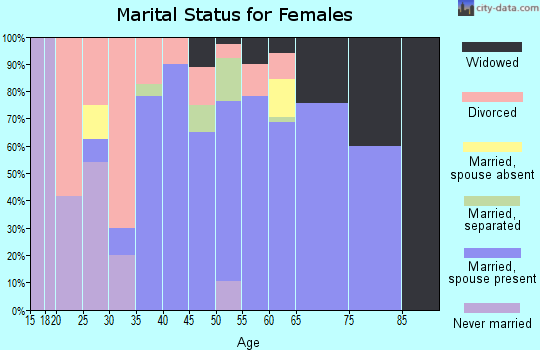
For population 15 years and over in 76228:
Never married: 22.3%
Now married: 61.5%
Separated: 1.6%
Widowed: 6.9%
Divorced: 7.7%
Zip code 76228 compared to state average:
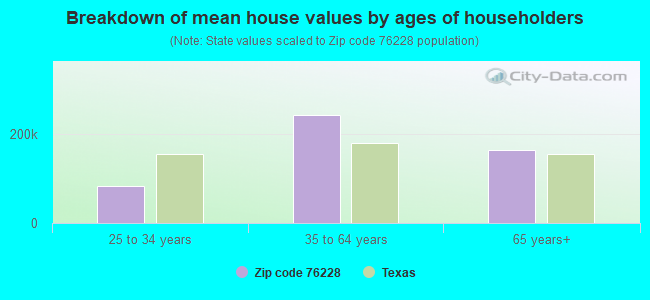
Median house value below state average.
Unemployed percentage below state average.
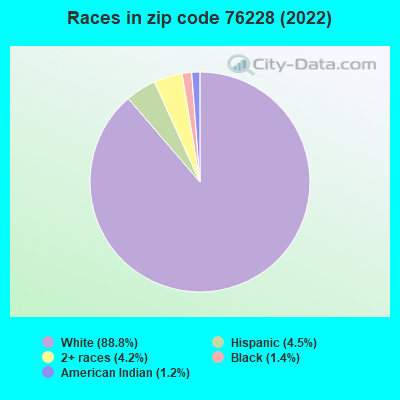
Black race population percentage significantly below state average.
Hispanic race population percentage significantly below state average.
Median age significantly above state average.
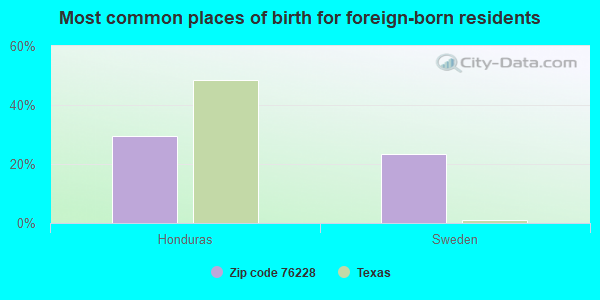
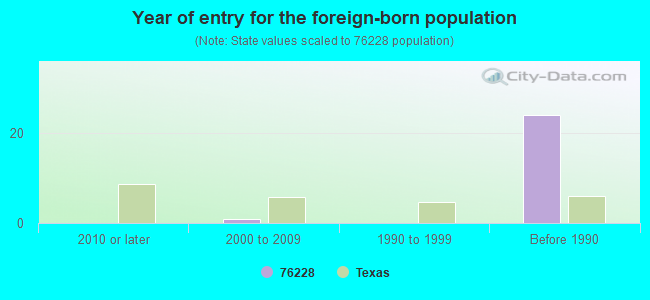
Foreign-born population percentage significantly below state average.
Renting percentage significantly below state average.
Averages for the 2020 tax year for zip code 76228, filed in 2021:
Average Adjusted Gross Income (AGI) in 2020: $57,991 (Individual Income Tax Returns)
Here:
$57,991
State:
$77,054
Salary/wage: $55,154 (reported on 76.1% of returns)
Here:
$55,154
State:
$62,766
(% of AGI for various income ranges: 1150.0% for AGIs below $25k, 3434.3% for AGIs $25k-50k, 6811.7% for AGIs $50k-75k, 11062.5% for AGIs $75k-100k, 18095.0% for AGIs $100k-200k)
Taxable interest for individuals: $600 (reported on 26.1% of returns)
This zip code:
$600
Texas:
$2,665
(% of AGI for various income ranges: 54.3% for AGIs $25k-50k, 25.0% for AGIs $50k-75k, 12.5% for AGIs $75k-100k, 35.0% for AGIs $100k-200k)
Ordinary dividends: $2,343 (reported on 15.2% of returns)
Here:
$2,343
State:
$10,044
(% of AGI for various income ranges: 21.0% for AGIs below $25k, 140.0% for AGIs $50k-75k, 147.5% for AGIs $100k-200k)
Net capital gain/loss in AGI: +$2,814 (reported on 15.2% of returns)
Here:
+$2,814
State:
+$39,590
(% of AGI for various income ranges: 42.0% for AGIs below $25k, 131.7% for AGIs $50k-75k, 190.0% for AGIs $100k-200k)
Profit/loss from business: +$9,055 (reported on 23.9% of returns)
Here:
+$9,055
State:
+$10,888
(% of AGI for various income ranges: 203.0% for AGIs below $25k, 524.3% for AGIs $25k-50k, 567.5% for AGIs $75k-100k, 497.5% for AGIs $100k-200k)
Taxable individual retirement arrangement distribution: $12,300 (reported on 6.5% of returns)
76228:
$12,300
Texas:
$24,740
(% of AGI for various income ranges: 615.0% for AGIs $50k-75k)
Earned income credit: $2,400 (reported on 15.2% of returns)
Here:
$2,400
State:
$2,584
(% of AGI for various income ranges: 101.0% for AGIs below $25k, 95.7% for AGIs $25k-50k)
Percentage of individuals using paid preparers for their 2020 taxes: 91.3%
Here:
91%
State:
92%
(% for various income ranges: 92.9% for AGIs below $25k, 90.0% for AGIs $25k-50k, 88.9% for AGIs $50k-75k, 100.0% for AGIs $75k-100k, 85.7% for AGIs $100k-200k)
Averages for the 2012 tax year for zip code 76228, filed in 2013:
Average Adjusted Gross Income (AGI) in 2012: $51,524 (Individual Income Tax Returns)
Here:
$51,524
State:
$65,384
Salary/wage: $40,963 (reported on 77.8% of returns)
Here:
$40,963
State:
$52,524
(% of AGI for various income ranges: 63.4% for AGIs below $25k, 73.3% for AGIs $25k-50k, 80.7% for AGIs $50k-75k, 87.3% for AGIs $75k-100k, 39.8% for AGIs $100k-200k)
Taxable interest for individuals: $640 (reported on 33.3% of returns)
This zip code:
$640
Texas:
$2,372
(% of AGI for various income ranges: 0.5% for AGIs below $25k, 0.6% for AGIs $25k-50k, 0.9% for AGIs $50k-75k, 0.2% for AGIs $100k-200k)
Ordinary dividends: $2,250 (reported on 13.3% of returns)
Here:
$2,250
State:
$9,721
Net capital gain/loss in AGI: +$9,867 (reported on 20.0% of returns)
Here:
+$9,867
State:
+$35,319
(% of AGI for various income ranges: 1.5% for AGIs $25k-50k, 5.0% for AGIs $50k-75k, 6.2% for AGIs $100k-200k)
Profit/loss from business: +$15,790 (reported on 22.2% of returns)
Here:
+$15,790
State:
+$13,732
(% of AGI for various income ranges: 14.8% for AGIs below $25k, 7.3% for AGIs $25k-50k, 34.8% for AGIs $75k-100k)
Taxable individual retirement arrangement distribution: $8,667 (reported on 6.7% of returns)
76228:
$8,667
Texas:
$19,511
Total itemized deductions: $21,150 (24% of AGI, reported on 17.8% of returns)
Here:
$21,150
State:
$24,724
Here:
23.5% of AGI
State:
15.9% of AGI
(% of AGI for various income ranges: 19.7% for AGIs below $25k, 12.3% for AGIs $50k-75k, 7.8% for AGIs $100k-200k)
Charity contributions: $4,300 (reported on 11.1% of returns)
Here:
$4,300
State:
$6,808
(% of AGI for various income ranges: 2.8% for AGIs $25k-50k, 1.1% for AGIs $100k-200k)
Taxes paid: $3,588 (reported on 17.8% of returns)
76228:
$3,588
State:
$6,921
(% of AGI for various income ranges: 2.9% for AGIs below $25k, 2.3% for AGIs $50k-75k, 1.3% for AGIs $100k-200k)
Earned income credit: $2,167 (reported on 20.0% of returns)
Here:
$2,167
State:
$2,570
(% of AGI for various income ranges: 8.2% for AGIs below $25k, 1.0% for AGIs $25k-50k)
Percentage of individuals using paid preparers for their 2012 taxes: 62.2%
Here:
62%
State:
51%
(% for various income ranges: 52.9% for AGIs below $25k, 63.6% for AGIs $25k-50k, 62.5% for AGIs $50k-75k, 66.7% for AGIs $75k-100k, 83.3% for AGIs $100k-200k)
Averages for the 2004 tax year for zip code 76228, filed in 2005:
Average Adjusted Gross Income (AGI) in 2004: $31,592 (Individual Income Tax Returns)
Here:
$31,592
State:
$47,881
Salary/wage: $30,911 (reported on 80.9% of returns)
Here:
$30,911
State:
$41,947
(% of AGI for various income ranges: 465.7% for AGIs below $10k, 73.4% for AGIs $10k-25k, 84.4% for AGIs $25k-50k, 81.1% for AGIs $50k-75k, 65.6% for AGIs $75k-100k)
Taxable interest for individuals: $1,066 (reported on 42.4% of returns)
This zip code:
$1,066
Texas:
$2,255
(% of AGI for various income ranges: 36.4% for AGIs below $10k, 1.7% for AGIs $10k-25k, 2.0% for AGIs $25k-50k, 1.0% for AGIs $50k-75k, 0.2% for AGIs $75k-100k)
Taxable dividends: $942 (reported on 16.1% of returns)
Here:
$942
State:
$4,261
(% of AGI for various income ranges: 0.5% for AGIs $10k-25k, 0.9% for AGIs $25k-50k, 0.3% for AGIs $50k-75k, 0.3% for AGIs $75k-100k)
Net capital gain/loss: +$3,649 (reported on 17.2% of returns)
Here:
+$3,649
State:
+$16,110
(% of AGI for various income ranges: 7.1% for AGIs below $10k, 0.4% for AGIs $10k-25k, 2.2% for AGIs $25k-50k, 4.7% for AGIs $50k-75k)
Profit/loss from business: +$7,153 (reported on 22.8% of returns)
Here:
+$7,153
State:
+$11,013
(% of AGI for various income ranges: 41.4% for AGIs below $10k, 12.3% for AGIs $10k-25k, 3.2% for AGIs $25k-50k, 8.8% for AGIs $50k-75k, 0.0% for AGIs $75k-100k)
IRA payment deduction: $2,588 (reported on 4.0% of returns)
76228:
$2,588
Texas:
$3,120
Total itemized deductions: $14,922 (28% of AGI, reported on 11.9% of returns)
Here:
$14,922
State:
$19,631
Here:
27.9% of AGI
State:
18.9% of AGI
Charity contributions deductions: $3,925 (7% of AGI, reported on 9.3% of returns)
Here:
$3,925
State:
$4,753
Here:
7.3% of AGI
State:
4.2% of AGI
Total tax: $3,908 (reported on 70.9% of returns)
76228:
$3,908
State:
$9,058
(% of AGI for various income ranges: 25.3% for AGIs below $10k, 4.8% for AGIs $10k-25k, 6.1% for AGIs $25k-50k, 9.1% for AGIs $50k-75k, 12.4% for AGIs $75k-100k)
Earned income credit: $1,684 (reported on 18.4% of returns)
Here:
$1,684
State:
$2,024
Percentage of individuals using paid preparers for their 2004 taxes: 70.2%
Here:
70%
State:
57%
(% for various income ranges: 69.7% for AGIs below $10k, 65.0% for AGIs $10k-25k, 73.1% for AGIs $25k-50k, 64.9% for AGIs $50k-75k, 83.3% for AGIs $75k-100k)
Likely homosexual households (counted as self-reported same-sex unmarried-partner households)
Lesbian couples: 0.0% of all households
Gay men: 0.4% of all households
Household received Food Stamps/SNAP in the past 12 months: 37 Household did not receive Food Stamps/SNAP in the past 12 months: 487
Women who had a birth in the past 12 months: 15 (12 now married, 2 unmarried) Women who did not have a birth in the past 12 months: 214 (114 now married, 100 unmarried)
Housing units in zip code 76228 with a mortgage: 153 (1 both second mortgage and home equity loan) Median monthly owner costs for units with a mortgage: $1,215 Median monthly owner costs for units without a mortgage: $495
Residents with income below the poverty level in 2022:
This zip code:
12.8%
Whole state:
14.0%
Residents with income below 50% of the poverty level in 2022:
This zip code:
4.8%
Whole state:
7.4%
Median number of rooms in houses and condos:
Here:
5.8
State:
6.3
Median number of rooms in apartments:
Here:
5.8
State:
4.0
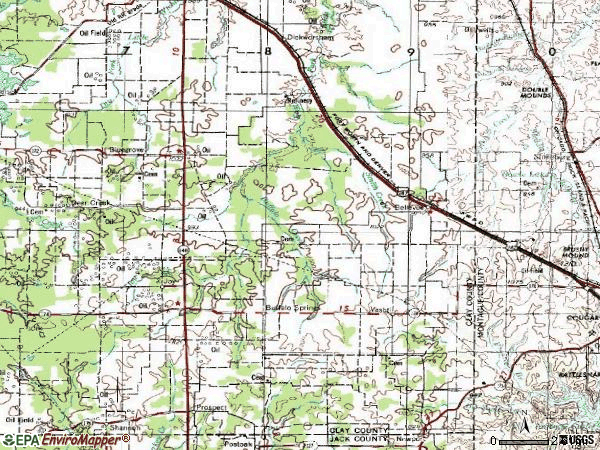
Notable locations in this zip code not listed on our city pages
Notable locations in zip code 76228: Alice Public Library (A), Vashti Volunteer Fire Department (B), Bellevue Volunteer Fire Department (C). Display/hide their locations on the map
Reservoirs: Soil Conservation Service Site 2 Reservoir (A), Hapgood Lake (B), Plaxco Lake (C), Dickson Lake (D), Scott Lake (E), Bowie Lake (F). Display/hide their locations on the map
Size of family households: 213 2-persons, 98 3-persons, 49 4-persons, 15 5-persons, 15 6-persons, 4 7-or-more-persons
Size of nonfamily households: 120 1-person, 4 2-persons, 5 4-persons
170 married couples with children.
37 single-parent households (12 men, 25 women).
95.0% of residents of 76228 zip code speak English at home.
2.3% of residents speak Spanish at home (69% very well, 31% well).
3.1% of residents speak other Indo-European language at home (97% very well, 3% well).
Foreign born population: 18 (1.4%) (67.1% of them are naturalized citizens)
This zip code:
1.4%
Whole state:
17.2%
29%Honduras
24%Sweden
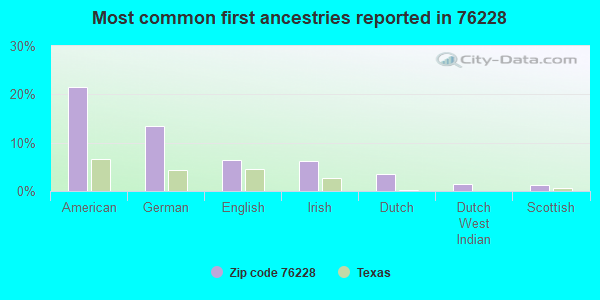
22%American
14%German
6%English
6%Irish
4%Dutch
2%Dutch West Indian
1%Scottish
Year of entry for the foreign-born population
02010 or later
12000 to 2009
01990 to 1999
24Before 1990
Housing units lacking complete plumbing facilities: 7.9% Housing units lacking complete kitchen facilities: 5.0%
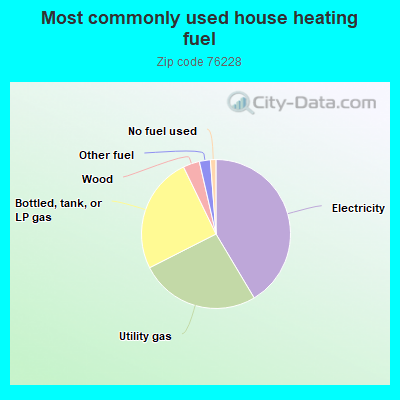
41.6%Electricity
26.2%Utility gas
25.4%Bottled, tank, or LP gas
3.6%Wood
2.4%Other fuel
1.2%No fuel used
Population in 1990: 1,697.
Place of birth for U.S.-born residents:
This state: 1,069
Northeast: 8
Midwest: 63
South: 73
West: 36
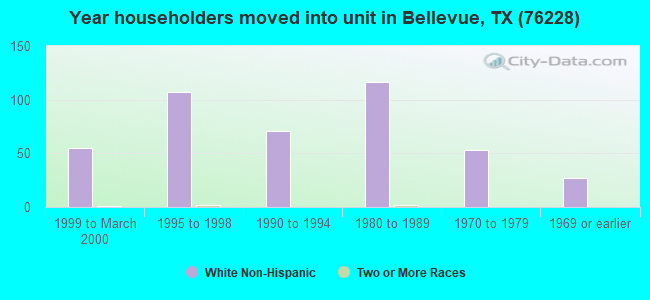
65% of the 76228 zip code residents lived in the same house 5 years ago. Out of people who lived in different houses, 43% lived in this county. Out of people who lived in different counties, 50% lived in Texas.
96% of the 76228 zip code residents lived in the same house 1 year ago. Out of people who lived in different houses, 35% moved from this county. Out of people who lived in different houses, 70% moved from different county within same state.
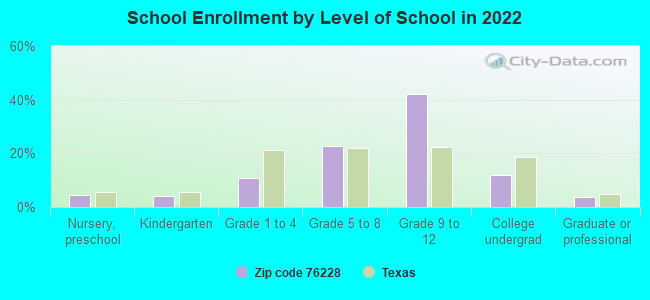
Private vs. public school enrollment:
Students in private schools in grades 1 to 8 (elementary and middle school): 10
Here:
11.3%
Texas:
8.8%
Students in private schools in grades 9 to 12 (high school): 40
Here:
35.4%
Texas:
8.0%
Students in private undergraduate colleges:
Here:
0.0%
Texas:
16.2%
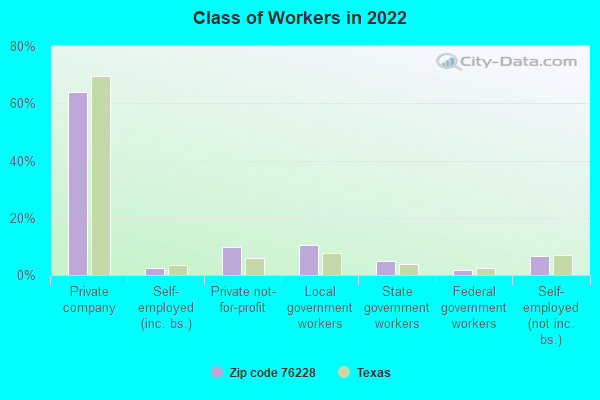
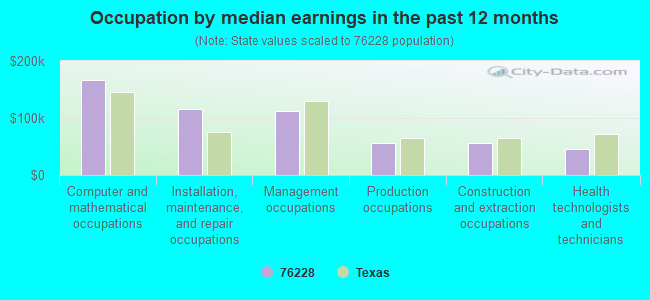
Occupation by median earnings in the past 12 months ($)
166,610Computer and mathematical occupations
116,257Installation, maintenance, and repair occupations
111,525Management occupations
55,830Production occupations
55,337Construction and extraction occupations
45,813Health technologists and technicians
Top industries in this zip code by the number of employees in 2005:
Accommodation and Food Services: Full-Service Restaurants (10-19 employees: 1 establishment)
Health Care and Social Assistance: Child Day Care Services (5-9: 1)
Construction: Structural Steel and Precast Concrete Contractors (5-9: 1)
Other Services (except Public Administration): Religious Organizations (1-4: 1)
Real Estate and Rental and Leasing: Video Tape and Disc Rental (1-4: 1)
Fatal accident statistics in 2014:
Fatal accident count: 3
Vehicles involved in fatal accidents: 4
Fatal accidents caused by drunken drivers: 1
Fatalities: 3
Persons involved in fatal accidents: 8
Pedestrians involved in fatal accidents: 1
Fatal accident statistics in 2013:
Fatal accident count: 1
Vehicles involved in fatal accidents: 1
Fatal accidents caused by drunken drivers: 0
Fatalities: 1
Persons involved in fatal accidents: 2
Pedestrians involved in fatal accidents: 0
2002 - 2018 National Fire Incident Reporting System (NFIRS) incidents
Based on the data from the years 2002 - 2018 the average number of fire incidents per year is 18. The highest number of reported fires - 72 took place in 2009, and the least - 0 in 2013. The data has a declining trend.
When looking into fire subcategories, the most reports belonged to: Outside Fires (66.3%), and Structure Fires (23.7%).
Fire incident types reported to NFIRS in Zip Code 76228
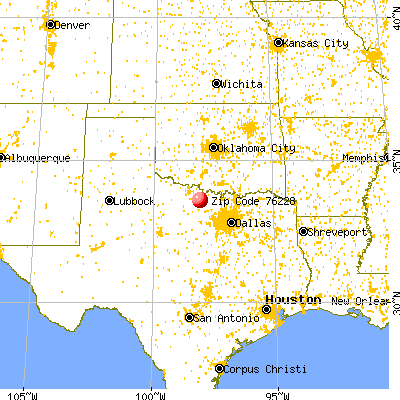


 Nearest zip codes: 76230, 76365, 76261, 76270, 76431, 76251.


 Based on the data from the years 2002 - 2018 the average number of fire incidents per year is 18. The highest number of reported fires - 72 took place in 2009, and the least - 0 in 2013. The data has a declining trend.
 When looking into fire subcategories, the most reports belonged to: Outside Fires (66.3%), and Structure Fires (23.7%).