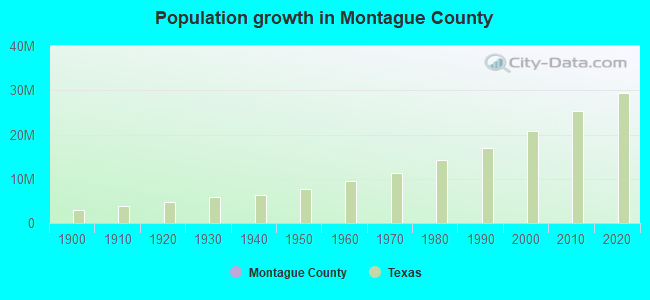
Montague County, Texas (TX)
County owner-occupied free and clear houses and condos in 2010: 3,454
County owner-occupied houses and condos in 2000: 6,118
Renter-occupied apartments: 1,743 (it was 1,652 in 2000)
| % of renters here: | 21% |
| State: | 36% |
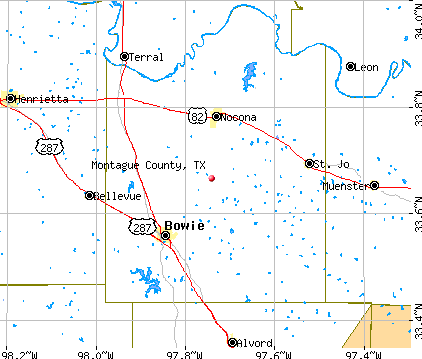
Land area: 931 sq. mi.
Water area: 7.8 sq. mi.
Population density: 22 people per square mile (low).
Industries providing employment: Educational, health and social services (22.2%), Retail trade (14.9%).
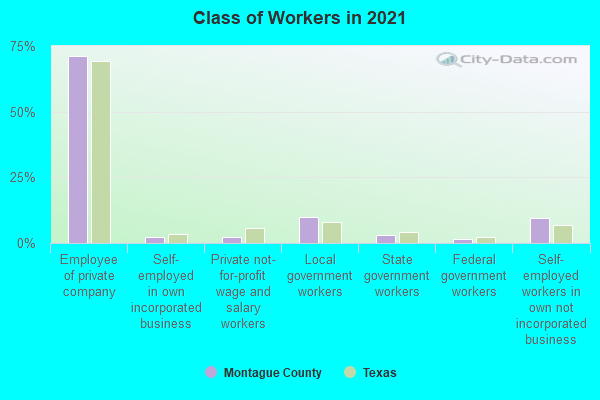
Type of workers:
- Private wage or salary: 75%
- Government: 14%
- Self-employed, not incorporated: 11%
- Unpaid family work: 0%
- OSM Map
- General Map
- Google Map
- MSN Map

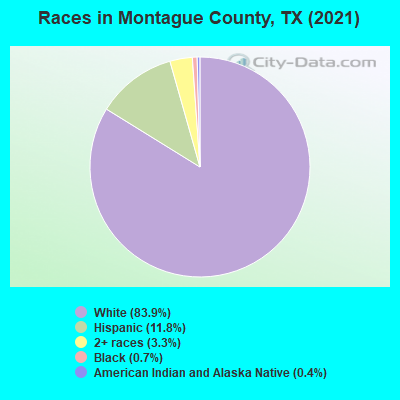
- 17,04583.8%White Non-Hispanic Alone
- 2,41911.9%Hispanic or Latino
- 6233.1%Two or more races
- 1610.8%Black Non-Hispanic Alone
- 880.4%American Indian and Alaska Native alone
| Median resident age: | 44.6 years |
| Texas median age: | 35.6 years |
| Males: 10,084 | |
| Females: 10,656 |

 | New County Population Estimates from the Census Bureau for Jluy 1, 2016 posted this morning about 9 A. M. (13 replies) |
| The Story Behind Manchaca Rd misspelling/pronunciation (19 replies) |
| mineral rights Montague County (25 replies) |
| The Big Industries of Texas poll! (35 replies) |
| Colorado City Pronunciation (44 replies) |
| Questions about Weatherford (82 replies) |
| Montague County: | 2.0 people |
| Texas: | 3 people |
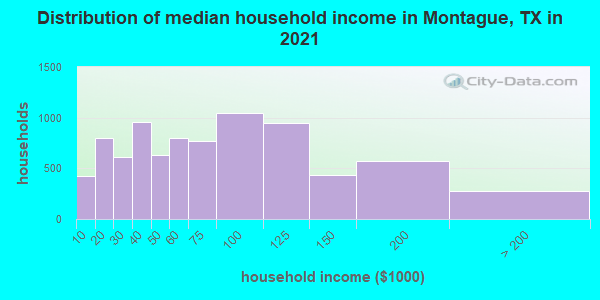
Estimated median household income in 2022: $62,684 ($31,048 in 1999)
| This county: | $62,684 |
| Texas: | $72,284 |
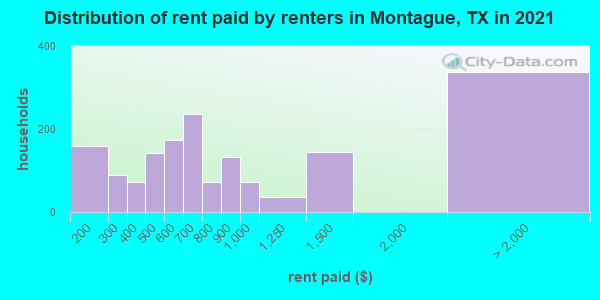
Median contract rent in 2022 for apartments: $706 (lower quartile is $411, upper quartile is $998)
| This county: | $706 |
| State: | $1117 |
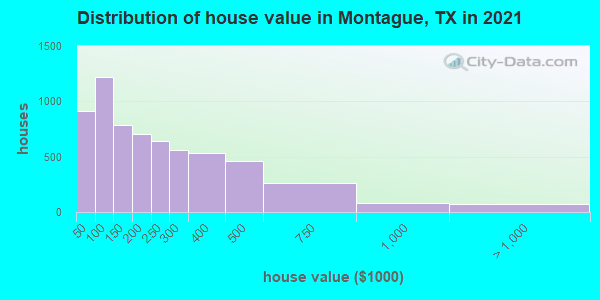
Estimated median house or condo value in 2022: $193,127 (it was $56,300 in 2000)
| Montague: | $193,127 |
| Texas: | $275,400 |
Mean price in 2022:
Median monthly housing costs for homes and condos with a mortgage: $1,347Detached houses: $284,997
Here: $284,997 State: $369,058 Townhouses or other attached units: $107,443
Here: $107,443 State: $327,631 Mobile homes: $115,690
Here: $115,690 State: $124,413 Occupied boats, RVs, vans, etc.: $259,406
Here: $259,406 State: $73,921
Median monthly housing costs for units without a mortgage: $546
Institutionalized population: 234
Crime in 2021 (reported by the sheriff's office or county police, not the county total):
- Murders: 0
- Rapes: 6
- Robberies: 1
- Assaults: 15
- Burglaries: 24
- Thefts: 69
- Auto thefts: 4
Crime in 2020 (reported by the sheriff's office or county police, not the county total):
- Murders: 0
- Rapes: 4
- Robberies: 1
- Assaults: 13
- Burglaries: 38
- Thefts: 56
- Auto thefts: 6
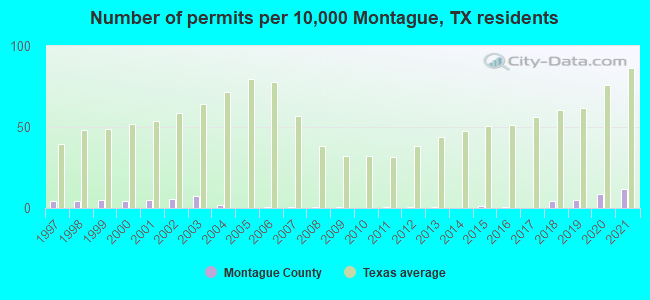
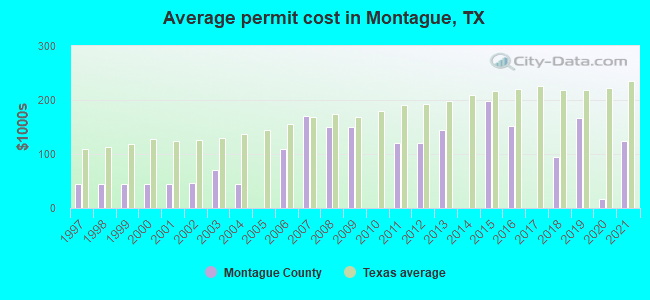
Single-family new house construction building permits:
- 2022: 28 buildings, average cost: $124,400
- 2021: 22 buildings, average cost: $125,400
- 2020: 16 buildings, average cost: $16,000
- 2019: 9 buildings, average cost: $166,700
- 2018: 8 buildings, average cost: $93,800
- 2017: 0 buildings
- 2016: 1 building, cost: $152,200
- 2015: 2 buildings, average cost: $197,500
- 2014: 0 buildings
- 2013: 1 building, cost: $144,000
- 2012: 1 building, cost: $120,000
- 2011: 1 building, cost: $120,000
- 2010: 0 buildings
- 2009: 1 building, cost: $150,000
- 2008: 1 building, cost: $150,000
- 2007: 1 building, cost: $170,500
- 2006: 1 building, cost: $110,000
- 2005: 0 buildings
- 2004: 3 buildings, average cost: $44,200
- 2003: 14 buildings, average cost: $71,100
- 2002: 11 buildings, average cost: $47,100
- 2001: 9 buildings, average cost: $45,000
- 2000: 8 buildings, average cost: $45,000
- 1999: 9 buildings, average cost: $45,000
- 1998: 8 buildings, average cost: $45,000
- 1997: 8 buildings, average cost: $45,000
Median real estate property taxes paid for housing units with mortgages in 2022: $2,045 (0.9%)
Median real estate property taxes paid for housing units with no mortgage in 2022: $1,634 (0.9%)
| Montague County: | 13.0% |
| Texas: | 14.0% |
Median age of residents in 2022: 44.6 years old
(Males: 43.9 years old, Females: 45.2 years old)
(Median age for: White residents: 47.1 years old, Black residents: 45.7 years old, American Indian residents: 57.4 years old, Hispanic or Latino residents: 26.2 years old, Other race residents: 22.9 years old)
Fair market rent in 2006 for a 1-bedroom apartment in Montague County is $468 a month.
Fair market rent for a 2-bedroom apartment is $522 a month.
Fair market rent for a 3-bedroom apartment is $659 a month.
Cities in this county include: Bowie, Nocona, Montague-Forestburg, St. Jo, Nocona Hills, Sunset, Montague.
Neighboring counties: Maricopa County, Arizona  , Carroll County, Mississippi
  , Jefferson County, Oklahoma
  , Miller County, Arkansas , Sunflower County, Mississippi , Webster County, Mississippi .
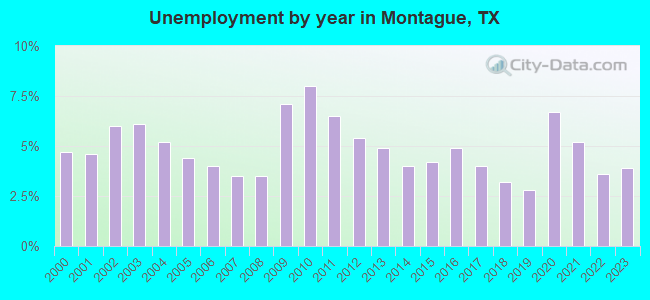
| Here: | 3.3% |
| Texas: | 3.5% |
Current college students: 446
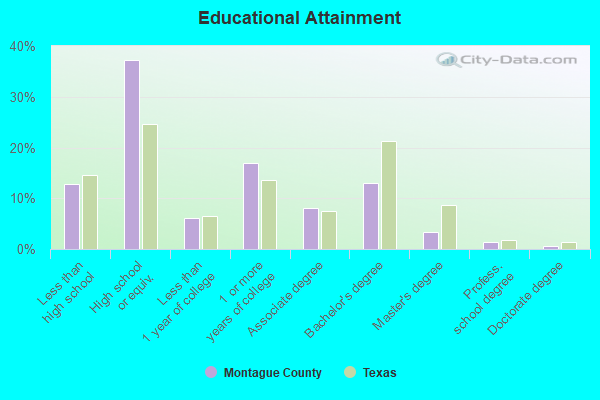
People 25 years of age or older with a high school degree or higher: 88.0%
People 25 years of age or older with a bachelor's degree or higher: 16.7%
Number of foreign born residents: 640 (18.6% naturalized citizens)
| Montague County: | 3.1% |
| Whole state: | 17.2% |
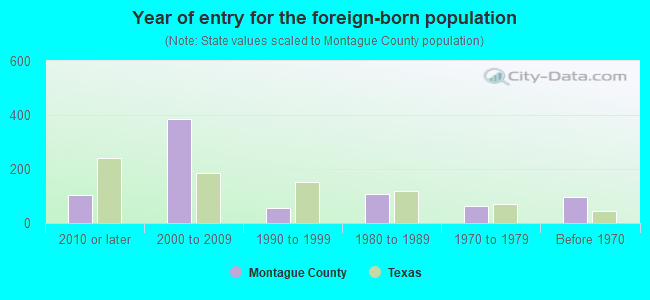
- Year of entry for the foreign-born population
- 1282010 or later
- 3422000 to 2009
- 571990 to 1999
- 1081980 to 1989
- 621970 to 1979
- 95Before 1970
Mean travel time to work (commute): minutes
Percentage of county residents living and working in this county: 97.9%


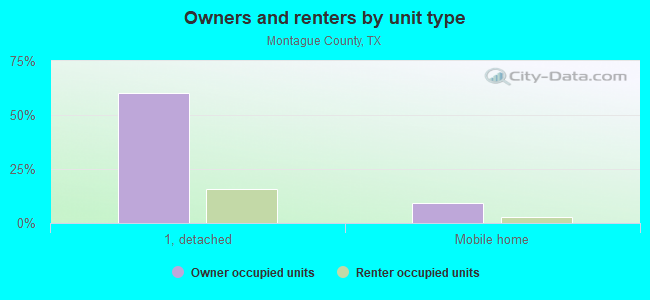
Housing units in structures:
- One, detached: 8,355
- One, attached: 107
- Two: 221
- 3 or 4: 149
- 5 to 9: 81
- 10 to 19: 8
- 20 or more: 71
- Mobile homes: 1,547
- Boats, RVs, vans, etc.: 69
Housing units in Montague County with a mortgage: 2,691 (64 second mortgage, 0 home equity loan, 61 both second mortgage and home equity loan)
Houses without a mortgage: 68
| Here: | 2.9% with mortgage |
| State: | 98.4% with mortgage |
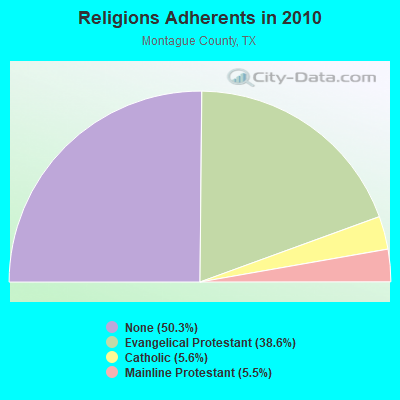
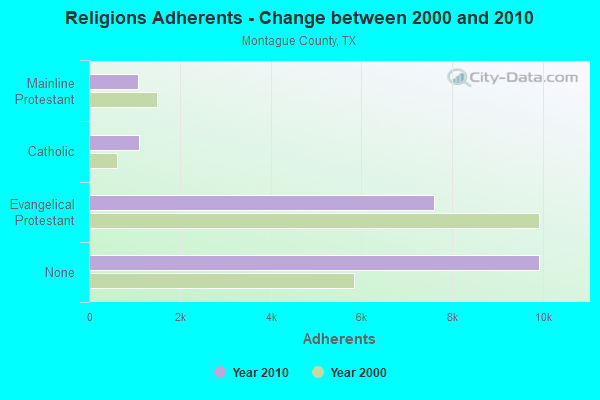
Religion statistics for Montague County
| Religion | Adherents | Congregations |
|---|---|---|
| Evangelical Protestant | 7,602 | 56 |
| Catholic | 1,110 | 3 |
| Mainline Protestant | 1,081 | 10 |
| Other | 1 | 1 |
| None | 9,925 | - |
Source: Clifford Grammich, Kirk Hadaway, Richard Houseal, Dale E.Jones, Alexei Krindatch, Richie Stanley and Richard H.Taylor. 2012. 2010 U.S.Religion Census: Religious Congregations & Membership Study. Association of Statisticians of American Religious Bodies. Jones, Dale E., et al. 2002. Congregations and Membership in the United States 2000. Nashville, TN: Glenmary Research Center.
Food Environment Statistics:
| Montague County: | 2.04 / 10,000 pop. |
| State: | 1.47 / 10,000 pop. |
| This county: | 2.04 / 10,000 pop. |
| Texas: | 1.11 / 10,000 pop. |
| Montague County: | 3.57 / 10,000 pop. |
| Texas: | 3.95 / 10,000 pop. |
| This county: | 3.57 / 10,000 pop. |
| State: | 6.13 / 10,000 pop. |
| Montague County: | 10.8% |
| Texas: | 8.9% |
| Montague County: | 26.4% |
| State: | 26.6% |
| Here: | 12.4% |
| State: | 15.7% |
Agriculture in Montague County:
Average size of farms: 360 acresAverage value of agricultural products sold per farm: $22,782
Average value of crops sold per acre for harvested cropland: $75.47
The value of nursery, greenhouse, floriculture, and sod as a percentage of the total market value of agricultural products sold: 1.85%
The value of livestock, poultry, and their products as a percentage of the total market value of agricultural products sold: 88.22%
Average total farm production expenses per farm: $22,737
Harvested cropland as a percentage of land in farms: 9.88%
Irrigated harvested cropland as a percentage of land in farms: 1.04%
Average market value of all machinery and equipment per farm: $33,400
The percentage of farms operated by a family or individual: 91.57%
Average age of principal farm operators: 56 years
Average number of cattle and calves per 100 acres of all land in farms: 15.96
Milk cows as a percentage of all cattle and calves: 1.23%
Corn for grain: 220 harvested acres
All wheat for grain: 5820 harvested acres
Vegetables: 343 harvested acres
Land in orchards: 2,885 acres
Earthquake activity:
Montague County-area historical earthquake activity is significantly above Texas state average. It is 579% greater than the overall U.S. average.On 11/6/2011 at 03:53:10, a magnitude 5.7 (5.7 MW, Depth: 3.2 mi, Class: Moderate, Intensity: VI - VII) earthquake occurred 140.7 miles away from Montague County center
On 9/3/2016 at 12:02:44, a magnitude 5.8 (5.8 MW, Depth: 3.5 mi) earthquake occurred 196.4 miles away from the county center
On 6/16/1978 at 11:46:54, a magnitude 5.3 (4.4 MB, 4.6 UK, 5.3 ML) earthquake occurred 180.1 miles away from the county center
On 11/7/2016 at 01:44:24, a magnitude 5.0 (5.0 MW, Depth: 2.8 mi) earthquake occurred 169.5 miles away from the county center
On 11/8/2011 at 02:46:57, a magnitude 4.8 (4.8 MW, Depth: 3.1 mi, Class: Light, Intensity: IV - V) earthquake occurred 140.1 miles away from Montague County center
On 11/5/2011 at 07:12:45, a magnitude 4.8 (4.8 MW, Depth: 1.9 mi) earthquake occurred 141.8 miles away from the county center
Magnitude types: body-wave magnitude (MB), local magnitude (ML), moment magnitude (MW)
Most recent natural disasters:
- Texas Covid-19 Pandemic, Incident Period: January 20, 2020, FEMA Id: 4485, Natural disaster type: Other
- Texas Severe Storms, Tornadoes, Straight-line Winds, and Flooding, Incident Period: May 04, 2015 to June 23, 2015, Major Disaster (Presidential) Declared DR-4223: May 29, 2015, FEMA Id: 4223, Natural disaster type: Storm, Tornado, Flood, Wind
- Texas Wildfires, Incident Period: August 30, 2011 to December 31, 2011, Major Disaster (Presidential) Declared DR-4029: September 09, 2011, FEMA Id: 4029, Natural disaster type: Fire
- Texas Wildfires, Incident Period: March 14, 2008 to September 01, 2008, Emergency Declared EM-3284: March 14, 2008, FEMA Id: 3284, Natural disaster type: Fire
- Texas Severe Storms, Tornadoes, and Flooding, Incident Period: June 16, 2007 to August 03, 2007, Major Disaster (Presidential) Declared DR-1709: June 29, 2007, FEMA Id: 1709, Natural disaster type: Storm, Tornado, Flood
- Texas Ringgold Fire, Incident Period: January 01, 2006, Fire Management Assistance Declared: January 01, 2006, FEMA Id: 2598, Natural disaster type: Fire
- Texas Extreme Wildfire Threat, Incident Period: November 27, 2005 to May 14, 2006, Major Disaster (Presidential) Declared DR-1624: January 11, 2006, FEMA Id: 1624, Natural disaster type: Fire
- Texas Hurricane Rita, Incident Period: September 23, 2005 to October 14, 2005, Major Disaster (Presidential) Declared DR-1606: September 24, 2005, FEMA Id: 1606, Natural disaster type: Hurricane
- Texas Hurricane Rita, Incident Period: September 20, 2005 to October 14, 2005, Emergency Declared EM-3261: September 21, 2005, FEMA Id: 3261, Natural disaster type: Hurricane
- Texas Hurricane Katrina, Incident Period: August 29, 2005 to October 01, 2005, Emergency Declared EM-3216: September 02, 2005, FEMA Id: 3216, Natural disaster type: Hurricane
- 6 other natural disasters have been reported since 1953.
The number of natural disasters in Montague County (16) is near the US average (15).
Major Disasters (Presidential) Declared: 9
Emergencies Declared: 5
Causes of natural disasters: Fires: 6, Floods: 5, Storms: 5, Tornadoes: 4, Hurricanes: 3, Wind: 1, Winter Storm: 1, Other: 1 (Note: some incidents may be assigned to more than one category).
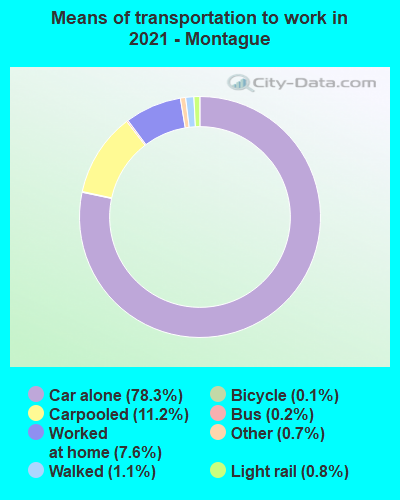
Means of transportation to work:
- Drove a car alone: 4,602 (72.9%)
- Carpooled: 747 (11.8%)
- Bus: 10 (0.2%)
- Taxicab, motorcycle, or other means: 46 (0.7%)
- Bicycle: 5 (0.1%)
- Walked: 70 (1.1%)
- Worked at home: 800 (12.7%)
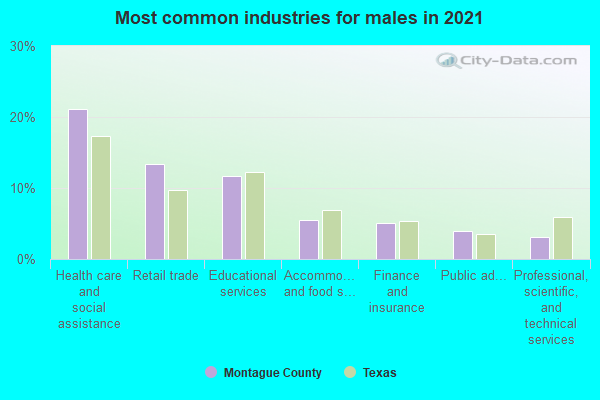
- Health care and social assistance (22%)
- Educational services (13%)
- Retail trade (11%)
- Accommodation and food services (6%)
- Finance and insurance (6%)
- Professional, scientific, and technical services (4%)
- Arts, entertainment, and recreation (3%)
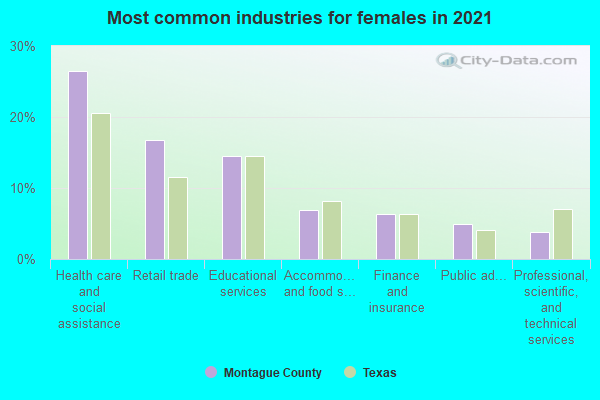
- Health care and social assistance (28%)
- Educational services (16%)
- Retail trade (14%)
- Accommodation and food services (8%)
- Finance and insurance (7%)
- Professional, scientific, and technical services (4%)
- Arts, entertainment, and recreation (3%)
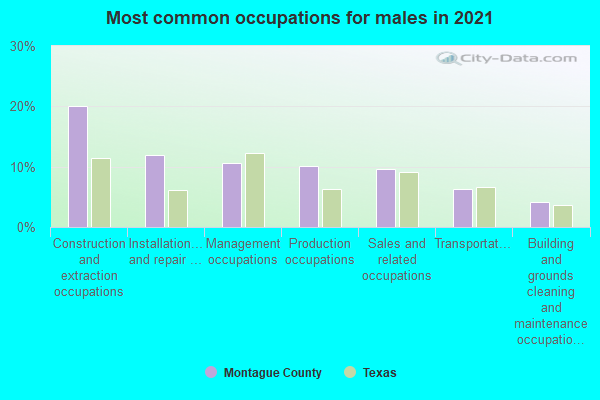
- Construction and extraction occupations (19%)
- Sales and related occupations (11%)
- Installation, maintenance, and repair occupations (10%)
- Production occupations (10%)
- Management occupations (9%)
- Transportation occupations (8%)
- Material moving occupations (4%)
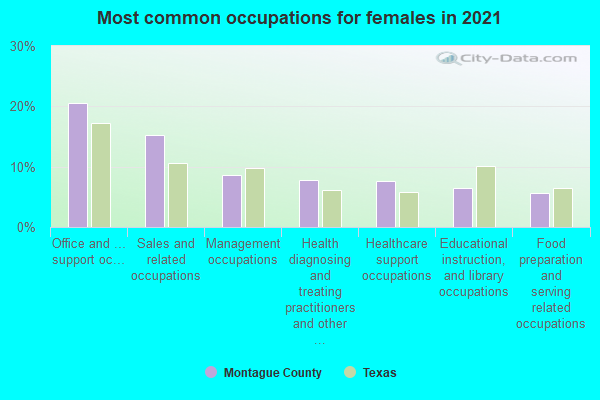
- Office and administrative support occupations (20%)
- Sales and related occupations (14%)
- Management occupations (10%)
- Healthcare support occupations (8%)
- Educational instruction, and library occupations (7%)
- Food preparation and serving related occupations (7%)
- Health technologists and technicians (5%)
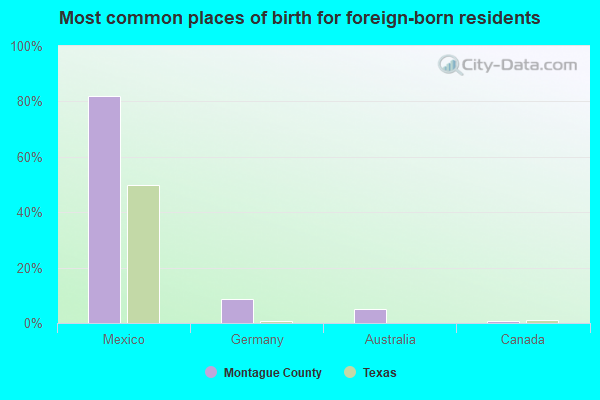
- Mexico (83%)
- Australia (5%)
- Germany (5%)
- Panama (1%)
- Canada (1%)
- England (0%)
- United Kingdom, excluding England and Scotland (0%)
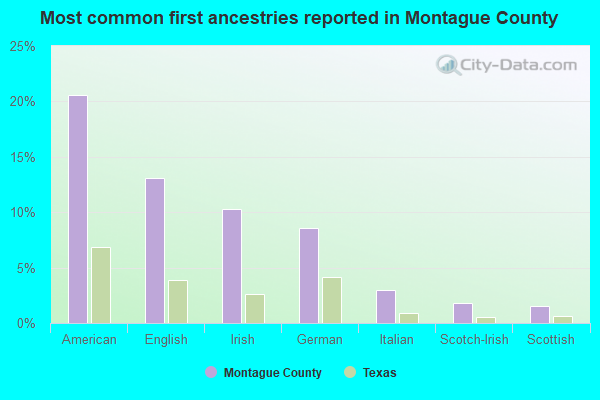
- American (21%)
- English (13%)
- German (10%)
- Irish (10%)
- Italian (3%)
- Scotch-Irish (2%)
- Scottish (1%)

People in group quarters in Montague County, Texas in 2010:
- 183 people in nursing facilities/skilled-nursing facilities
- 51 people in local jails and other municipal confinement facilities
- 30 people in group homes intended for adults
- 2 people in emergency and transitional shelters (with sleeping facilities) for people experiencing homelessness
People in group quarters in Montague County, Texas in 2000:
- 331 people in nursing homes
- 38 people in local jails and other confinement facilities (including police lockups)
- 34 people in homes for the mentally retarded
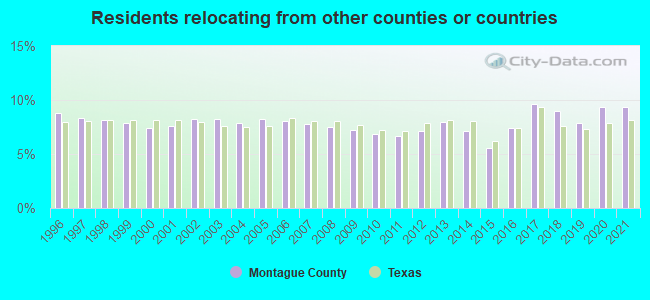
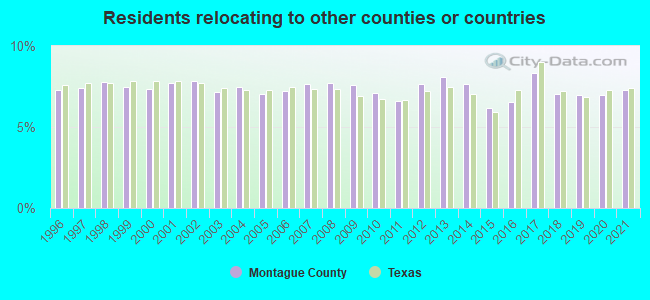
9.36% of this county's 2021 resident taxpayers lived in other counties in 2020 ($57,986 average adjusted gross income)
| Here: | 9.36% |
| Texas average: | 8.12% |
10 or fewer of this county's residents moved from foreign countries.
7.71% relocated from other counties in Texas ($46,047 average AGI)
1.65% relocated from other states ($11,939 average AGI)
Montague County: 1.65% Texas average: 2.83%
Top counties from which taxpayers relocated into this county between 2020 and 2021:
| from Wise County, TX | |
| from Tarrant County, TX | |
| from Denton County, TX | |
| from Cooke County, TX | |
| from Wichita County, TX | |
| from Dallas County, TX | |
| from Collin County, TX |
7.30% of this county's 2020 resident taxpayers moved to other counties in 2021 ($60,409 average adjusted gross income)
| Here: | 7.30% |
| Texas average: | 7.40% |
10 or fewer of this county's residents moved to foreign countries.
6.03% relocated to other counties in Texas ($53,796 average AGI)
1.27% relocated to other states ($6,615 average AGI)
Montague County: 1.27% Texas average: 2.08%
Top counties to which taxpayers relocated from this county between 2020 and 2021:
| to Wise County, TX | |
| to Denton County, TX | |
| to Wichita County, TX | |
| to Cooke County, TX | |
| to Tarrant County, TX | |
| to Clay County, TX | |
| to Dallas County, TX |
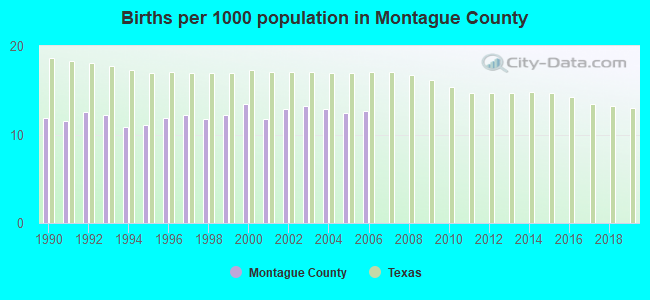
Births per 1000 population from 1990 to 1999: 11.8
Births per 1000 population from 2000 to 2006: 12.8
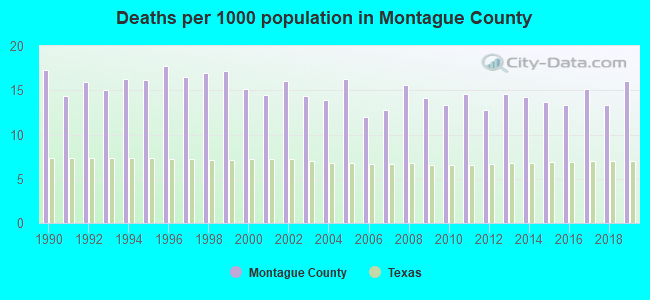
Deaths per 1000 population from 1990 to 1999: 16.3
Deaths per 1000 population from 2000 to 2009: 14.5
Deaths per 1000 population from 2010 to 2020: 14.5
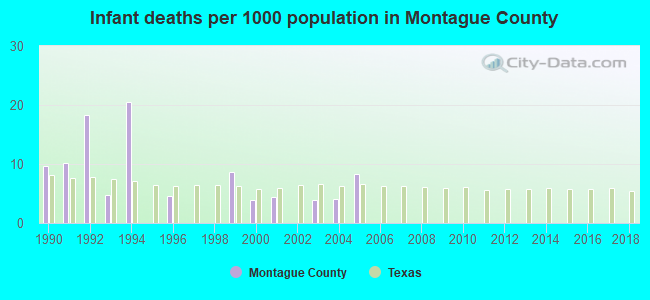
Infant deaths per 1000 live births from 1990 to 1999: 7.7
Infant deaths per 1000 live births from 2000 to 2006: 3.5
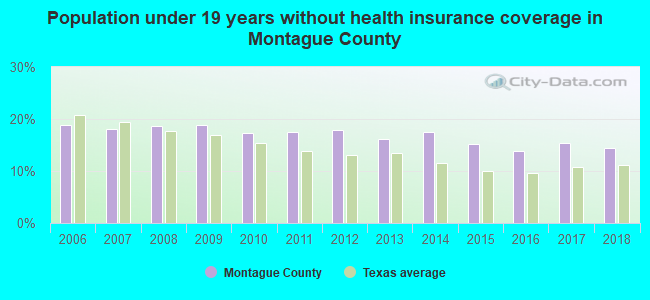
Persons under 19 years old without health insurance coverage in 2018: 14.5%
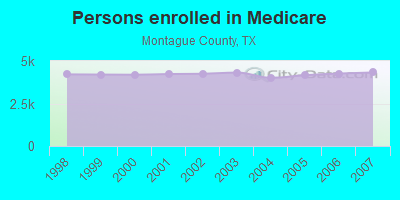
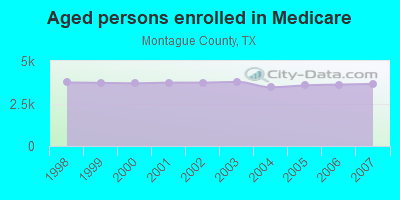
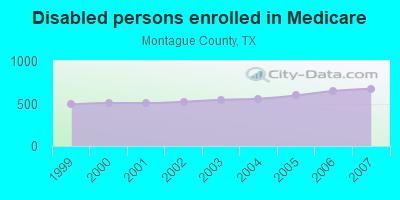
Persons enrolled in hospital insurance and/or supplemental medical insurance (Medicare) in July 1, 2007: 4,325 (3,651 aged, 674 disabled)
Children under 18 without health insurance coverage in 2007: 799 (17%)
Most common underlying causes of death in Montague County, Texas in 1999 - 2019:
- Acute myocardial infarction, unspecified (530)
- Bronchus or lung, unspecified - Malignant neoplasms (372)
- Atherosclerotic heart disease (272)
- Stroke, not specified as haemorrhage or infarction (250)
- Congestive heart failure (217)
- Chronic obstructive pulmonary disease, unspecified (210)
- Alzheimer disease, unspecified (120)
- Unspecified dementia (88)
- Pneumonia, unspecified (74)
- Atherosclerotic cardiovascular disease, so described (50)
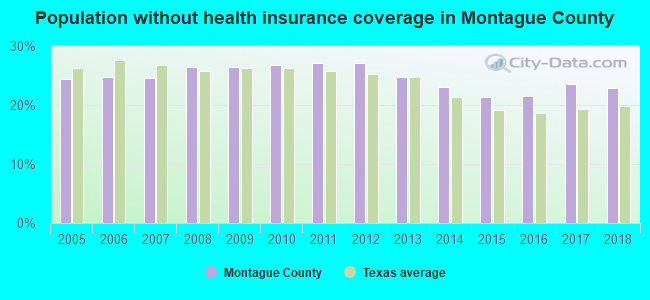
Population without health insurance coverage in 2000: 17%
Children under 18 without health insurance coverage in 2000: 15%
Short term general hospital admissions per 100,000 population in 2004: 14,418
Short term general hospital beds per 100,000 population in 2004: 395
Emergency room visits per 100,000 population in 2004: 43,424
General practice office based MDs per 100,000 population in 2005: 1,255
Medical specialist MDs per 100,000 population in 2005: 1,387
Total births per 100,000 population, July 2005 - July 2006 : 27
Total deaths per 100,000 population, July 2005 - July 2006: 61
Limited-service eating places per 100,000 population in 2005 : 15
Suicides per 1,000,000 population from 2000 to 2006: 185.2. This is more than state average.
Household type by relationship:
Households: 20,740- Male householders: 3,832 (934 living alone), Female householders: 4,530 (1,209 living alone)
4,557 spouses (4,536 opposite-sex spouses), 502 unmarried partners, (472 opposite-sex unmarried partners), 5,752 children (4,971 natural, 266 adopted, 518 stepchildren), 456 grandchildren, 76 brothers or sisters, 82 parents, 20 foster children, 193 other relatives, 464 non-relatives
- In group quarters: 362
Size of family households: 2,710 2-persons, 1,307 3-persons, 972 4-persons, 462 5-persons, 152 6-persons, 68 7-or-more-persons.
Size of nonfamily households: 2,143 1-person, 550 2-persons, 11 3-persons, 3 4-persons.
2,981 married couples with children.
1,240 single-parent households (415 men, 825 women).
92.3% of residents of Montague speak English at home.
7.4% of residents speak Spanish at home (71% speak English very well, 19% speak English well, 10% speak English not well).
0.4% of residents speak other Indo-European language at home (71% speak English very well, 18% speak English well, 10% speak English not well).
In fiscal year 2004:
Federal Government expenditure: $122,575,000 ($6,285 per capita)
Department of Defense expenditure: $4,072,000
Federal direct payments to individuals for retirement and disability: $65,860,000
Federal other direct payments to individuals: $32,818,000
Federal direct payments not to individuals: $878,000
Federal grants: $18,289,000
Federal procurement contracts: $1,010,000 ($82,000 Department of Defense)
Federal salaries and wages: $3,721,000 ($0,000 Department of Defense)
Federal Government direct loans: $0,000
Federal guaranteed/insured loans: $6,570,000
Federal Government insurance: $5,087,000
Population change from April 1, 2000 to July 1, 2005:
Births: 1,308| Here: | 66 per 1000 residents |
| State: | 85 per 1000 residents |
Deaths: 1,482
| Here: | 75 per 1000 residents |
| State: | 35 per 1000 residents |
Net international migration: +72
| Here: | +4 per 1000 residents |
| State: | +29 per 1000 residents |
Net internal migration: +699
| Here: | +36 per 1000 residents |
| State: | +10 per 1000 residents |
Total withdrawal of fresh water for public supply: 1.87 millions of gallons per day (17% from ground, 83% from surface)
| Here: | 5.8 |
| State: | 6.3 |
| Here: | 4.5 |
| State: | 4.0 |
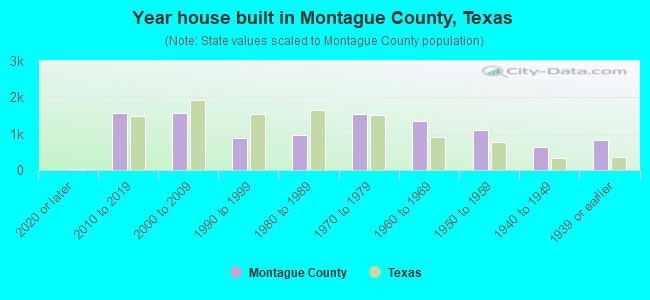
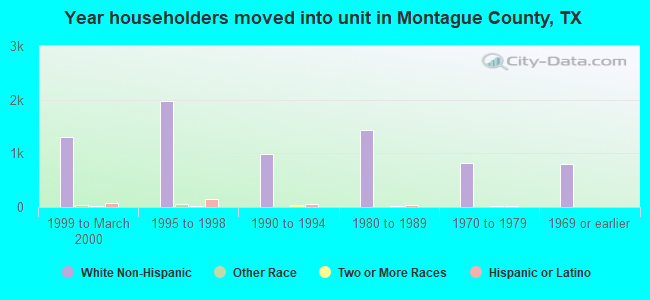
- Year house built in Montague County, Texas
- 1092020 or later
- 1,5702010 to 2019
- 1,3532000 to 2009
- 1,0241990 to 1999
- 1,0021980 to 1989
- 1,5971970 to 1979
- 1,3261960 to 1969
- 9601950 to 1959
- 5311940 to 1949
- 8361939 or earlier
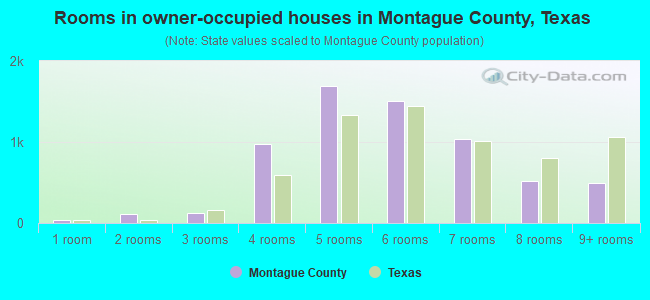
- Rooms in owner-occupied houses in Montague County, Texas
- 441 room
- 1362 rooms
- 1173 rooms
- 1,1084 rooms
- 1,5215 rooms
- 1,6336 rooms
- 9547 rooms
- 5648 rooms
- 6049+ rooms
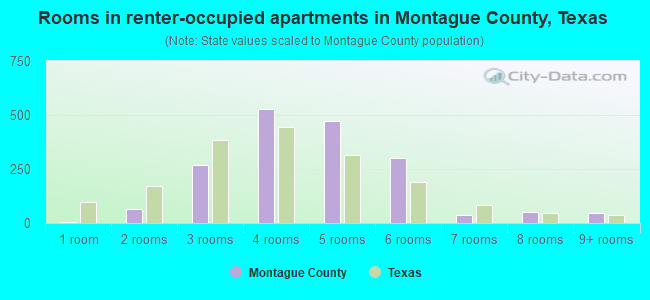
- Rooms in renter-occupied apartments in Montague County, Texas
- 41 room
- 462 rooms
- 3073 rooms
- 4424 rooms
- 4215 rooms
- 2786 rooms
- 247 rooms
- 898 rooms
- 399+ rooms
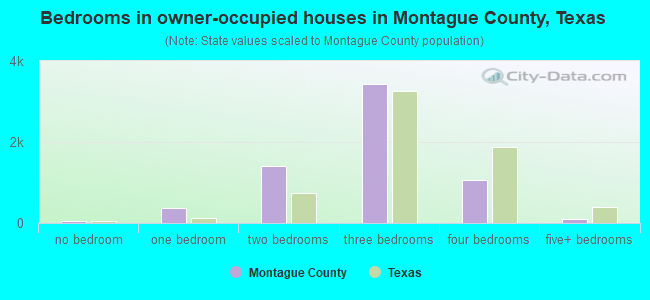
- Bedrooms in owner-occupied houses in Montague County, Texas
- 51no bedroom
- 4701 bedroom
- 1,3272 bedrooms
- 3,5263 bedrooms
- 1,1054 bedrooms
- 1615+ bedrooms
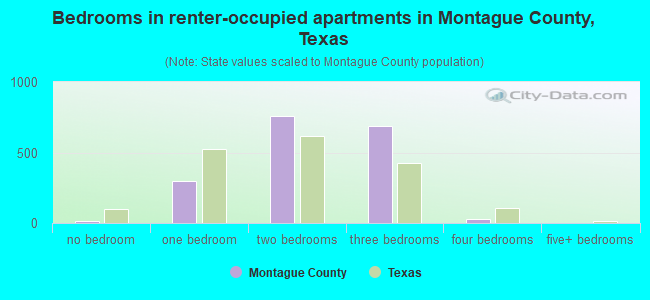
- Bedrooms in renter-occupied apartments in Montague County, Texas
- 20no bedroom
- 2641 bedroom
- 6302 bedrooms
- 7213 bedrooms
- 274 bedrooms
- 05+ bedrooms
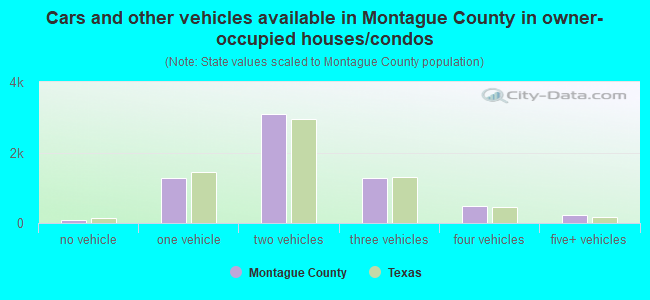
- Cars and other vehicles available in Montague County in owner-occupied houses/condos
- 146no vehicle
- 1,2611 vehicle
- 3,2612 vehicles
- 1,3213 vehicles
- 4774 vehicles
- 1965+ vehicles
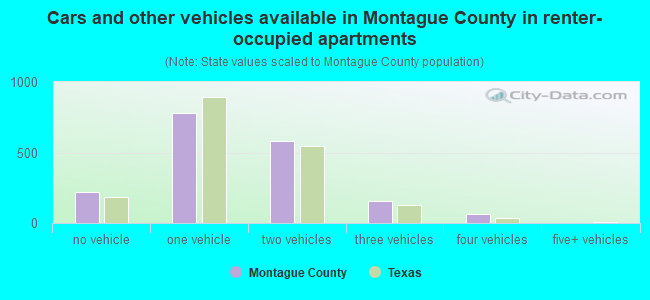
- Cars and other vehicles available in Montague County in renter-occupied apartments
- 252no vehicle
- 7391 vehicle
- 4662 vehicles
- 1663 vehicles
- 674 vehicles
- 25+ vehicles
88.1% of Montague County residents lived in the same house 1 years ago.
Out of people who lived in different houses, 27% lived in this county.
Out of people who lived in different counties, 88% lived in Texas.
| Montague County: | 88.1% |
| State average: | 85.7% |
Place of birth for U.S.-born residents:
- This state: 15,203
- Other state: 4,714
- Northeast: 313
- Midwest: 968
- South: 1,394
- West: 2,079
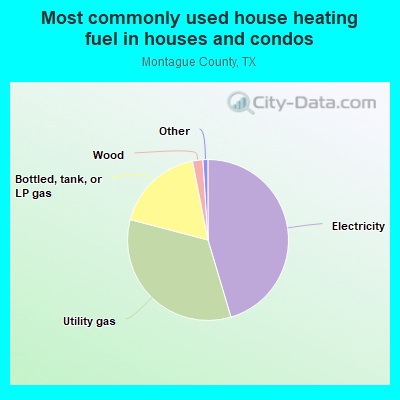
- 45.4%Electricity
- 31.6%Utility gas
- 18.5%Bottled, tank, or LP gas
- 2.6%Wood
- 0.9%Solar energy
- 0.7%Other fuel
- 0.2%Fuel oil, kerosene, etc.
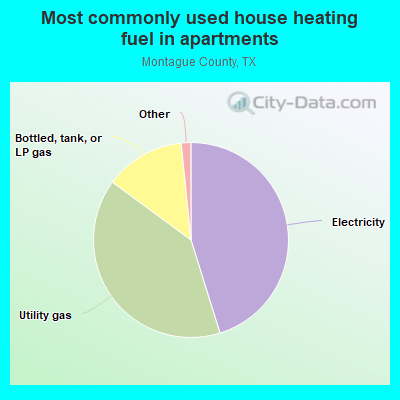
- 53.7%Electricity
- 29.0%Utility gas
- 15.4%Bottled, tank, or LP gas
- 1.1%No fuel used
- 0.9%Wood
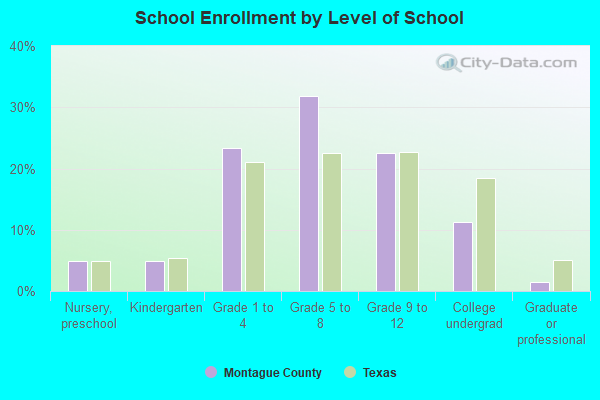
Private vs. public school enrollment:
| Here: | 5.2% |
| Texas: | 8.8% |
| Here: | 8.3% |
| Texas: | 8.0% |
| Here: | 41.1% |
| Texas: | 16.2% |
Montague County government finances - Expenditure in 2017:
- Charges - Other: $420,000
Regular Highways: $66,000
- Construction - General Public Buildings: $34,000
- Current Operations - Regular Highways: $2,578,000
Judicial and Legal Services: $1,553,000
Correctional Institutions: $1,484,000
Police Protection: $1,179,000
Central Staff Services: $920,000
General Public Buildings: $781,000
Financial Administration: $587,000
Public Welfare, Vendor Payments for Medical Care: $187,000
General - Other: $166,000
Corrections - Other: $138,000
Health - Other: $74,000
Public Welfare, Vendor Payments for Other Purposes: $62,000
Local Fire Protection: $11,000
- Federal Intergovernmental - Highways: $2,000
Natural Resources: $1,000
- General - Interest on Debt: $9,000
- Local Intergovernmental - General Local Government Support: $171,000
- Long Term Debt - Beginning Outstanding - Unspecified Public Purpose: $230,000
Outstanding Unspecified Public Purpose: $230,000
- Miscellaneous - Fines and Forfeits: $1,072,000
Sale of Property: $47,000
Royalties: $38,000
General Revenue - Other: $32,000
Interest Earnings: $11,000
- Other Capital Outlay - Regular Highways: $225,000
Police Protection: $52,000
General Public Building: $47,000
Correctional Institutions: $45,000
Judicial and Legal Services: $18,000
Financial Administration: $17,000
Central Staff Services: $2,000
- Other Funds - Cash and Securities: $4,614,000
- State Intergovernmental - Other: $101,000
Highways: $37,000
Public Welfare: $26,000
Health and Hospitals: $8,000
- Tax - Property: $7,687,000
Motor Vehicle License: $1,019,000
Alcoholic Beverage License: $3,000
- Total Salaries and Wages: $3,160,000
Montague County government finances - Revenue in 2017:
- Charges - Other: $420,000
Regular Highways: $66,000
- Construction - General Public Buildings: $34,000
- Current Operations - Regular Highways: $2,578,000
Judicial and Legal Services: $1,553,000
Correctional Institutions: $1,484,000
Police Protection: $1,179,000
Central Staff Services: $920,000
General Public Buildings: $781,000
Financial Administration: $587,000
Public Welfare, Vendor Payments for Medical Care: $187,000
General - Other: $166,000
Corrections - Other: $138,000
Health - Other: $74,000
Public Welfare, Vendor Payments for Other Purposes: $62,000
Local Fire Protection: $11,000
- Federal Intergovernmental - Highways: $2,000
Natural Resources: $1,000
- General - Interest on Debt: $9,000
- Local Intergovernmental - General Local Government Support: $171,000
- Long Term Debt - Beginning Outstanding - Unspecified Public Purpose: $230,000
Outstanding Unspecified Public Purpose: $230,000
- Miscellaneous - Fines and Forfeits: $1,072,000
Sale of Property: $47,000
Royalties: $38,000
General Revenue - Other: $32,000
Interest Earnings: $11,000
- Other Capital Outlay - Regular Highways: $225,000
Police Protection: $52,000
General Public Building: $47,000
Correctional Institutions: $45,000
Judicial and Legal Services: $18,000
Financial Administration: $17,000
Central Staff Services: $2,000
- Other Funds - Cash and Securities: $4,614,000
- State Intergovernmental - Other: $101,000
Highways: $37,000
Public Welfare: $26,000
Health and Hospitals: $8,000
- Tax - Property: $7,687,000
Motor Vehicle License: $1,019,000
Alcoholic Beverage License: $3,000
- Total Salaries and Wages: $3,160,000
Montague County government finances - Debt in 2017:
- Charges - Other: $420,000
Regular Highways: $66,000
- Construction - General Public Buildings: $34,000
- Current Operations - Regular Highways: $2,578,000
Judicial and Legal Services: $1,553,000
Correctional Institutions: $1,484,000
Police Protection: $1,179,000
Central Staff Services: $920,000
General Public Buildings: $781,000
Financial Administration: $587,000
Public Welfare, Vendor Payments for Medical Care: $187,000
General - Other: $166,000
Corrections - Other: $138,000
Health - Other: $74,000
Public Welfare, Vendor Payments for Other Purposes: $62,000
Local Fire Protection: $11,000
- Federal Intergovernmental - Highways: $2,000
Natural Resources: $1,000
- General - Interest on Debt: $9,000
- Local Intergovernmental - General Local Government Support: $171,000
- Long Term Debt - Beginning Outstanding - Unspecified Public Purpose: $230,000
Outstanding Unspecified Public Purpose: $230,000
- Miscellaneous - Fines and Forfeits: $1,072,000
Sale of Property: $47,000
Royalties: $38,000
General Revenue - Other: $32,000
Interest Earnings: $11,000
- Other Capital Outlay - Regular Highways: $225,000
Police Protection: $52,000
General Public Building: $47,000
Correctional Institutions: $45,000
Judicial and Legal Services: $18,000
Financial Administration: $17,000
Central Staff Services: $2,000
- Other Funds - Cash and Securities: $4,614,000
- State Intergovernmental - Other: $101,000
Highways: $37,000
Public Welfare: $26,000
Health and Hospitals: $8,000
- Tax - Property: $7,687,000
Motor Vehicle License: $1,019,000
Alcoholic Beverage License: $3,000
- Total Salaries and Wages: $3,160,000
Montague County government finances - Cash and Securities in 2017:
- Charges - Other: $420,000
Regular Highways: $66,000
- Construction - General Public Buildings: $34,000
- Current Operations - Regular Highways: $2,578,000
Judicial and Legal Services: $1,553,000
Correctional Institutions: $1,484,000
Police Protection: $1,179,000
Central Staff Services: $920,000
General Public Buildings: $781,000
Financial Administration: $587,000
Public Welfare, Vendor Payments for Medical Care: $187,000
General - Other: $166,000
Corrections - Other: $138,000
Health - Other: $74,000
Public Welfare, Vendor Payments for Other Purposes: $62,000
Local Fire Protection: $11,000
- Federal Intergovernmental - Highways: $2,000
Natural Resources: $1,000
- General - Interest on Debt: $9,000
- Local Intergovernmental - General Local Government Support: $171,000
- Long Term Debt - Beginning Outstanding - Unspecified Public Purpose: $230,000
Outstanding Unspecified Public Purpose: $230,000
- Miscellaneous - Fines and Forfeits: $1,072,000
Sale of Property: $47,000
Royalties: $38,000
General Revenue - Other: $32,000
Interest Earnings: $11,000
- Other Capital Outlay - Regular Highways: $225,000
Police Protection: $52,000
General Public Building: $47,000
Correctional Institutions: $45,000
Judicial and Legal Services: $18,000
Financial Administration: $17,000
Central Staff Services: $2,000
- Other Funds - Cash and Securities: $4,614,000
- State Intergovernmental - Other: $101,000
Highways: $37,000
Public Welfare: $26,000
Health and Hospitals: $8,000
- Tax - Property: $7,687,000
Motor Vehicle License: $1,019,000
Alcoholic Beverage License: $3,000
- Total Salaries and Wages: $3,160,000
Supplemental Security Income (SSI) in 2006:
- Total number of recipients: 468
- Number of aged recipients: 68
- Number of blind and disabled recipients: 400
- Number of recipients under 18: 48
- Number of recipients between 18 and 64: 309
- Number of recipients older than 64: 111
- Number of recipients also receiving OASDI: 213
- Amount of payments (thousands of dollars): 199
| Most common first names in Montague County, TX among deceased individuals | ||
| Name | Count | Lived (average) |
|---|---|---|
| James | 241 | 74.0 years |
| William | 215 | 76.3 years |
| John | 179 | 77.4 years |
| Mary | 171 | 81.3 years |
| Robert | 109 | 72.1 years |
| Charles | 91 | 72.4 years |
| Ruby | 75 | 80.0 years |
| George | 71 | 76.9 years |
| Willie | 63 | 82.6 years |
| Thomas | 59 | 75.1 years |
| Most common last names in Montague County, TX among deceased individuals | ||
| Last name | Count | Lived (average) |
|---|---|---|
| Smith | 71 | 78.4 years |
| Williams | 70 | 75.0 years |
| Jones | 61 | 77.8 years |
| Johnson | 60 | 75.7 years |
| Brown | 59 | 78.5 years |
| Miller | 55 | 76.5 years |
| Davis | 53 | 78.1 years |
| Martin | 50 | 75.2 years |
| Thompson | 49 | 77.3 years |
| Moore | 49 | 76.3 years |
| Businesses in Montague County, TX | ||||
| Name | Count | Name | Count | |
|---|---|---|---|---|
| AT&T | 1 | La-Z-Boy | 1 | |
| Ace Hardware | 2 | McDonald's | 1 | |
| Best Western | 1 | Pizza Hut | 1 | |
| CVS | 1 | SONIC Drive-In | 1 | |
| Chevrolet | 1 | Subway | 2 | |
| Dairy Queen | 2 | U-Haul | 1 | |
| FedEx | 2 | UPS | 1 | |
| Ford | 1 | Walmart | 1 | |
| H&R Block | 1 | |||
Montague County on our top lists:
- #93 on the list of "Top 101 counties with highest percentage of residents voting for Romney (Republican) in the 2012 Presidential Election"